Upgrade to Pro — share decks privately, control downloads, hide ads and more …

Advanced Debugging with Chrome Dev Tools

Advanced Debugging with Chrome Dev Tools

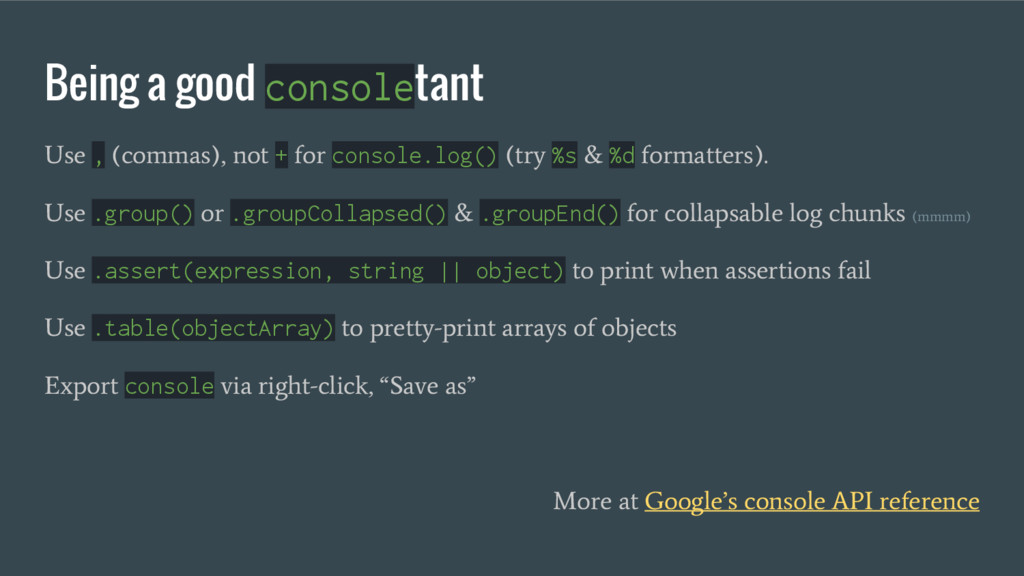
Debugging JavaScript apps can be frustrating, usually defaulting to console logs to get info out of your app. However, this alone is not only inefficient, logs can often result in erratic output, depending upon the nature of the object.

In this session, Wayne will demonstrate features of Chrome Dev Tools that allow developers of every skill level to step through their application's code during even such difficult-to-debug scenarios as asynchronous callbacks, race conditions, and poor performance. He will also demonstrate the use of some new and powerful CSS debugging features that are unknown to many developers.

Wayne Elgin

March 09, 2016
Tweet

More Decks by Wayne Elgin

Other Decks in Programming

Transcript

  1. Dev Tools & You Debug your way to a new

    intelligence Wayne Elgin @esjay
  2. Besides analyzing accessibility, JavaScript, and CSS in real time... •

    Works remotely with Chrome on Android • Used by Electron-based projects (Atom, Slack) • Ties into Node via node-inspector • Stetho (Android) and PonyDebugger (iOS) both use them for native apps Why do Chrome DevTools matter?
  3. Dev on Chrome Canary 10 Weeks From Canary to Stable

    DevTools on the right console drawer opened DevTools experiments enabled Firefox Developer Edition … is also cool For best results
  4. Use , (commas), not + for console.log() (try %s &

    %d formatters). Use .group() or .groupCollapsed() & .groupEnd() for collapsable log chunks (mmmm) Use .assert(expression, string || object) to print when assertions fail Use .table(objectArray) to pretty-print arrays of objects Export console via right-click, “Save as” More at Google’s console API reference Being a good consoletant
  5. Tick the Async checkbox Use the Promises panel (still in

    Experiments) Write your own fetch es Using DevTools with Async JavaScript code
  6. “You do not talk about the color picker & eye

    dropper” “Oh, and also, you do not talk about the bezier curve editor” “And if this is your first time at CSS club, you have to use the Animations panel.” “Use the keyframes editor to neutralize the burn” “Either way, you should really take a hard look at render timelines.” “The rules of CSS club…”
  7. Set up workspaces for source mapping Use Node-Inspector for DevTools

    in Node Remote debugging via Remote Debug Gateway Be more comfortable with DevTools Author Bonus Points