Upgrade to Pro — share decks privately, control downloads, hide ads and more …

Debugging & Profiling of AWS Lambda: Serverless...

Debugging & Profiling of AWS Lambda: ServerlessConf - IOpipe

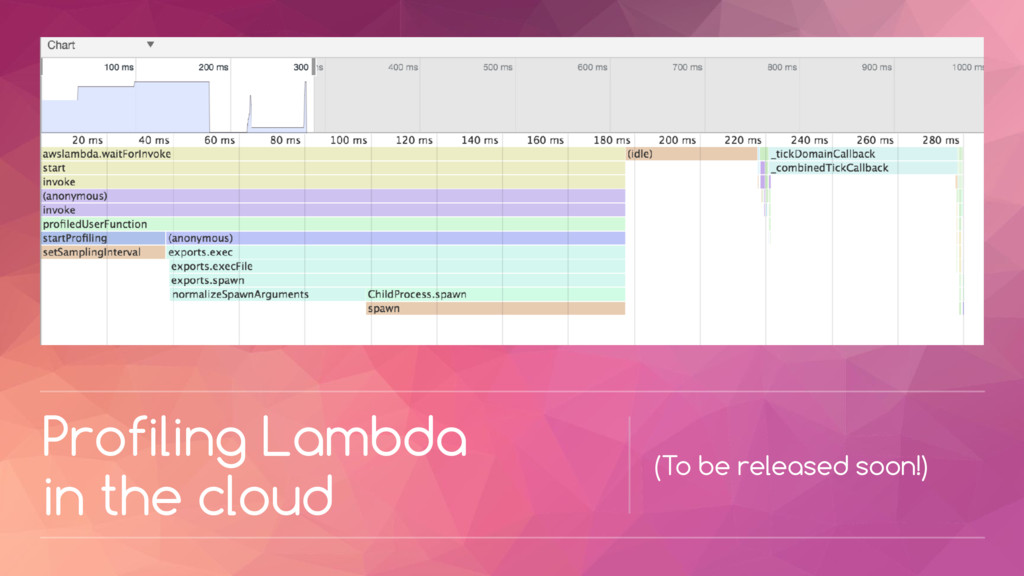
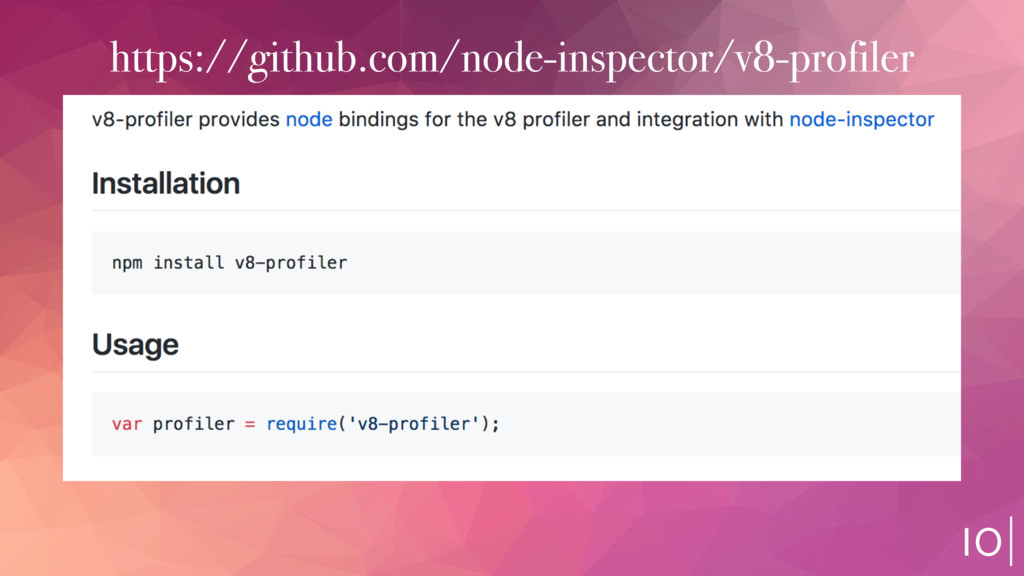
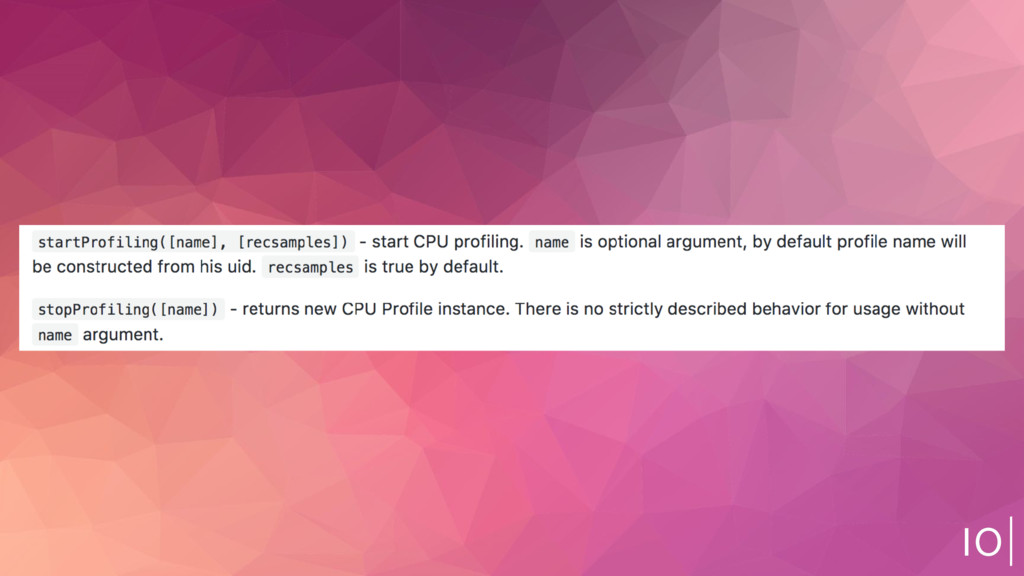
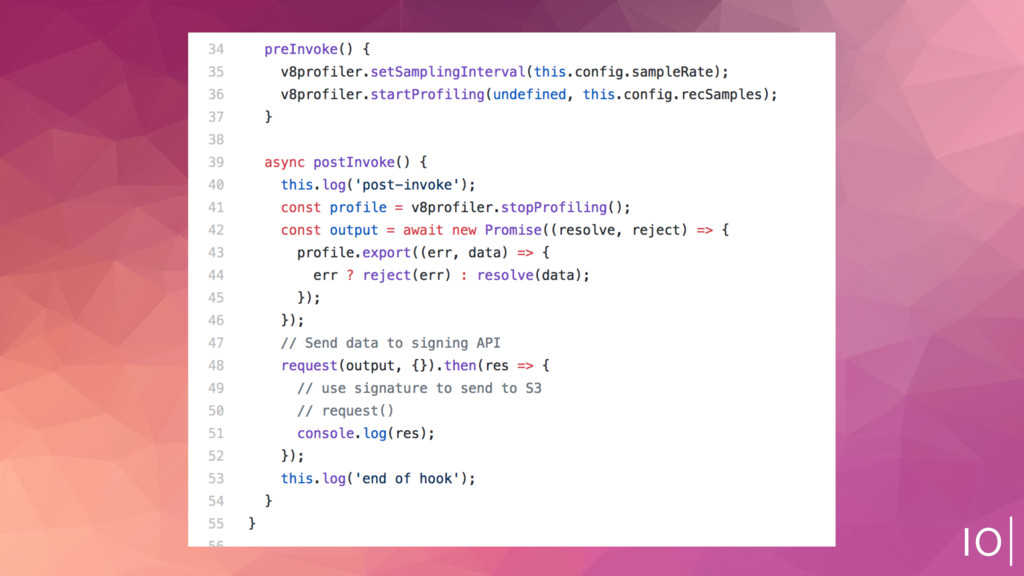
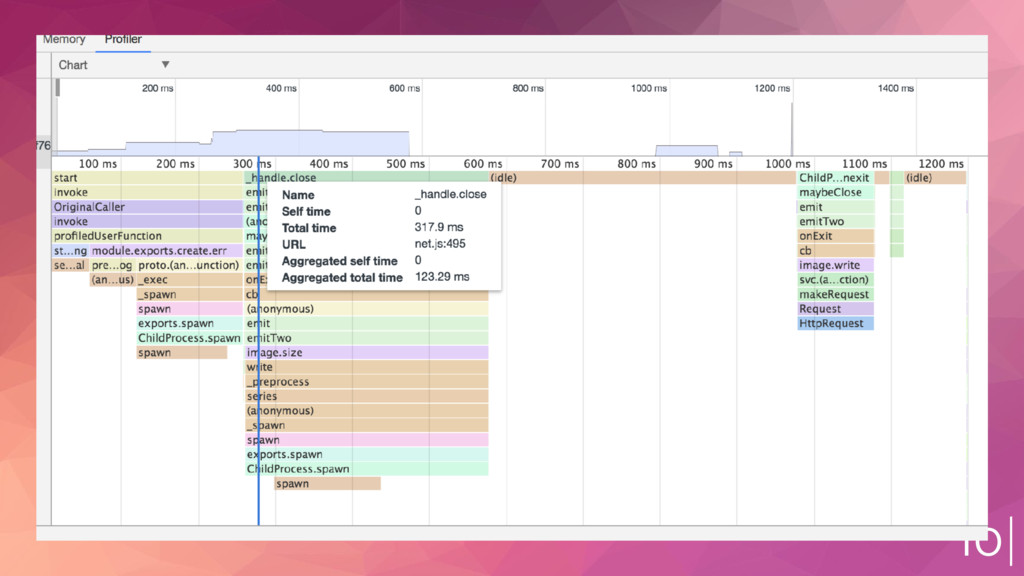
Exploring the debugging and profiling tools for AWS Lambda. We use the v8-profiler for NodeJS with IOpipe to see deep into a serverless application and trace function calls. https://www.iopipe.com

Avatar for Erica Windisch

Erica Windisch

October 11, 2017

More Decks by Erica Windisch

Other Decks in Technology

Transcript

  1. Erica Windisch CTO & Founder IOpipe, Inc. Former maintainer of

    Docker & OpenStack Building cloud, ops, and infrastructure tooling for over 15 years.
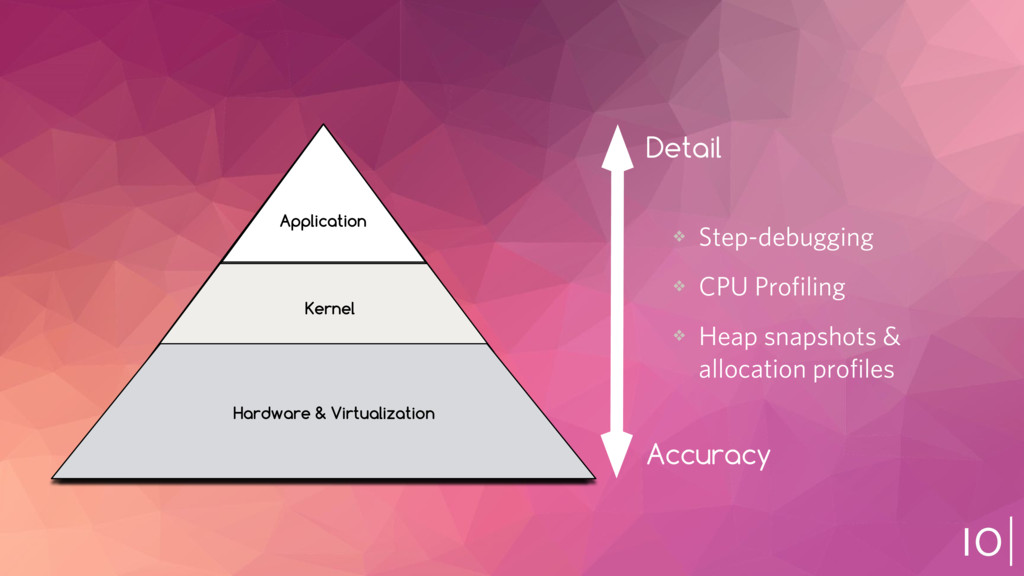
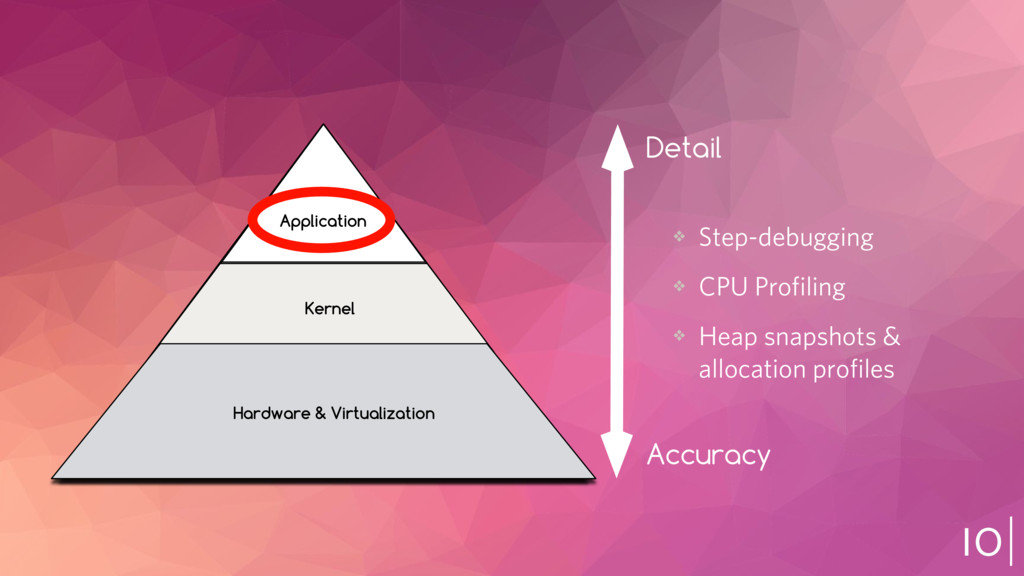
  2. Kernel Hardware & Virtualization Application Detail Accuracy ❖ Step-debugging ❖

    CPU Profiling ❖ Heap snapshots &
 allocation profiles
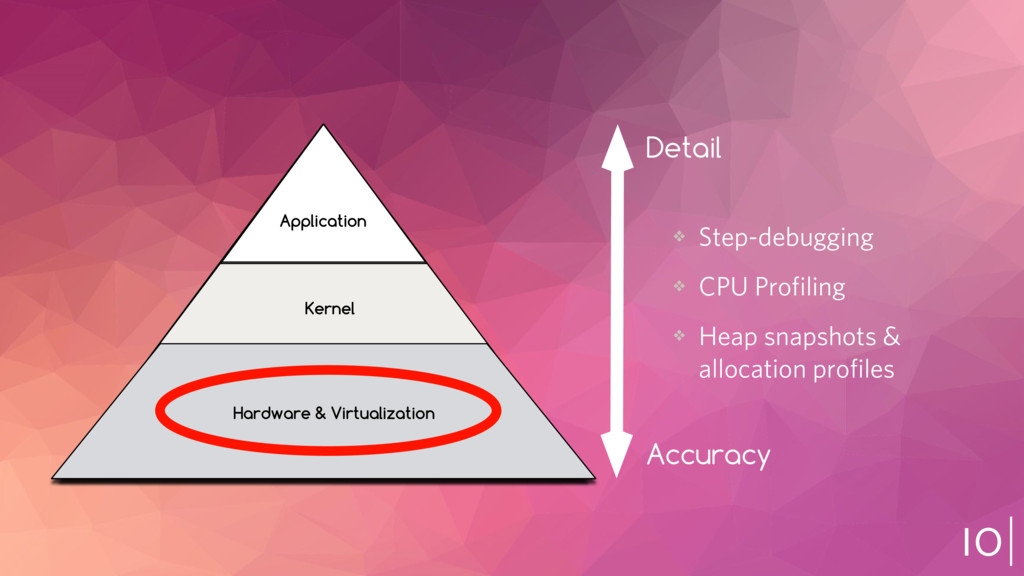
  3. Kernel Hardware & Virtualization Application Detail Accuracy ❖ Step-debugging ❖

    CPU Profiling ❖ Heap snapshots &
 allocation profiles
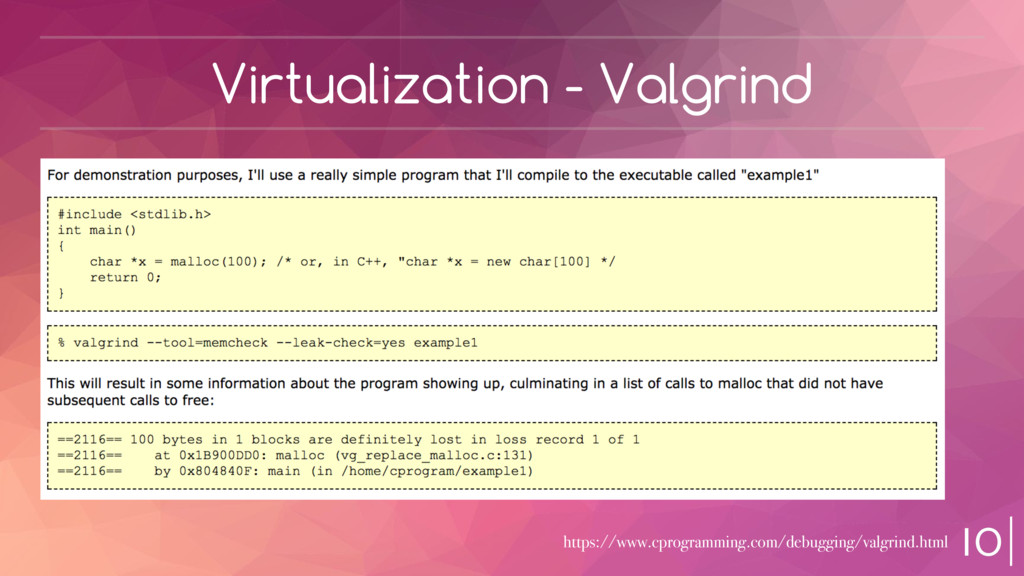
  4. Kernel Hardware & Virtualization Application Detail Accuracy ❖ Step-debugging ❖

    CPU Profiling ❖ Heap snapshots &
 allocation profiles
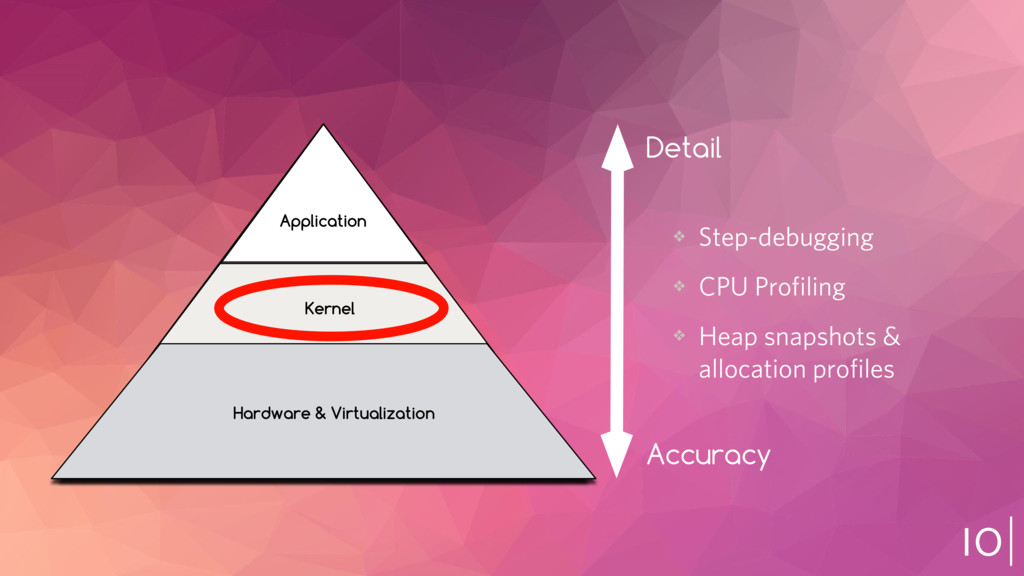
  5. Kernel Hardware & Virtualization Application Detail Accuracy ❖ Step-debugging ❖

    CPU Profiling ❖ Heap snapshots &
 allocation profiles
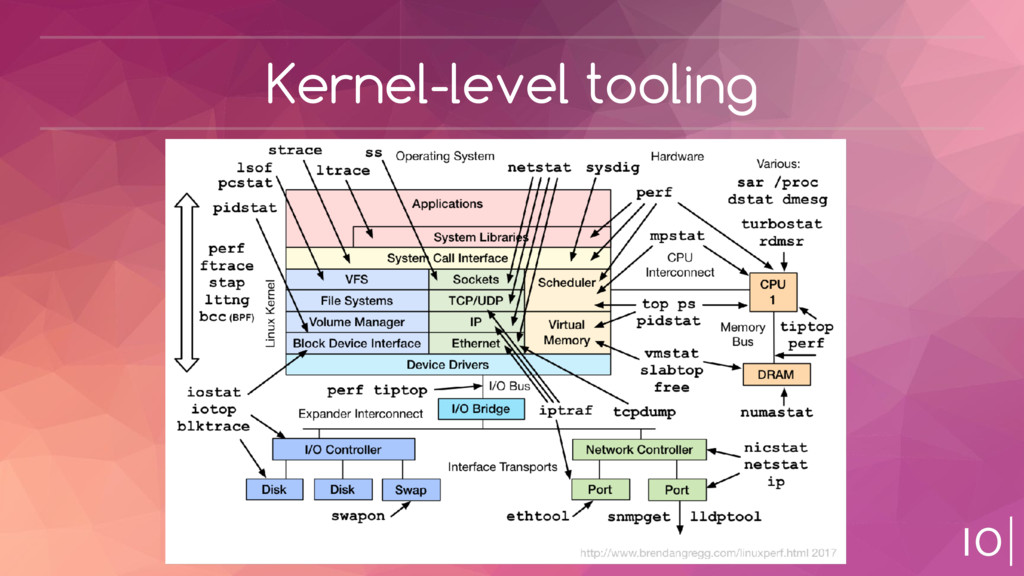
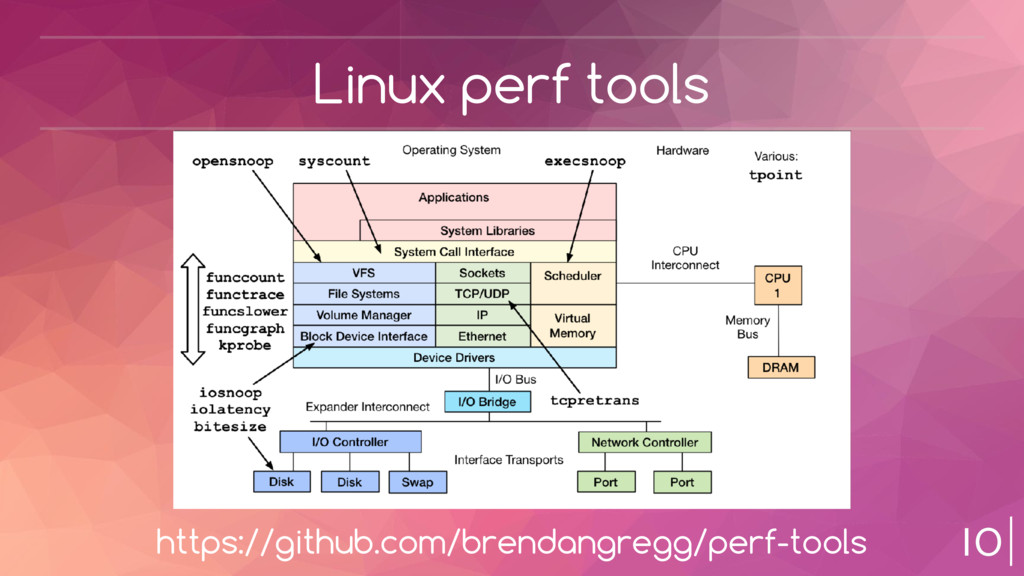
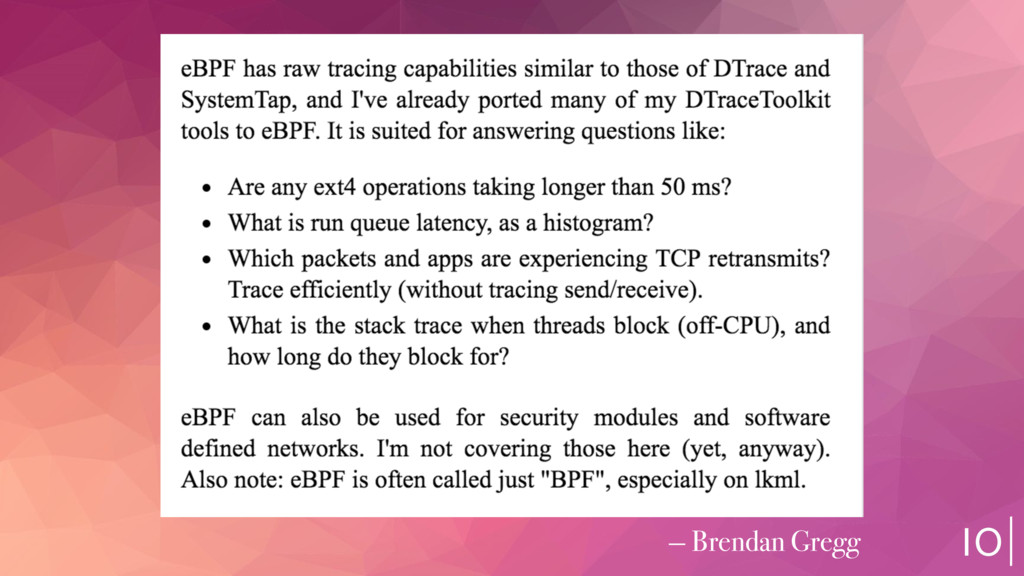
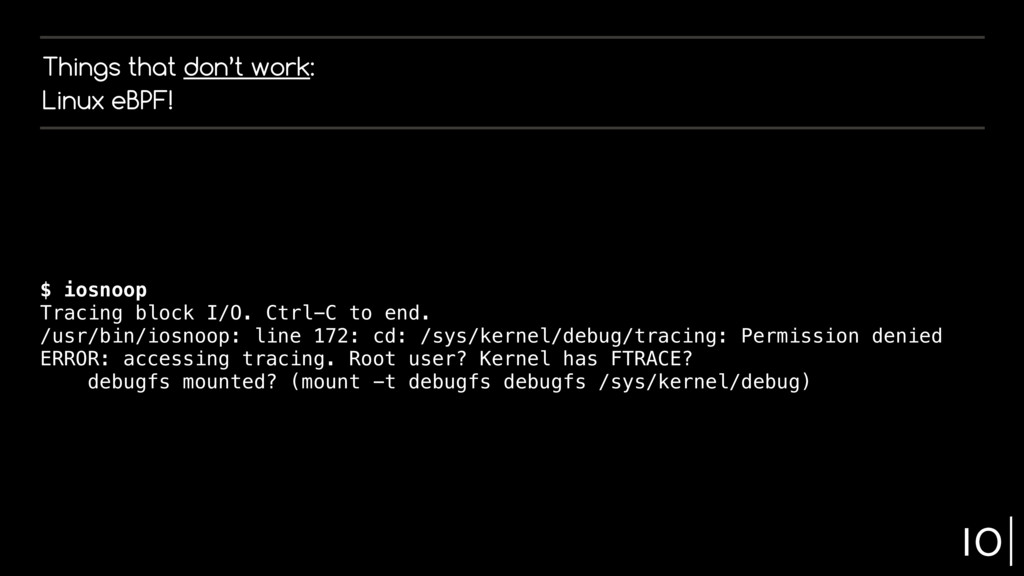
  6. Things that don’t work: Linux eBPF! $ iosnoop Tracing block

    I/O. Ctrl-C to end. /usr/bin/iosnoop: line 172: cd: /sys/kernel/debug/tracing: Permission denied ERROR: accessing tracing. Root user? Kernel has FTRACE? debugfs mounted? (mount -t debugfs debugfs /sys/kernel/debug)
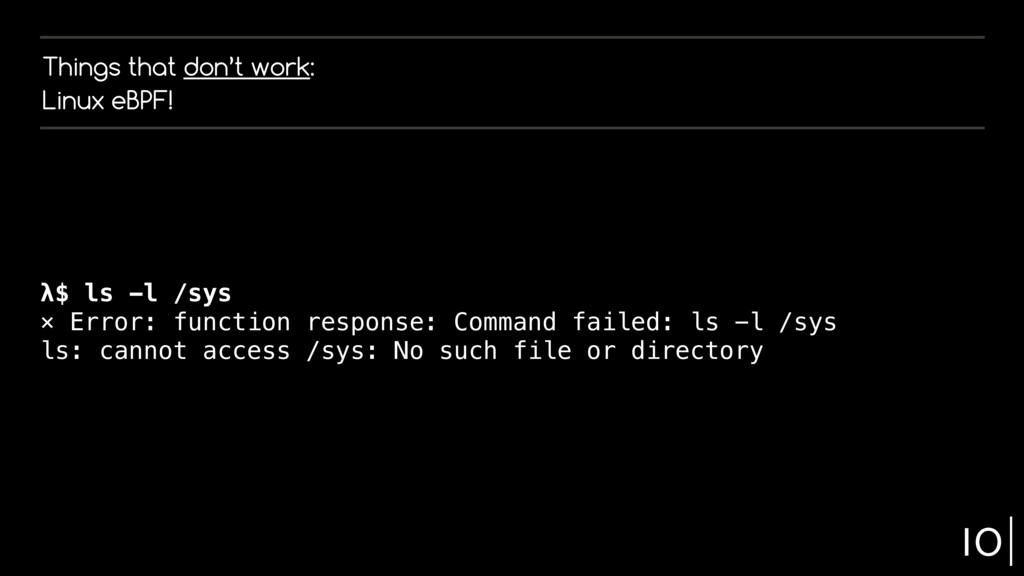
  7. Things that don’t work: Linux eBPF! λ$ ls -l /sys

    ⨯ Error: function response: Command failed: ls -l /sys ls: cannot access /sys: No such file or directory
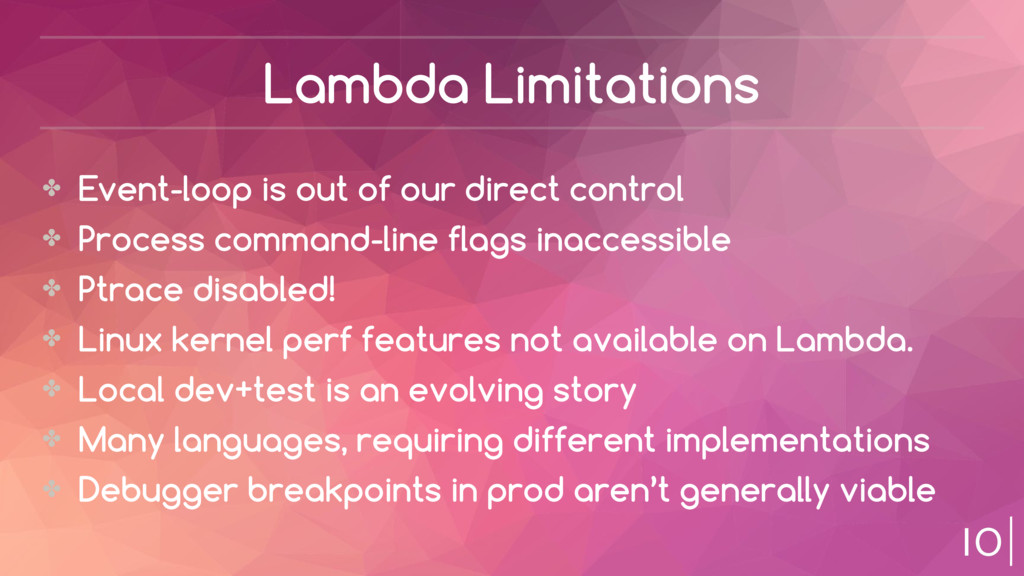
  8. Lambda Limitations ✤ Event-loop is out of our direct control

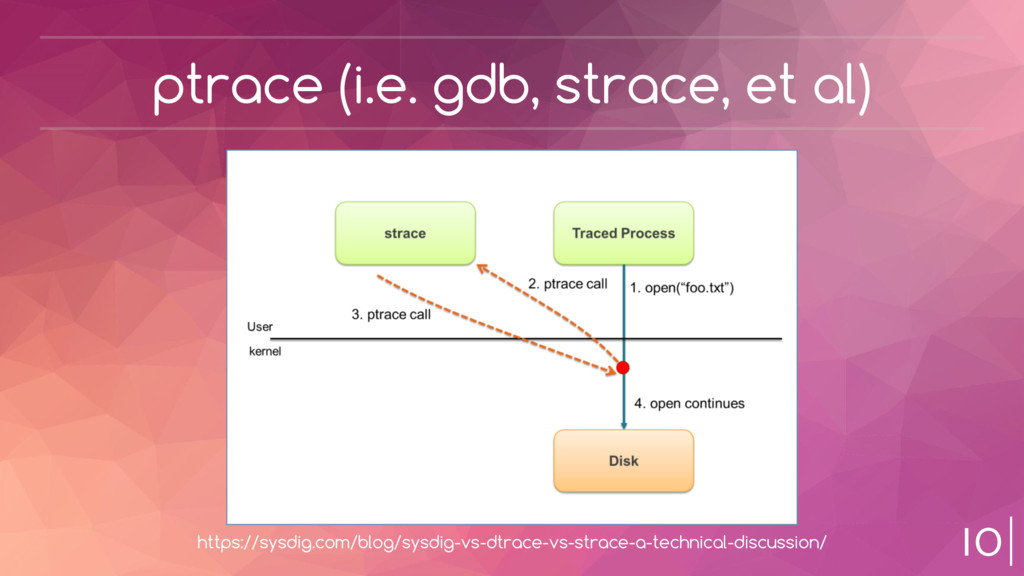
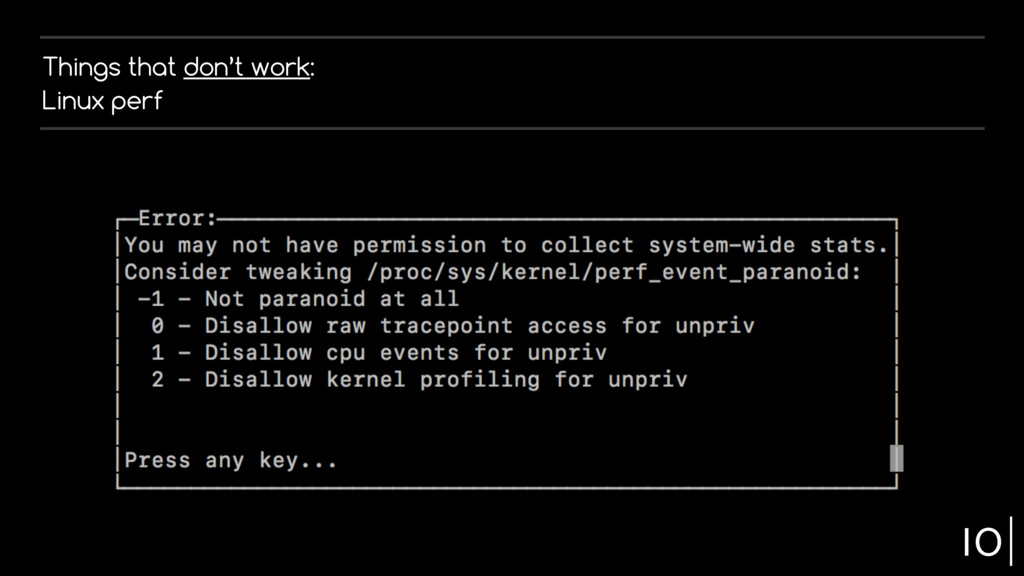
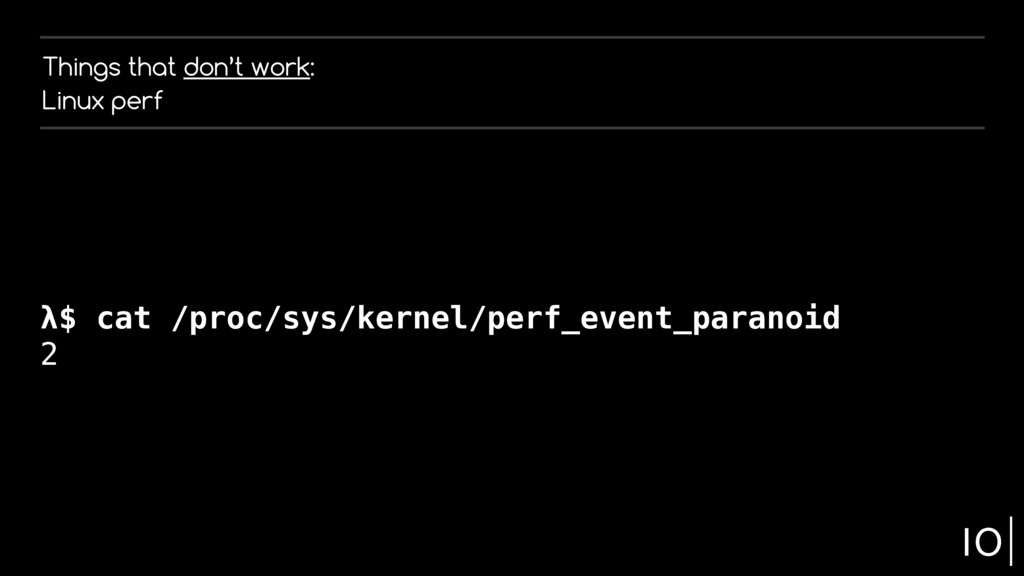
    ✤ Process command-line flags inaccessible ✤ Ptrace disabled! ✤ Linux kernel perf features not available on Lambda. ✤ Local dev+test is an evolving story ✤ Many languages, requiring different implementations ✤ Debugger breakpoints in prod aren’t generally viable