Upgrade to Pro
— share decks privately, control downloads, hide ads and more …
Speaker Deck
Features
Speaker Deck
PRO
Sign in
Sign up for free
Search
Search
Understanding XHProf: Pinpointing Why Your Site...
Search
Ezra Gildesgame
April 19, 2014
Programming
210
0
Share
Embed
Copy iframe code
Copy JS code
Copy link
Start on current slide
Understanding XHProf: Pinpointing Why Your Site is Slow and How to Fix It
Ezra Gildesgame
April 19, 2014
Other Decks in Programming
See All in Programming
地域 SRE コミュニティ最前線 - ホンマでっかSRE勉強会
tk3fftk
0
270
音楽のための関数型プログラミング言語mimiumにおける多段階計算の活用
tomoyanonymous
1
350
なぜ型を書くのか? TSKaigi2026で改めて考える #tskaigi_smarthr
kajitack
0
400
自作OSでスライド発表する
uyuki234
1
3.9k
吝嗇家のためのAI活用 / AI development for miser - ChatGPT + Issue Driven Development
tooppoo
0
190
yield再入門 #phpcon
o0h
PRO
0
710
エンジニアにデザインハーネスを 〜デザインプロセスを規定するためのハーネス〜 / Design harness from an engineer's perspective
rkaga
2
1.6k
AI がコードを書く時代における新卒エンジニアの仕事風景 (2026) / New Graduate Engineers in the Era of AI Coding (2026)
sushichan044
0
230
Lean は証明の正しさを確認するためだけのツールって思ってませんか?
inoueasei
1
100
【やさしく解説 設計編 #1】「ドメイン駆動」と「実装駆動」ってなに? 〜設計の考え方を、たとえ話で学ぼう〜
panda728
PRO
1
120
Terraform標準の組織で AWS CDKをどう使うか
mu7889yoon
1
350
Foundation Models frameworkで画像分析
ryodeveloper
1
130
Featured
See All Featured
RailsConf & Balkan Ruby 2019: The Past, Present, and Future of Rails at GitHub
eileencodes
141
35k
CoffeeScript is Beautiful & I Never Want to Write Plain JavaScript Again
sstephenson
162
16k
Impact Scores and Hybrid Strategies: The future of link building
tamaranovitovic
0
340
Marketing Yourself as an Engineer | Alaka | Gurzu
gurzu
0
260
Winning Ecommerce Organic Search in an AI Era - #searchnstuff2025
aleyda
1
2.1k
Let's Do A Bunch of Simple Stuff to Make Websites Faster
chriscoyier
508
140k
[RailsConf 2023 Opening Keynote] The Magic of Rails
eileencodes
31
10k
Improving Core Web Vitals using Speculation Rules API
sergeychernyshev
21
1.5k
Visualizing Your Data: Incorporating Mongo into Loggly Infrastructure
mongodb
49
10k
Exploring the Power of Turbo Streams & Action Cable | RailsConf2023
kevinliebholz
37
6.5k
Building Adaptive Systems
keathley
44
3.1k
Design and Strategy: How to Deal with People Who Don’t "Get" Design
morganepeng
133
19k
Transcript
Understanding XHProf Pinpointing Why Your Site is Slow and How
to Fix It Ezra Gildesgame - Acquia @ezrabg Stanford Drupal Camp 2014
The Problem: Slow Websites/Web apps • Unhappy users leave •
Severs can’t sustain load
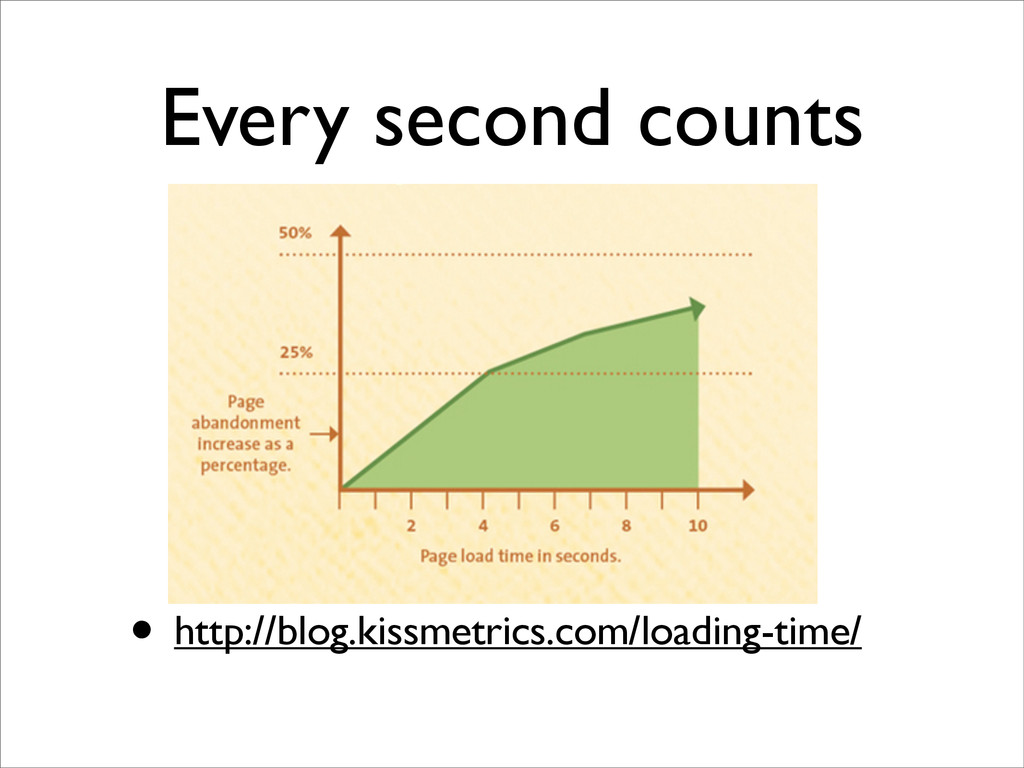
Every second counts • http://blog.kissmetrics.com/loading-time/
XHProf provides information about execution time • Time spent by
the server to generate page sent to the web browser (or API endpoint) • Also measures memory & CPU usage
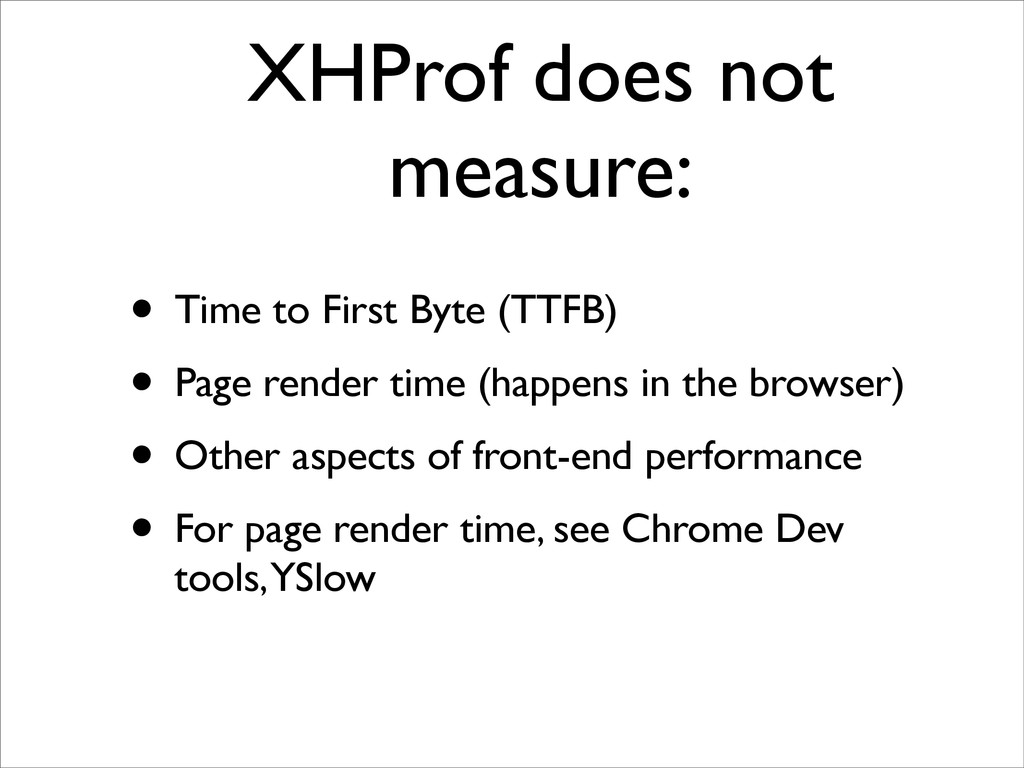
XHProf does not measure: • Time to First Byte (TTFB)
• Page render time (happens in the browser) • Other aspects of front-end performance • For page render time, see Chrome Dev tools, YSlow
Our goal: Reduce page execution time • Improve user experience
• Improve concurrency and efficient use of server resources.
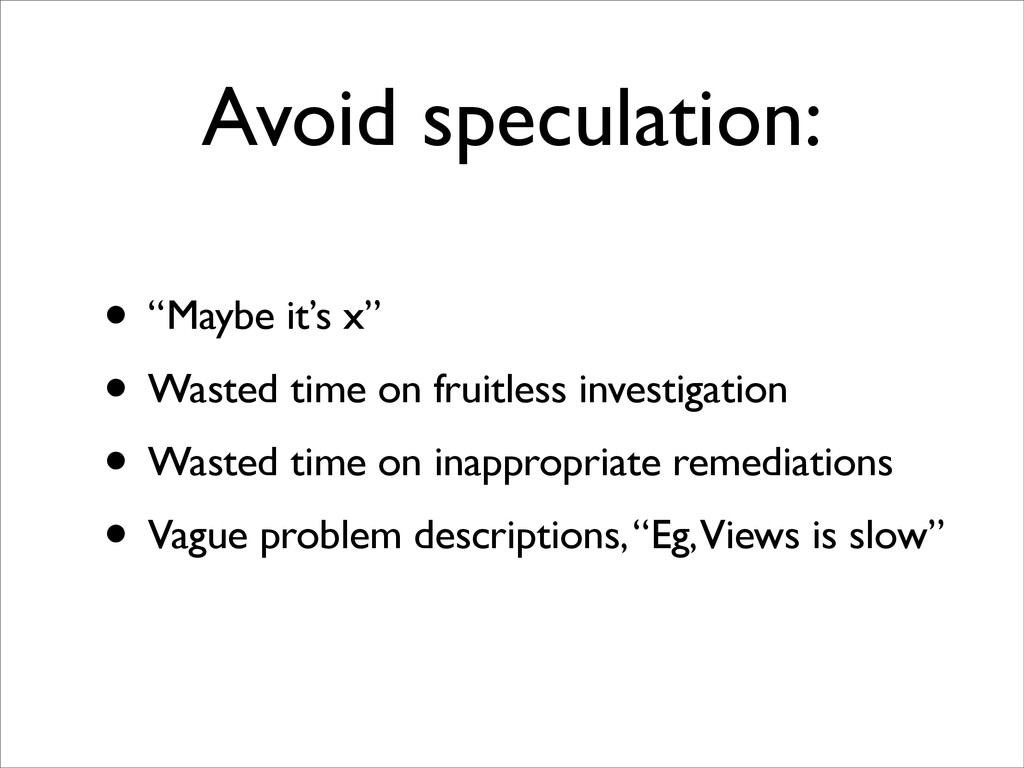
Avoid speculation: • “Maybe it’s x” • Wasted time on
fruitless investigation • Wasted time on inappropriate remediations • Vague problem descriptions, “Eg, Views is slow”
Misconceptions
Misconceptions
Be smart, m’kay? • Tools like Views & Panels empower
you to do inefficient things but aren’t necessarily bad for performance • Views render & query, Panels pane caches are great tools to improve performance
Example problem statement • “Entity loads are slow because when
we load entities, we load field X which also loads Y data, which spends Z time in the database. Page A loads 1,000 entities of type X.”
Use XHProf to • Pinpoint the root cause of performance
problems • Develop a surgical remediation plan
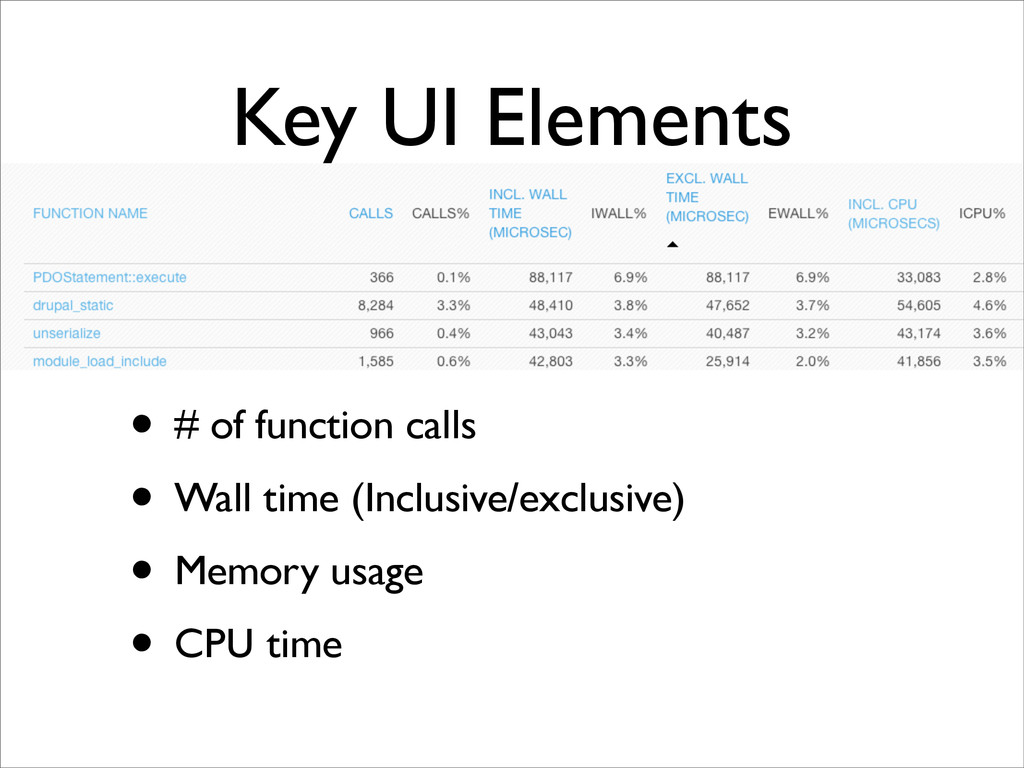
Key UI Elements • # of function calls • Wall
time (Inclusive/exclusive) • Memory usage • CPU time
Exclusive/Inclusive • Exclusive: This function only • Inclusive: This function
and all child functions
CPU Time vs Wall Time • CPU Time: Time spent
by the CPU • Wall time: Time including disk I/O • CPU time != Wall time? Likely waiting for disk
We may find: • Function called many times unnecessarily •
Consider a static cache
We may find: • Slow queries • Execute page again
with Devel query log, use built-in explain feature
We may find: • Many fast queries that stack up
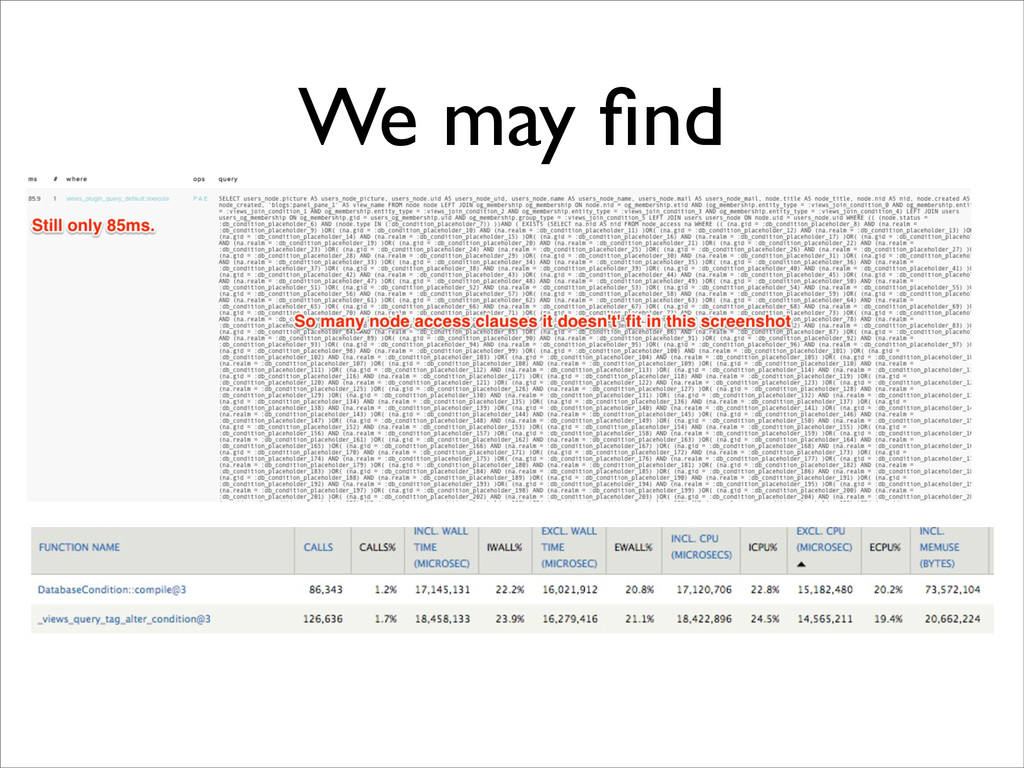
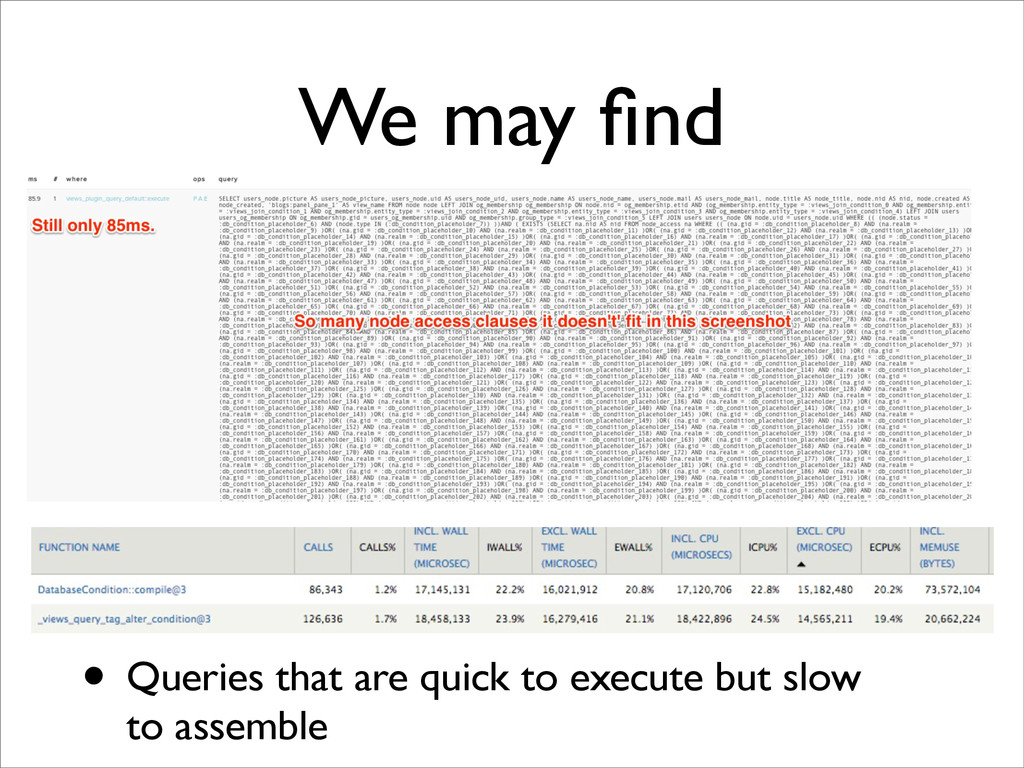
We may find
We may find • Queries that are quick to execute
but slow to assemble
We may find: • Excessive entity loads • Excessive calls
to memcache set/get
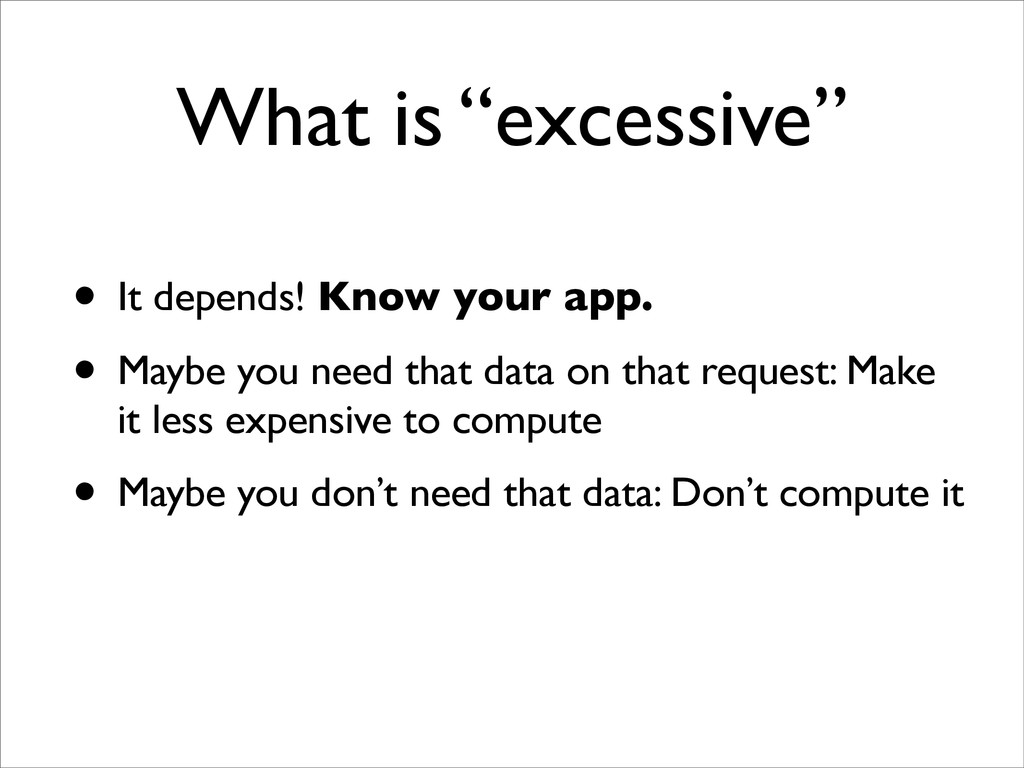
What is “excessive” • It depends! Know your app. •
Maybe you need that data on that request: Make it less expensive to compute • Maybe you don’t need that data: Don’t compute it
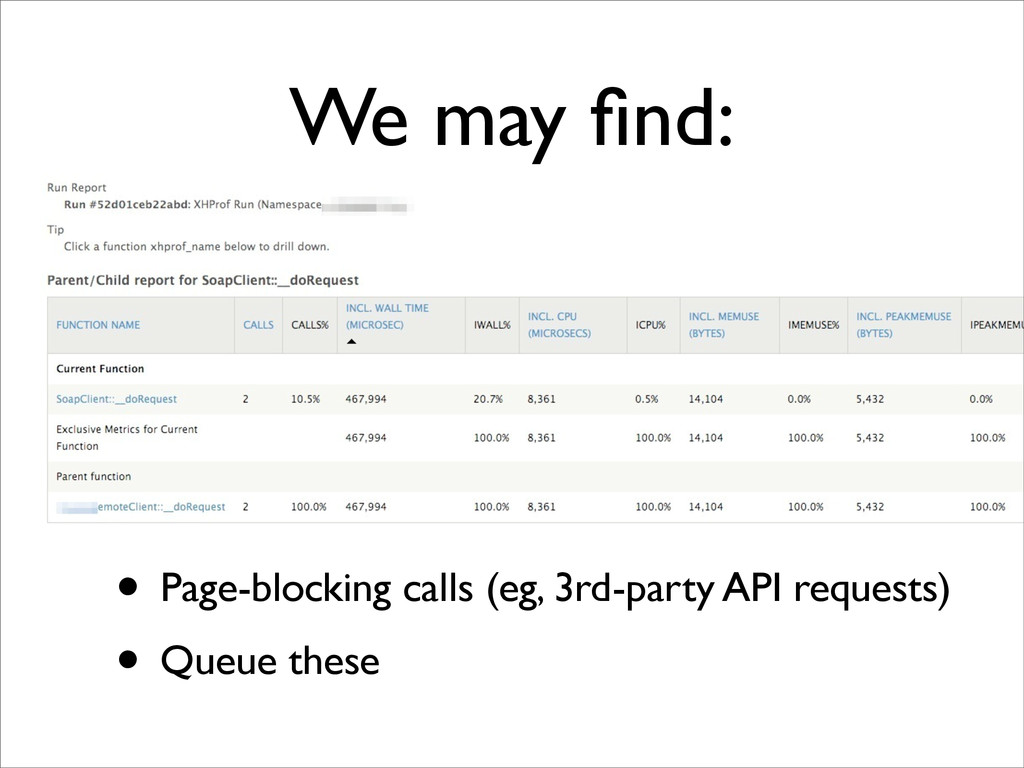
We may find: • Page-blocking calls (eg, 3rd-party API requests)
• Queue these
We may find: • Excessive calls to watchdog() • Notices
can slow down your site. • Fix those notices!
We may find: • Views/Panels render time - Dig deeper!
We may find:
Getting started • Brew install xhprof • Install: http://drupal.org/project/xhprof •
Alternative: https://github.com/ msonnabaum/xhprof-single-file
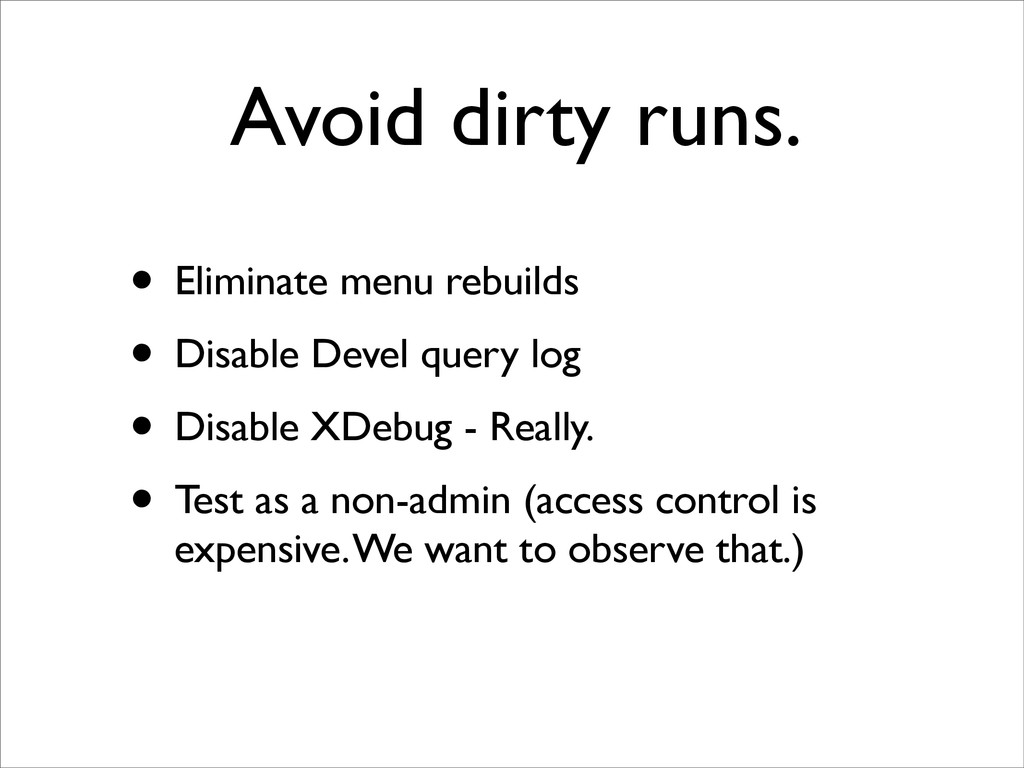
Avoid dirty runs. • Eliminate menu rebuilds • Disable Devel
query log • Disable XDebug - Really. • Test as a non-admin (access control is expensive. We want to observe that.)
Know which caches are in place • Views caches (Disable
Views caches: https:// gist.github.com/msonnabaum/9671947) • Panels Caches • Other caches
Other caches
“ZOMG! The site is slow!” • ORLY • Develop a
plan to measure and set goals
“Slow” Define success with specific performance goals • Execution time
on specific page logged in as specific user under specific conditions • Quantify improvements on a per-page basis
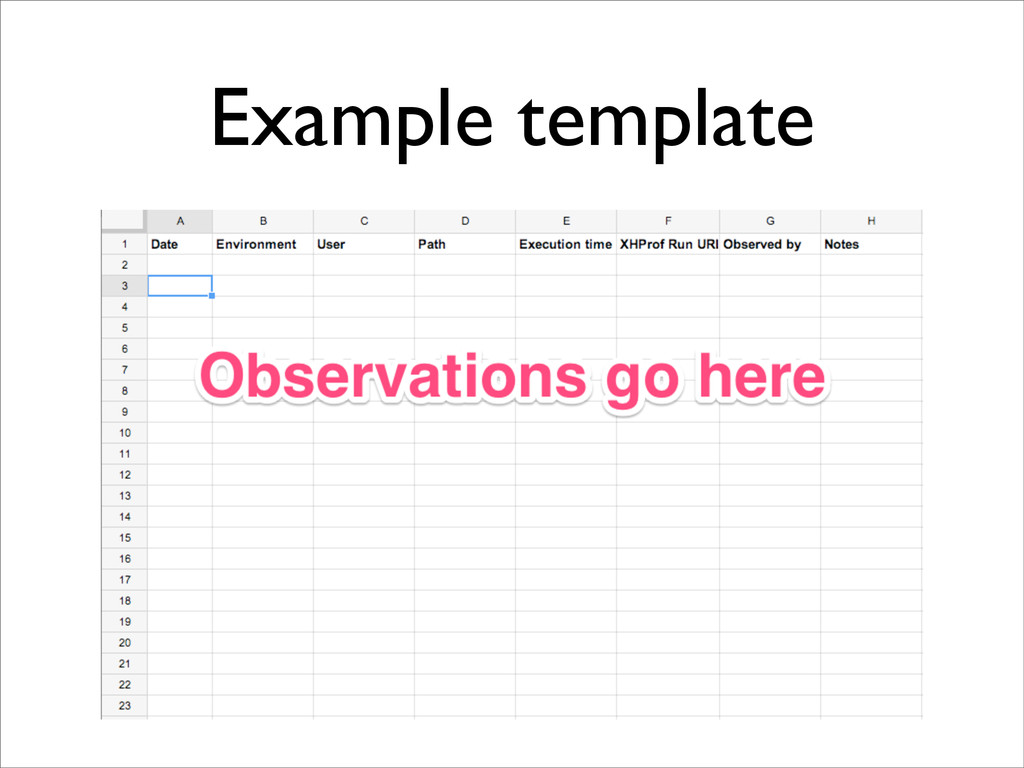
Example template
Case examples
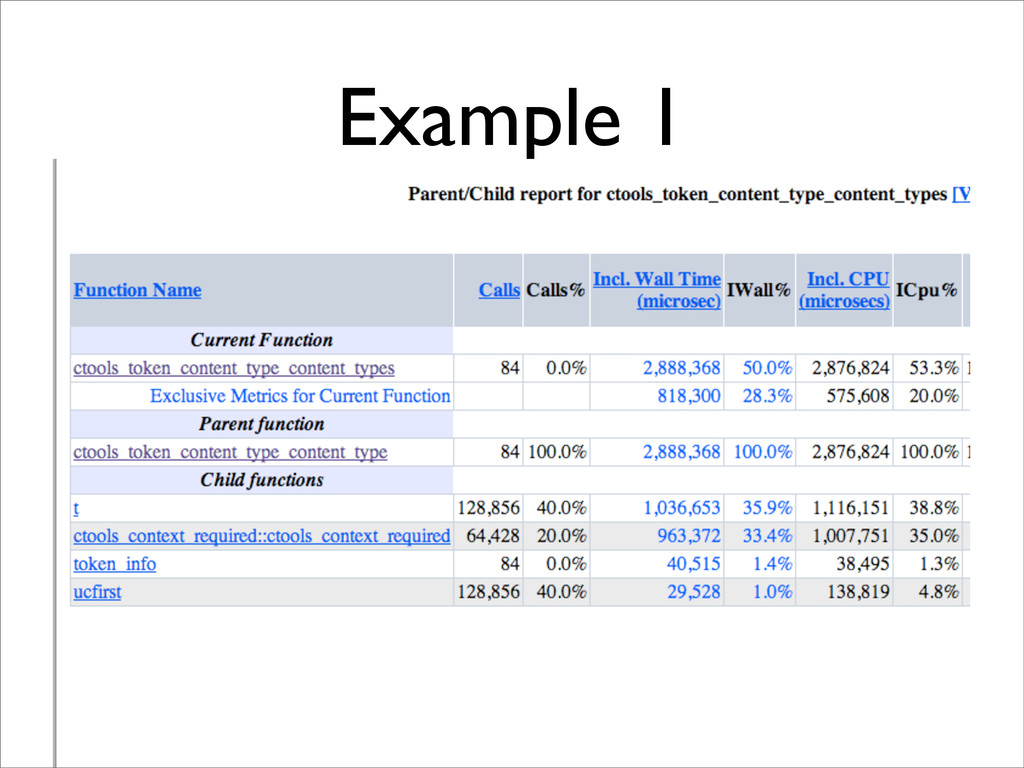
Example 1
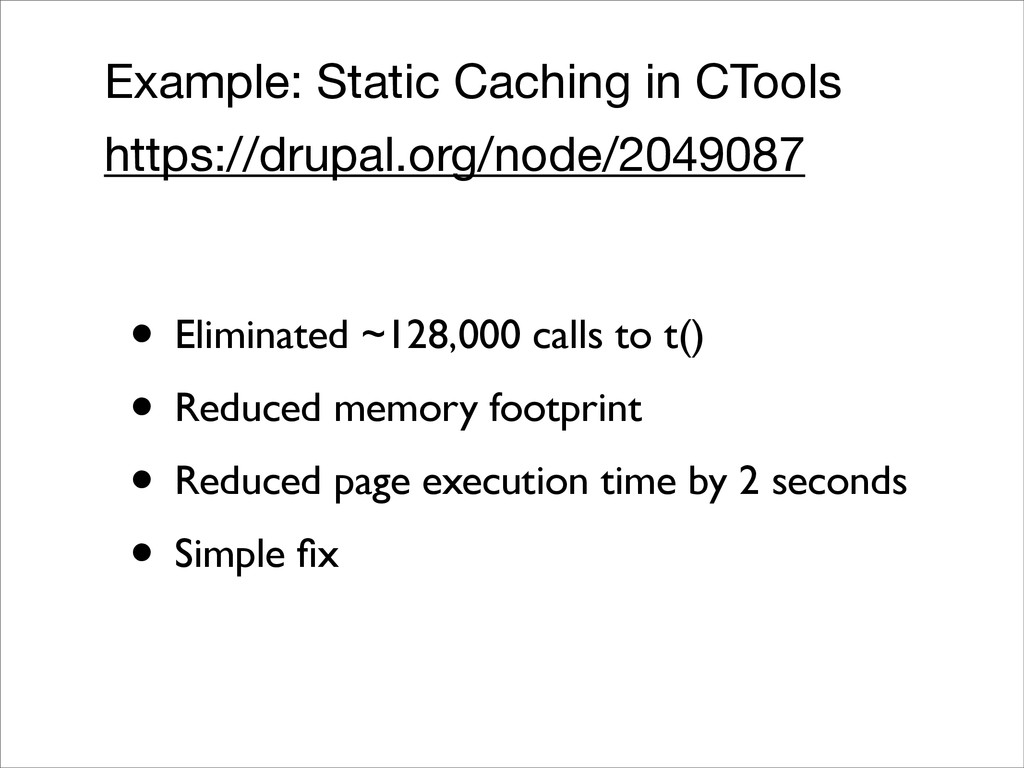
Example: Static Caching in CTools https://drupal.org/node/2049087 • Eliminated ~128,000 calls
to t() • Reduced memory footprint • Reduced page execution time by 2 seconds • Simple fix
Example: Static caching of node access grants https://drupal.org/comment/8495029 • node_access_grants()
never changes within a request • Why compute it multiple times within a request?
Example: Avoid unnecessary entity loads https://drupal.org/node/2169099
Optimize node access query building https://drupal.org/comment/8516319
Questions?