Upgrade to Pro — share decks privately, control downloads, hide ads and more …

Explain This!

Explain This!

Como encontrar consultas lentas no PostgreSQL e como analisar o seu plano de execução.

Palestra realizada no PGConf.Brasil 2018: https://www.pgconf.com.br/2018/

Fábio Telles Rodriguez

August 03, 2018
Tweet

More Decks by Fábio Telles Rodriguez

Other Decks in Programming

Transcript

  1. Fábio Telles Rodriguez • Consultor pela Timbira • DBA Oracle

    e PostgreSQL + 15 anos • Colaborador da Comunidade Brasileira de PostgreSQL • Blog: savepoint.blog.br • email: [email protected] • Twitter: @telles • Telegram: @fabio_telles
  2. top -ci top - 05:55:43 up 16 days, 1:05, 1

    user, load average: 4,15, 4,91, 5,10 Tasks: 268 total, 5 running, 263 sleeping, 0 stopped, 0 zombie %Cpu(s): 29,4 us, 2,2 sy, 0,0 ni, 60,9 id, 7,0 wa, 0,0 hi, 0,2 si, 0,3 st KiB Mem : 49458404 total, 283300 free, 731524 used, 48443580 buff/cache KiB Swap: 2097148 total, 1933544 free, 163604 used. 41707168 avail Mem PID USER PR NI VIRT RES SHR S %CPU %MEM TIME+ COMMAND 28020 postgres 20 0 6685304 6,156g 6,150g R 99,7 13,1 7:37.10 postgres: user_zzz db_zzz 192.168.193.49(41822) SELECT 29777 postgres 20 0 6686492 5,927g 5,920g R 99,7 12,6 1:39.24 postgres: postgres db_zzz [local] DELETE 29804 postgres 20 0 6702516 5,622g 5,605g R 95,7 11,9 0:41.25 postgres: postgres db_zzz [local] CREATE TABLE AS 25214 postgres 20 0 6696060 6,171g 6,160g R 24,6 13,1 104:59.68 postgres: user_zzz db_zzz 192.168.163.81(58832) SELECT 28205 postgres 20 0 6685260 6,137g 6,131g S 23,6 13,0 6:10.22 postgres: user_zzz db_zzz 192.168.193.49(41828) idle 28268 postgres 20 0 6685308 6,149g 6,143g S 13,6 13,0 7:11.18 postgres: user_zzz db_zzz 192.168.193.49(41830) idle 13819 postgres 20 0 6697552 6,165g 6,147g S 12,0 13,1 36:54.04 postgres: user_zzz db_zzz 192.168.149.241(37806) idle 27643 postgres 20 0 7729100 6,167g 6,144g S 6,3 13,1 5:02.79 postgres: autovacuum worker process db_zzz 23484 postgres 20 0 6680064 8348 7888 S 1,3 0,0 109:13.33 postgres: wal sender process postgres 192.168.185.210(57958) streaming 4C24/9B795B90 6149 postgres 20 0 6679408 6,119g 6,119g S 1,0 13,0 151:08.36 postgres: writer process 22375 postgres 20 0 6687356 6,167g 6,160g S 1,0 13,1 39:53.23 postgres: user_zzz db_zzz 192.168.163.81(59232) idle 8398 postgres 20 0 6696236 6,172g 6,160g S 0,7 13,1 55:45.06 postgres: user_zzz db_zzz 192.168.163.81(59194) idle
  3. iotop Total DISK READ : 16.97 M/s | Total DISK

    WRITE : 12.51 M/s Actual DISK READ: 16.92 M/s | Actual DISK WRITE: 8.57 M/s TID PRIO USER DISK READ DISK WRITE SWAPIN IO> COMMAND 28205 be/4 postgres 4.39 M/s 0.00 B/s 0.00 % 17.95 % postgres: user_zzz db_zzz 192.168.193.49(41828) idle 17811 be/4 postgres 3.22 M/s 54.53 K/s 0.00 % 10.81 % postgres: user_zzz db_zzz 192.168.149.241(38098) idle 9896 be/4 postgres 0.00 B/s 1744.80 K/s 0.00 % 6.78 % postgres: user_zzz db_zzz 192.168.163.81(59200) idle 27643 be/4 postgres 9.36 M/s 4.17 M/s 0.00 % 3.33 % postgres: autovacuum worker process db_zzz 25214 be/4 postgres 0.00 B/s 2.89 M/s 0.00 % 1.44 % postgres: user_zzz db_zzz 192.168.163.81(58832) idle 6150 be/4 postgres 0.00 B/s 1028.19 K/s 0.00 % 0.79 % postgres: wal writer process 3455 be/3 root 0.00 B/s 101.26 K/s 0.00 % 0.53 % [jbd2/sdc-8] 22375 be/4 postgres 0.00 B/s 179.15 K/s 0.00 % 0.24 % postgres: user_zzz db_zzz 192.168.163.81(59232) idle 30021 be/4 postgres 0.00 B/s 327.15 K/s 0.00 % 0.00 % postgres: postgres db_zzz [local] CREATE TABLE AS 6149 be/4 postgres 0.00 B/s 2.08 M/s 0.00 % 0.00 % postgres: writer process 27115 be/4 postgres 0.00 B/s 15.58 K/s 0.00 % 0.00 % postgres: user_zzz db_zzz 192.168.193.49(41806) SELECT
  4. pg_stat_activity SELECT pid, usename, client_addr, state, application_name, query_start, xact_start, wait_event_type,

    query FROM pg_stat_activity WHERE state NOT LIKE 'idle%' AND pid != pg_backend_pid() ORDER BY usename, client_addr desc, xact_start desc, backend_start desc; pid | usename | client_addr | state | application_name | query_start | xact_start | query -------+----------+----------------+--------+--------------------+------------------------------+--------------------------------+--------------- ----------- 30339 | postgres | | active | psql | 2017-12-08 06:11:06.853674+00 | 2017-12-08 06:10:02.040758+00 | DELETE FROM 27643 | postgres | | active | | 2017-12-08 04:41:32.867775+00 | 2017-12-08 04:41:32.867775+00 | autovacuum: 28473 | user_zzz | 192.168.193.49 | active | ManagerAlertSearch | 2017-12-08 06:11:44.371805+00 | 2017-12-08 06:11:43.846183+00 | SELECT id FROM (3 registros)
  5. pg_stat_statements \x Expanded display is on. SELECT * FROM pg_stat_statements

    ORDER BY total_time DESC LIMIT 5; -[ RECORD 1 ]-------+---------------------------------------------------- userid | 10 dbid | 16402 query | WITH totalgeral AS ( SELECT COALESCE(SUM(item.valortotal + item.valoracrescimo + ... calls | 9874 total_time | 1418685132 rows | 186052 shared_blks_hit | 1655871472824 shared_blks_read | 125879385 shared_blks_dirtied | 2938970 shared_blks_written | 189530 local_blks_hit | 0 local_blks_read | 0 local_blks_dirtied | 0 local_blks_written | 0 temp_blks_read | 602311 temp_blks_written | 602311 blk_read_time | 1231114.525 blk_write_time | 71331.473 -[ RECORD 2 ]----- ...
  6. EXPLAIN EXPLAIN [ ( option [, ...] ) ] statement

    EXPLAIN [ ANALYZE ] [ VERBOSE ] statement where option can be one of: ANALYZE [ boolean ] VERBOSE [ boolean ] COSTS [ boolean ] BUFFERS [ boolean ] TIMING [ boolean ] SUMMARY [ boolean ] FORMAT { TEXT | XML | JSON | YAML }
  7. EXPLAIN postgres=# EXPLAIN SELECT 1; QUERY PLAN ------------------------------------------ Result (cost=0.00..0.01

    rows=1 width=0) (1 row) postgres=# EXPLAIN SELECT 1 + 1; QUERY PLAN ------------------------------------------ Result (cost=0.00..0.01 rows=1 width=0) (1 row)
  8. EXPLAIN postgres=# CREATE TABLE t (id SERIAL, texto TEXT); CREATE

    TABLE postgres=# INSERT INTO t (texto) SELECT 'PGConf Brasil 2019' FROM generate_series(1,1000); INSERT 0 1000 postgres=# EXPLAIN SELECT * FROM t; QUERY PLAN ------------------------------------------------------ Seq Scan on t (cost=0.00.. 22.70 rows=1270 width=36) (1 row)
  9. EXPLAIN ANALYZE postgres=# EXPLAIN ANALYZE SELECT * FROM t; QUERY

    PLAN ----------------------------------------------------------------------------------------- Seq Scan on t (cost=0.00..22.70 rows=1270 width=36) (actual time=0.010..0.080 rows=1000 loops=1) Planning time: 0.040 ms Execution time: 0.127 ms (3 rows)
  10. ANALYZE postgres=# ANALYZE t; ANALYZE postgres=# EXPLAIN ANALYZE SELECT *

    FROM t; ----------------------------------------------------------------------------------------- Seq Scan on t (cost=0.00..17.00 rows=1000 width=23) (actual time=0.007..0.078 rows=1000 loops=1) Planning time: 0.050 ms Execution time: 0.114 ms
  11. pg_stats postgres=# SELECT * FROM pg_stats WHERE tablename = 't';

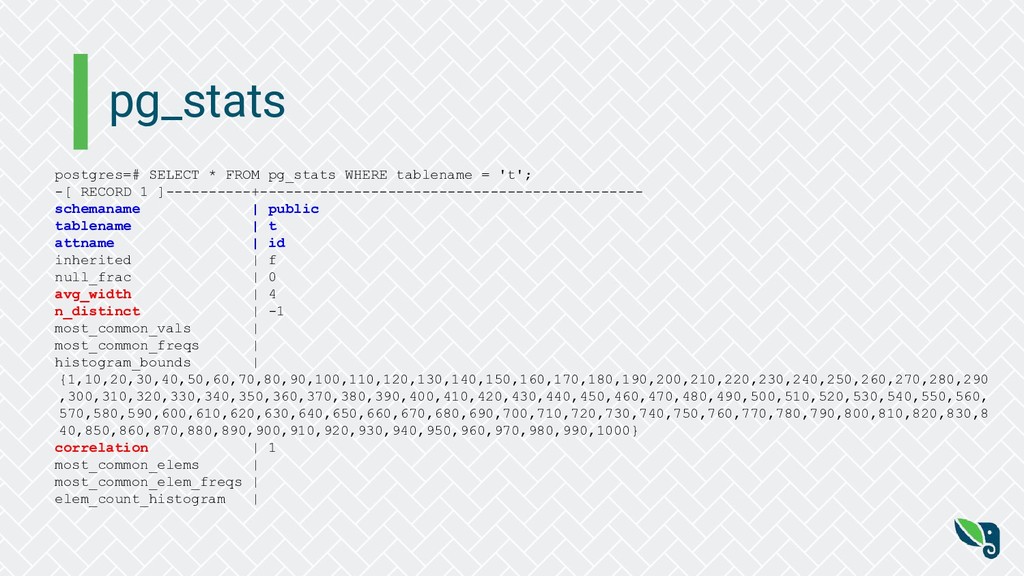
    -[ RECORD 1 ]----------+--------------------------------------------- schemaname | public tablename | t attname | id inherited | f null_frac | 0 avg_width | 4 n_distinct | -1 most_common_vals | most_common_freqs | histogram_bounds | {1,10,20,30,40,50,60,70,80,90,100,110,120,130,140,150,160,170,180,190,200,210,220,230,240,250,260,270,280,290 ,300,310,320,330,340,350,360,370,380,390,400,410,420,430,440,450,460,470,480,490,500,510,520,530,540,550,560, 570,580,590,600,610,620,630,640,650,660,670,680,690,700,710,720,730,740,750,760,770,780,790,800,810,820,830,8 40,850,860,870,880,890,900,910,920,930,940,950,960,970,980,990,1000} correlation | 1 most_common_elems | most_common_elem_freqs | elem_count_histogram |
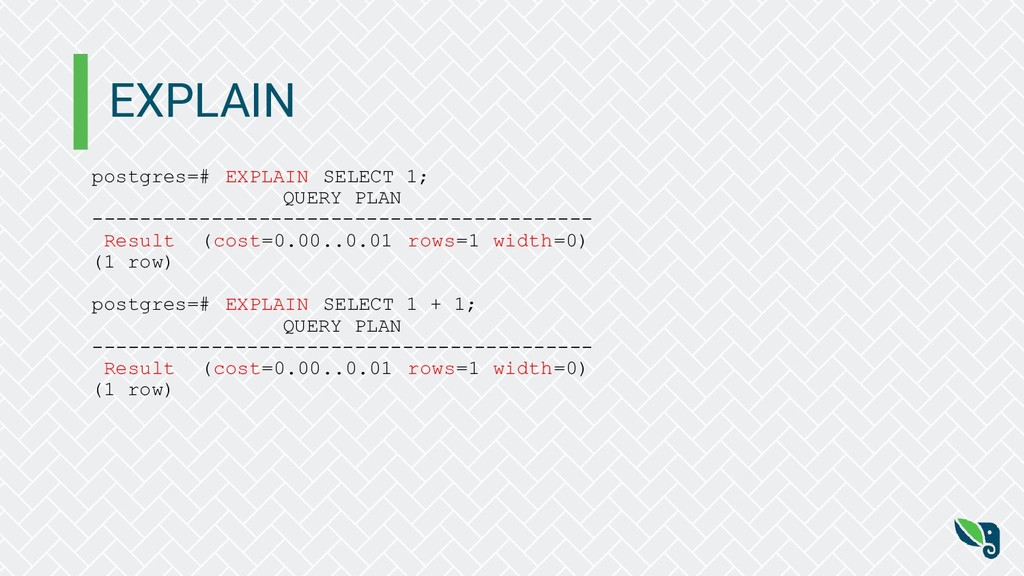
  12. pg_stats -[ RECORD]----------+-------------------------------- schemaname | public tablename | t attname

    | texto inherited | f null_frac | 0 avg_width | 19 n_distinct | 1 most_common_vals | {"PGConf Brasil 2018"} most_common_freqs | {1} histogram_bounds | correlation | 1 most_common_elems | most_common_elem_freqs | elem_count_histogram | https://www.postgresql.org/docs/current/static/view-pg-stats.html
  13. Tarefas do otimizador • Tipo de acesso • Sequencial •

    Bitmap • Index • Tipo de junção • Nested loop • Hash join • Merge join • Ordem das junções
  14. index scan postgres=# CREATE UNIQUE INDEX ON t (id); LOG:

    statement: CREATE UNIQUE INDEX ON t (id); CREATE INDEX postgres=# EXPLAIN SELECT * FROM t WHERE id = 42; ------------------------------------------------------------------- Index Scan using t_id_idx on t (cost=0.28..2.49 rows=1 width=23) Index Cond: (id = 42)
  15. seq scan postgres=# CREATE UNIQUE INDEX ON t (id); LOG:

    statement: CREATE UNIQUE INDEX ON t (id); CREATE INDEX postgres=# EXPLAIN SELECT * FROM t WHERE id = 42; ------------------------------------------------------------------- Index Scan using t_id_idx on t (cost=0.28..2.49 rows=1 width=23) Index Cond: (id = 42) postgres=# EXPLAIN SELECT * FROM t WHERE id > 42; ----------------------------------------------------- Seq Scan on t (cost=0.00..19.50 rows= 958 width=23) Filter: (id > 42)
  16. Outros métodos de acesso postgres=# CREATE TABLE ttt (id serial

    PRIMARY KEY, i integer); LOG: statement: CREATE TABLE ttt (id serial PRIMARY KEY, i integer); CREATE TABLE postgres=# INSERT INTO ttt (i) SELECT random() * 1000000000 AS i FROM generate_series(1,100000); LOG: duration: 227.970 ms statement: INSERT INTO ttt (i) SELECT random() * 1000000000 AS i FROM generate_series(1,100000); INSERT 0 100000 postgres=# CREATE INDEX ON ttt (i); LOG: statement: CREATE INDEX ON ttt (i); CREATE INDEX
  17. Outros métodos de acesso postgres=# SELECT attname, n_distinct, correlation FROM

    pg_stats WHERE tablename = 'ttt'; -[ RECORD 1 ]----------+----------------------------------------------------------------- attname | id avg_width | 4 n_distinct | -1 correlation | 1 -[ RECORD 2 ]----------+----------------------------------------------------------------- attname | i avg_width | 4 n_distinct | -1 correlation | 0.00427951
  18. Outros métodos de acesso postgres=# EXPLAIN SELECT * FROM ttt

    WHERE i < 5000000 OR i > 950000000; QUERY PLAN ---------------------------------------------------------------------------------- Bitmap Heap Scan on ttt (cost=62.36..588.20 rows=5500 width=8) Recheck Cond: ((i < 5000000) OR (i > 950000000)) -> BitmapOr (cost=62.36..62.36 rows=5523 width=0) -> Bitmap Index Scan on ttt_i_idx (cost=0.00..5.91 rows=455 width=0) Index Cond: (i < 5000000) -> Bitmap Index Scan on ttt_i_idx (cost=0.00..53.70 rows=5068 width=0) Index Cond: (i > 950000000) postgres=# EXPLAIN SELECT id FROM ttt WHERE id < 10; QUERY PLAN ------------------------------------------------------------------------- Index Only Scan using ttt_pkey on ttt (cost=0.29..2.63 rows=8 width=4) Index Cond: (id < 10)
  19. Outros métodos de acesso postgres=# BEGIN; postgres=# SELECT ctid, id

    FROM ttt WHERE id = 5000 FOR UPDATE; ctid | id ---------+------ (22,28) | 5000 postgres=# EXPLAIN SELECT * FROM ttt WHERE ctid = '(22,28)'::tid; QUERY PLAN --------------------------------------------------- Tid Scan on ttt (cost=0.00..1.11 rows=1 width=8) TID Cond: (ctid = '(22,28)'::tid)
  20. Influenciando no otimizador • enable_seqscan • enable_indexscan • enable_bitmapscan •

    enable_indexonlyscan • enable_tidscan • enable_nestloop • enable_hashjoin • enable_mergejoin • enable_hashagg • enable_material • enable_sort
  21. Influenciando o otimizador postgres=# EXPLAIN SELECT * FROM t WHERE

    id > 42; ----------------------------------------------------- Seq Scan on t (cost=0.00.. 19.50 rows=958 width=23) Filter: (id > 42) postgres=# SET enable_seqscan = FALSE; SET postgres=# EXPLAIN SELECT * FROM t WHERE id > 42; ---------------------------------------------------------------------- Index Scan using t_id_idx on t (cost=0.28.. 29.64 rows=958 width=23) Index Cond: (id > 42)
  22. ORDER BY postgres=# EXPLAIN SELECT * FROM t ORDER BY

    id; ----------------------------------------------------------------------- Index Scan using t_id_idx on t (cost=0.28..27.88 rows=1000 width=23) postgres=# EXPLAIN SELECT * FROM t ORDER BY id DESC; -------------------------------------------------------------------------------- Index Scan Backward using t_id_idx on t (cost=0.28..27.88 rows=1000 width=23) postgres=# EXPLAIN SELECT * FROM t ORDER BY texto; ------------------------------------------------------------ Sort (cost=66.83..69.33 rows=1000 width=23) Sort Key: texto -> Seq Scan on t (cost=0.00..17.00 rows=1000 width=23)
  23. ORDER BY postgres=# EXPLAIN SELECT * FROM t ORDER BY

    texto DESC; ------------------------------------------------------------ Sort (cost=66.83..69.33 rows=1000 width=23) Sort Key: texto DESC -> Seq Scan on t (cost=0.00..17.00 rows=1000 width=23) postgres=# EXPLAIN SELECT * FROM t WHERE id < 42 ORDER BY texto DESC; -------------------------------------------------------------------------- Sort (cost=4.34..4.45 rows=42 width=23) Sort Key: texto DESC -> Index Scan using t_id_idx on t (cost=0.28..3.21 rows=42 width=23) Index Cond: (id < 42)
  24. LIMIT postgres=# EXPLAIN SELECT * FROM t ORDER BY texto

    LIMIT 10; ------------------------------------------------------------------ Limit (cost=38.61..38.63 rows=10 width=23) -> Sort (cost=38.61..41.11 rows=1000 width=23) Sort Key: texto -> Seq Scan on t (cost=0.00..17.00 rows=1000 width=23) postgres=# EXPLAIN SELECT * FROM t WHERE id < 10 ORDER BY texto; -------------------------------------------------------------------------- Sort (cost=2.82..2.84 rows=10 width=23) Sort Key: texto -> Index Scan using t_id_idx on t (cost=0.28..2.65 rows=10 width=23) Index Cond: (id < 10)
  25. LIMIT, OFFSET postgres=# EXPLAIN SELECT * FROM t ORDER BY

    texto LIMIT 10 OFFSET 10; ------------------------------------------------------------------ Limit (cost=43.63..43.66 rows=10 width=23) -> Sort (cost=43.61..46.11 rows=1000 width=23) Sort Key: texto -> Seq Scan on t (cost=0.00..17.00 rows=1000 width=23) postgres=# EXPLAIN SELECT * FROM t ORDER BY texto LIMIT 10 OFFSET 990; ------------------------------------------------------------------ Limit (cost=69.30..69.33 rows=10 width=23) -> Sort (cost=66.83..69.33 rows=1000 width=23) Sort Key: texto -> Seq Scan on t (cost=0.00..17.00 rows=1000 width=23)
  26. CREATE STATISTCS (>= PG10) CREATE STATISTICS [ IF NOT EXISTS

    ] statistics_name [ ( statistics_kind [, ... ] ) ] ON column_name, column_name [, ...] FROM table_name CREATE TABLE t1 ( a int, b int ); INSERT INTO t1 SELECT i/100, i/500 FROM generate_series(1,1000000) s(i); ANALYZE t1;
  27. CREATE STATISTCS (>= PG10) postgres=# EXPLAIN ANALYZE SELECT * FROM

    t1 WHERE (a = 1) AND (b = 0); -------------------------------------------------------------------------------------- Gather (cost=1000.00..11675.10 rows=1 width=8) (actual time=0.637..50.077 rows=100 loops=1) Workers Planned: 2 Workers Launched: 2 -> Parallel Seq Scan on t1 (cost=0.00..10675.00 rows=1 width=8) (actual time=28.731..45.183 rows=33 loops=3) Filter: ((a = 1) AND (b = 0)) Rows Removed by Filter: 333300 Planning time: 0.566 ms Execution time: 53.161 ms
  28. CREATE STATISTCS (>= PG10) CREATE STATISTICS s1 (dependencies) ON a,

    b FROM t1; ANALYZE t1; postgres=# EXPLAIN ANALYZE SELECT * FROM t1 WHERE (a = 1) AND (b = 0); ------------------------------------------------------------------------------------- Gather (cost=1000.00..11684.80 rows=98 width=8) (actual time=0.698..50.546 rows=100 loops=1) Workers Planned: 2 Workers Launched: 2 -> Parallel Seq Scan on t1 (cost=0.00..10675.00 rows=41 width=8) (actual time=29.592..46.179 rows=33 loops=3) Filter: ((a = 1) AND (b = 0)) Rows Removed by Filter: 333300 Planning time: 0.160 ms Execution time: 53.096 ms
  29. function scan postgres=# explain analyze select * from generate_Series(1,100) i

    ; ------------------------------------------------------------------------ Function Scan on generate_series i (cost=0.00..10.00 rows=1000 width=4) (actual time=0.061..0.092 rows=100 loops=1) Planning time: 0.084 ms Execution time: 0.166 ms
  30. nested loop postgres=# EXPLAIN SELECT a.* FROM pg_class c join

    pg_attribute a ON c.oid = a.attrelid WHERE c.relname IN ( 'pg_class', 'pg_namespace' ); --------------------------------------------------------------------------- --- Nested Loop (cost=8.84..54.73 rows=15 width=205) -> Bitmap Heap Scan on pg_class c (cost=8.56..14.03 rows=2 width=4) Recheck Cond: (relname = ANY ('{pg_class,pg_namespace}'::name[])) -> Bitmap Index Scan on pg_class_relname_nsp_index (cost=0.00..8.56 rows=2 width=0) Index Cond: (relname = ANY ('{pg_class,pg_namespace}'::name[])) -> Index Scan using pg_attribute_relid_attnum_index on pg_attribute a (cost=0.28..20.27 rows=8 width=205) Index Cond: (attrelid = c.oid)
  31. nested loop postgres=# EXPLAIN ANALYZE SELECT a.* FROM pg_class c

    join pg_attribute a ON c.oid = a.attrelid WHERE c.relname IN ( 'pg_class', 'pg_namespace' ); --------------------------------------------------------------------------- Nested Loop (cost=8.84..54.73 rows=15 width=205) (actual time=0.152..0.318 rows=50 loops=1) -> Bitmap Heap Scan on pg_class c (cost=8.56..14.03 rows=2 width=4) (actual time=0.126..0.141 rows=2 loops=1) Recheck Cond: (relname = ANY ('{pg_class,pg_namespace}'::name[])) Heap Blocks: exact=2 -> Bitmap Index Scan on pg_class_relname_nsp_index (cost=0.00..8.56 rows=2 width=0) (actual time=0.113..0.113 rows=2 loops=1) Index Cond: (relname = ANY ('{pg_class,pg_namespace}'::name[])) -> Index Scan using pg_attribute_relid_attnum_index on pg_attribute a (cost=0.28..20.27 rows=8 width=205) (actual time=0.014..0.049 rows=25 loops =2) Index Cond: (attrelid = c.oid) Planning time: 0.562 ms Execution time: 0.486 ms
  32. hash join postgres=# EXPLAIN ANALYZE SELECT * FROM pg_class c

    JOIN pg_namespace n ON c.relnamespace = n.oid; ----------------------------------------------------------------------------------------------------- Hash Join (cost=1.14..19.34 rows=341 width=372) (actual time=0.062..0.844 rows=342 loops=1) Hash Cond: (c.relnamespace = n.oid) -> Seq Scan on pg_class c (cost=0.00..14.41 rows=341 width=259) (actual time=0.017..0.140 rows=342 loops=1) -> Hash (cost=1.06..1.06 rows=6 width=117) (actual time=0.026..0.026 rows=6 loops=1) Buckets: 1024 Batches: 1 Memory Usage: 9kB -> Seq Scan on pg_namespace n (cost=0.00..1.06 rows=6 width=117) (actual time=0.009..0.015 rows=6 loops=1) Planning time: 0.483 ms Execution time: 0.986 ms
  33. Constantes do otimizador • seq_page_cost • random_page_cost • cpu_tuple_cost •

    cpu_index_tuple_cost • cpu_operator_cost • parallel_setup_cost • parallel_tuple_cost • min_parallel_table_scan_size • min_parallel_index_scan_size • effective_cache_size
  34. Mais variáveis para o otimizador • default_statistics_target • constraint_exclusion •

    cursor_tuple_fraction • from_collapse_limit • join_collapse_limit • force_parallel_mode
  35. Otimizador genético • geqo • geqo_threshold • geqo_effort • geqo_pool_size

    • geqo_generations • geqo_selection_bias • geqo_seed