and orchestrators • Container placement is important for achieving great performance • Inter-application traffic is a key issue for determining performance Introduction 2
in an application-independent way • Existing tracing tools that provide detailed information about data flow within an cloud application require instrumentation • Capturing network traffic is possible but incurs large overhead and demands high computational resources during peaks Problem 3
virtualized environments • Observing system calls provide useful insights on which and how software components interact • Network communication between processes (even in containers) involves system calls for managing connections, reading and writing messages to network channels Monitoring at Kernel Layer 5
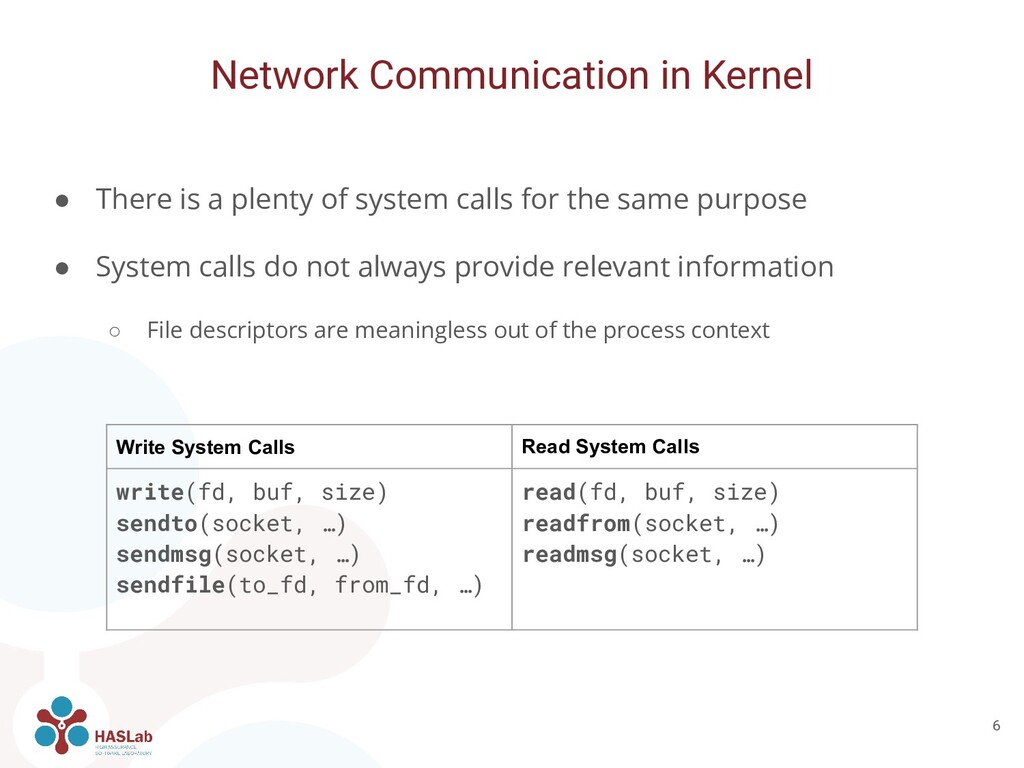
same purpose • System calls do not always provide relevant information ◦ File descriptors are meaningless out of the process context Network Communication in Kernel 6 Write System Calls Read System Calls write(fd, buf, size) sendto(socket, …) sendmsg(socket, …) sendfile(to_fd, from_fd, …) read(fd, buf, size) readfrom(socket, …) readmsg(socket, …)
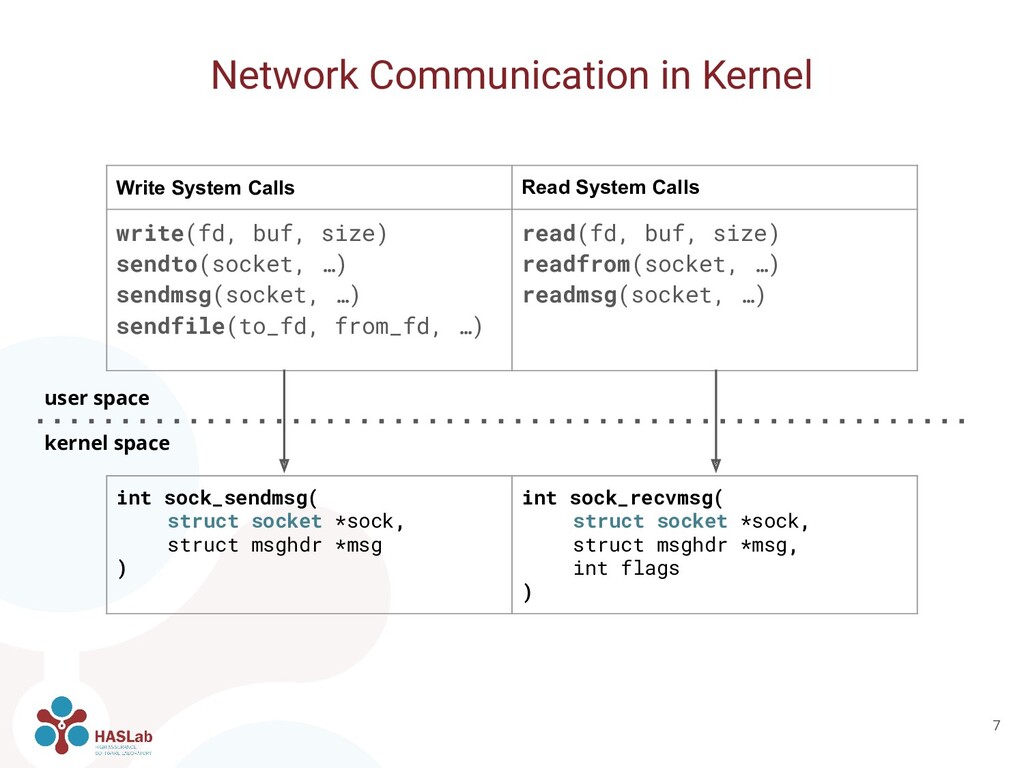
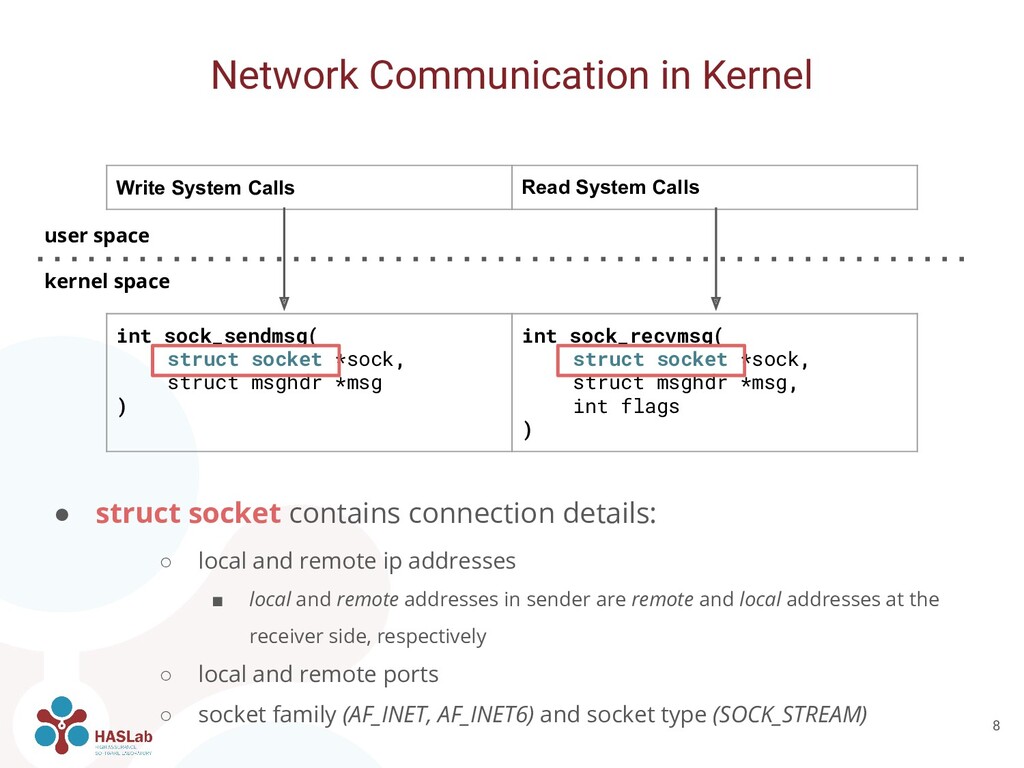
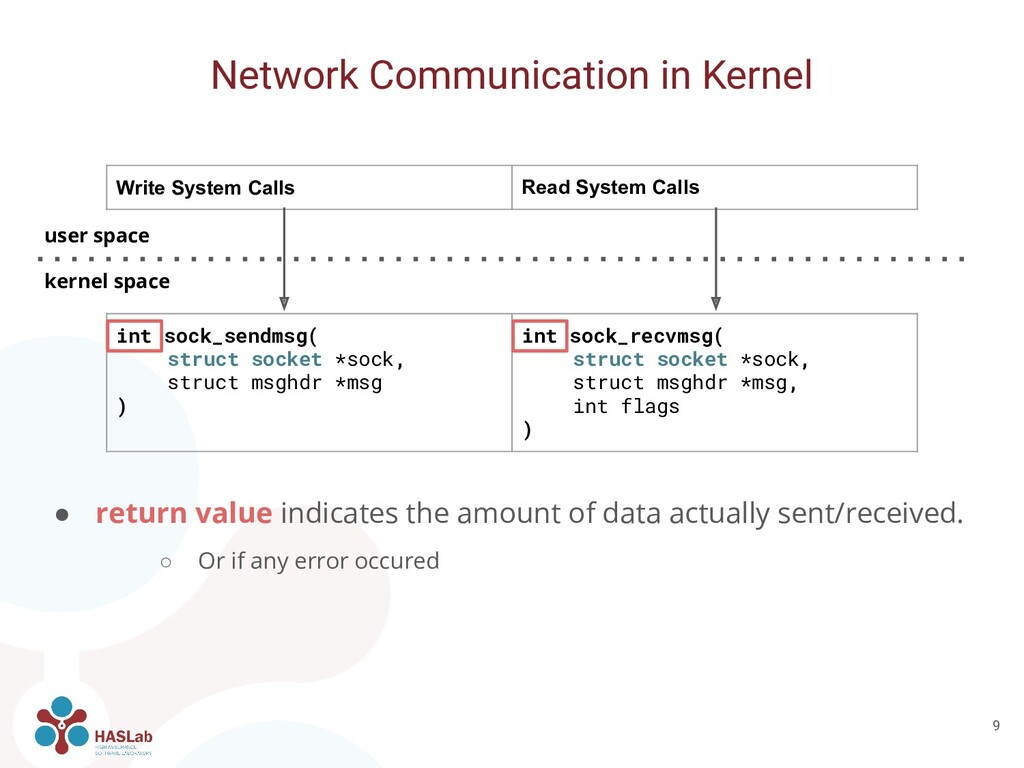
ip addresses ▪ local and remote addresses in sender are remote and local addresses at the receiver side, respectively ◦ local and remote ports ◦ socket family (AF_INET, AF_INET6) and socket type (SOCK_STREAM) Network Communication in Kernel 8 Write System Calls Read System Calls int sock_sendmsg( struct socket *sock, struct msghdr *msg ) int sock_recvmsg( struct socket *sock, struct msghdr *msg, int flags ) user space kernel space
◦ Or if any error occured Network Communication in Kernel 9 Write System Calls Read System Calls int sock_sendmsg( struct socket *sock, struct msghdr *msg ) int sock_recvmsg( struct socket *sock, struct msghdr *msg, int flags ) user space kernel space
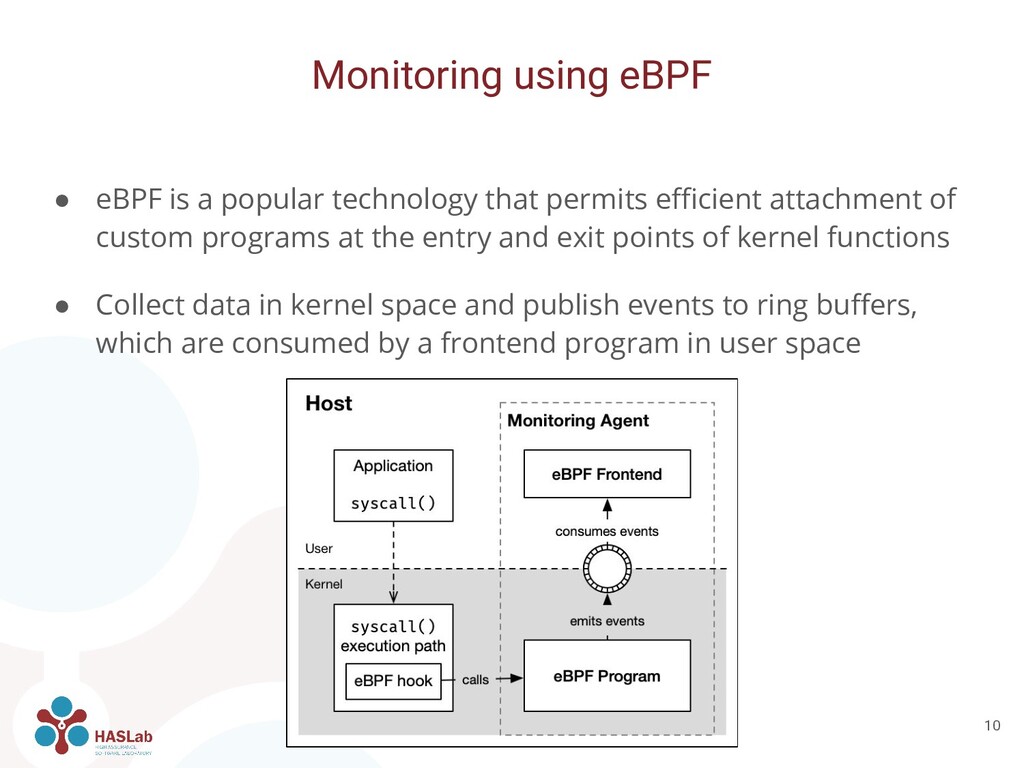
of custom programs at the entry and exit points of kernel functions • Collect data in kernel space and publish events to ring buffers, which are consumed by a frontend program in user space Monitoring using eBPF 10
size of each probe is limited to 512 bytes • Ring buffer size is limited and high event throughput lead new events to overwrite the oldest ones • Processing events in frontend program incurs CPU usage Monitoring using eBPF - Caveats 11
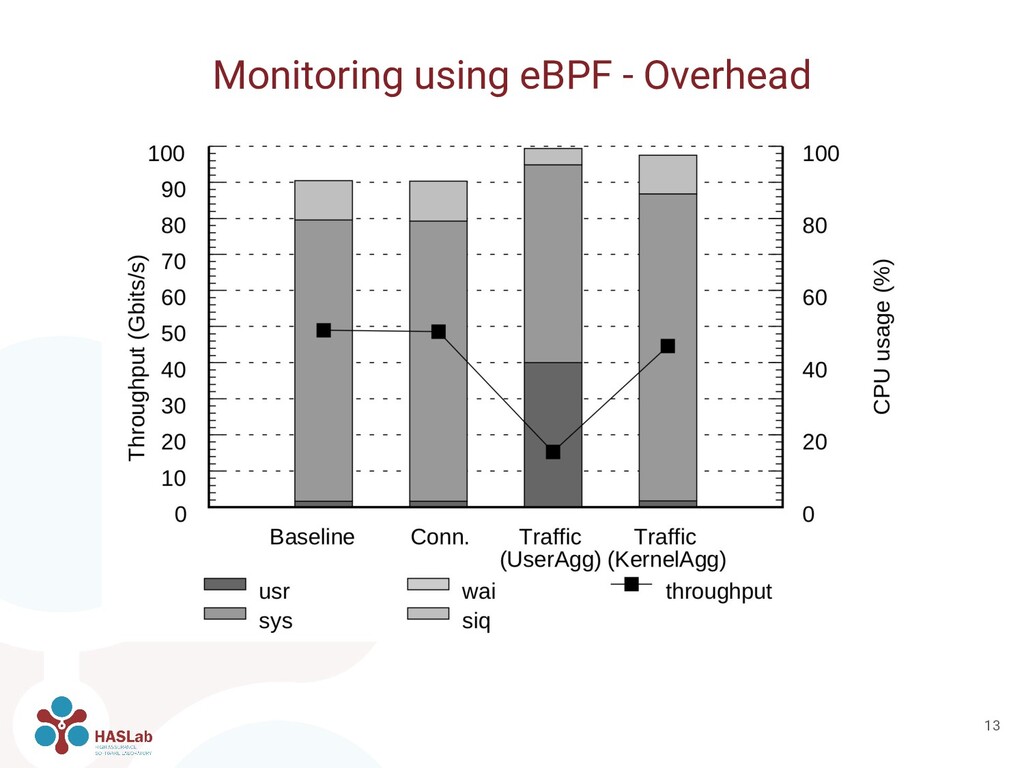
kernel routines sock_sendmsg and sock_recvmsg collect connection details and amount of sent/received bytes • Worst-case stress scenario setup with iperf tool • Two versions implemented: ◦ One event for each read/write, aggregating in userspace (UserAgg) ◦ Send event with already aggregated statistics to user space (KernelAgg) Monitoring using eBPF - Overhead 12
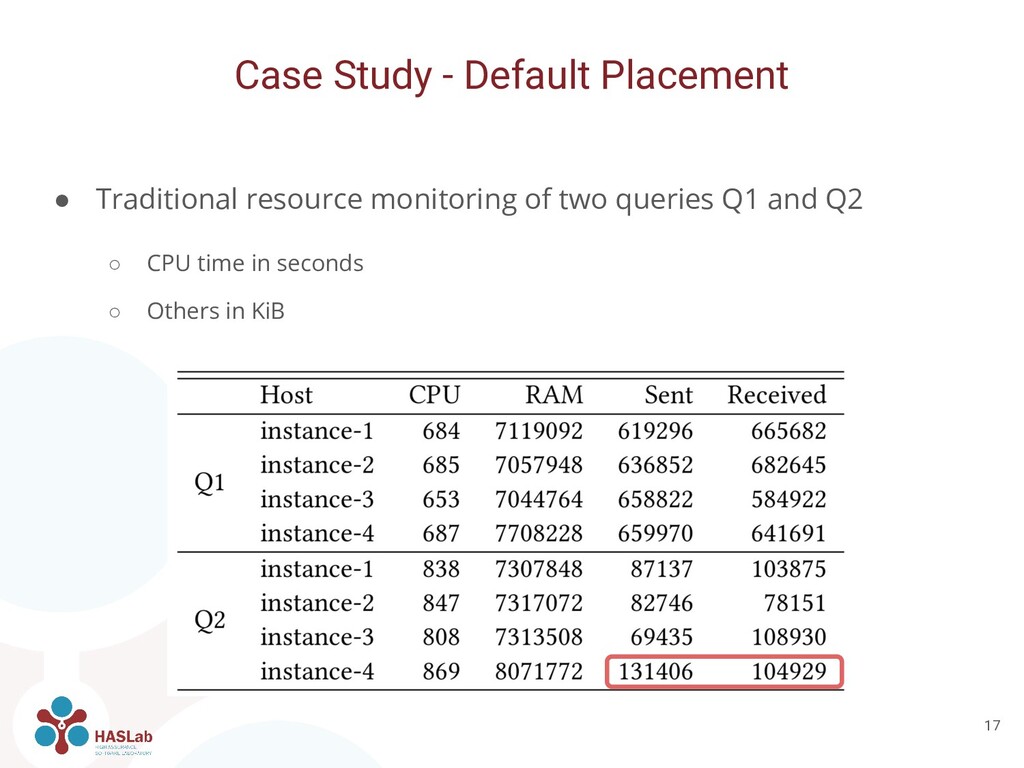
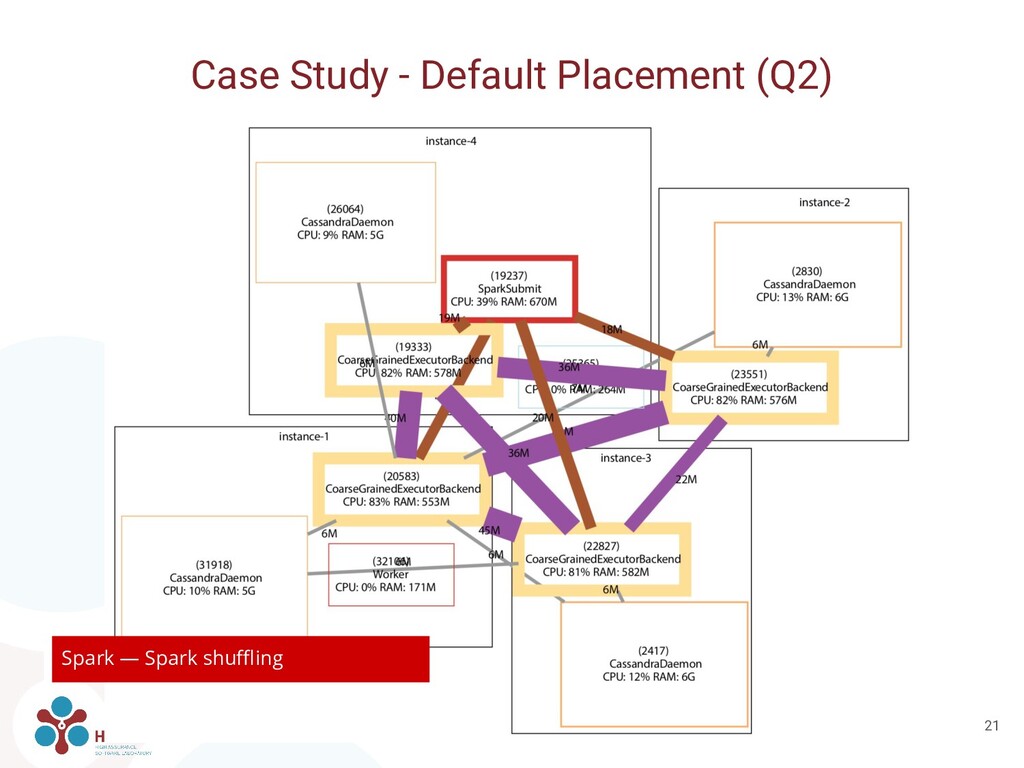
of Apache Cassandra and Apache Spark • Four n1-standard-4 Google Cloud Engine instances • Docker containers orchestrated by Kubernetes. ◦ 4 replicas of Apache Cassandra ◦ 4 replicas of Spark Workers and 1 of Spark Master • Populated with 2 million rows of ~2KiB in size Case Study 14
is compatible with automatic techniques for optimizing containers placement • Pyevolve utility for optimizing placement, giving the initial set of containers and servers, each with corresponding processes • Three optimization factors: ◦ optimal result for each server where CPU cores are expected to be fully used ◦ optimal result for each server where RAM is expected to be fully used ◦ optimal result for no cross-server communication
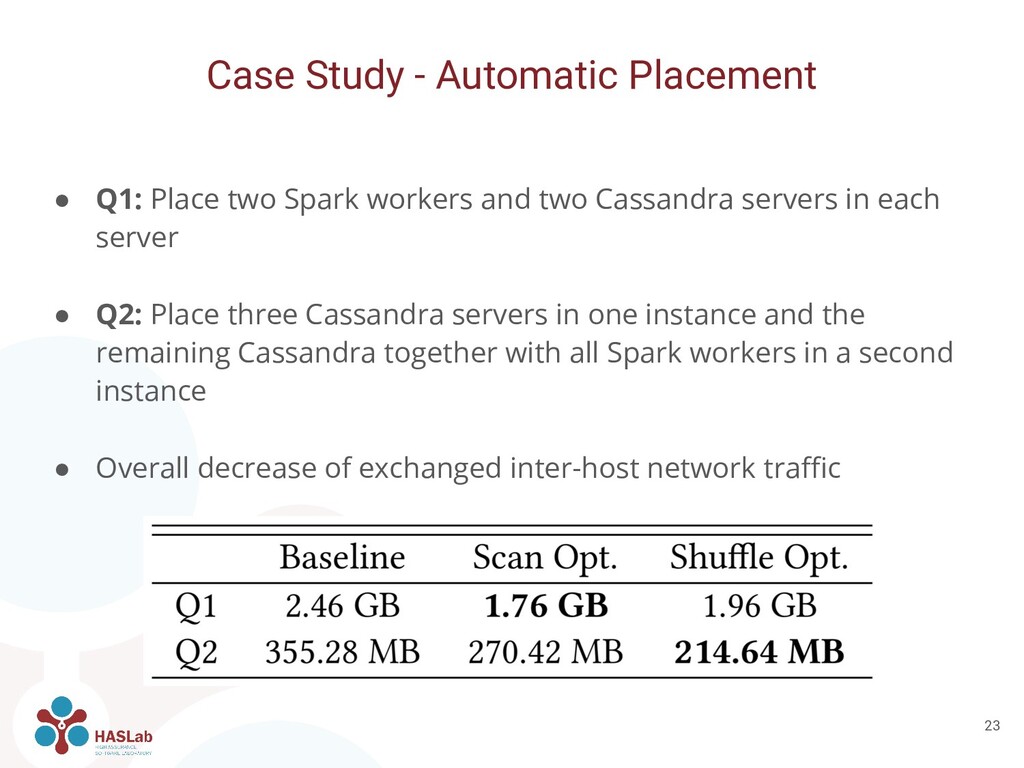
Spark workers and two Cassandra servers in each server • Q2: Place three Cassandra servers in one instance and the remaining Cassandra together with all Spark workers in a second instance • Overall decrease of exchanged inter-host network traffic
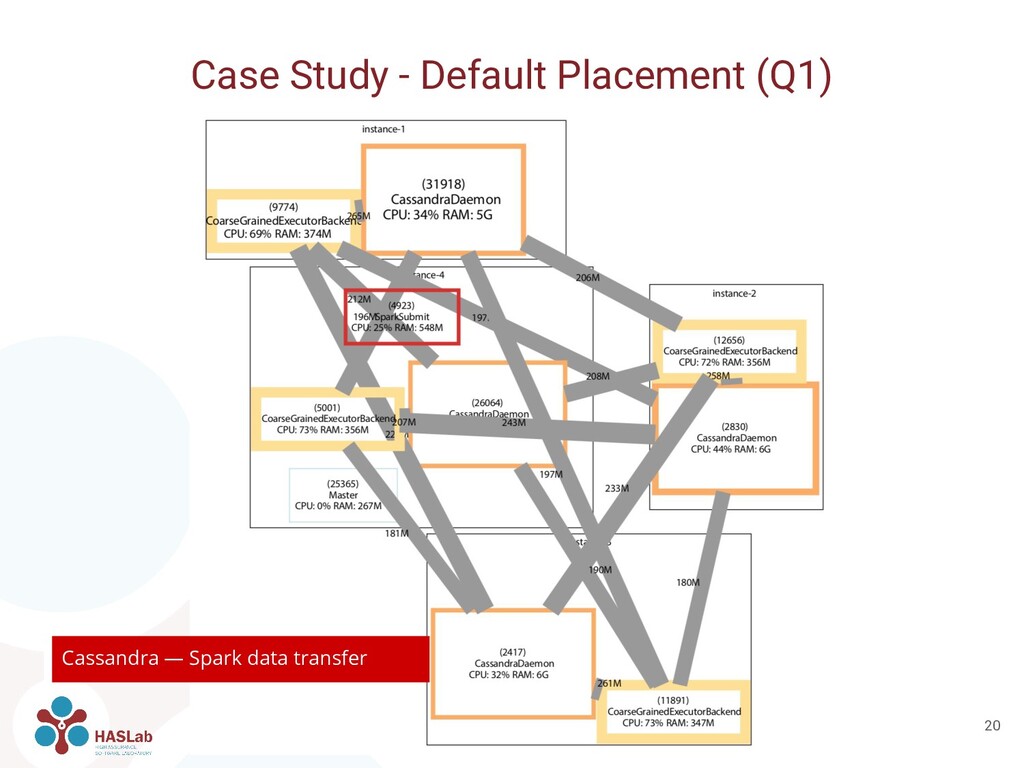
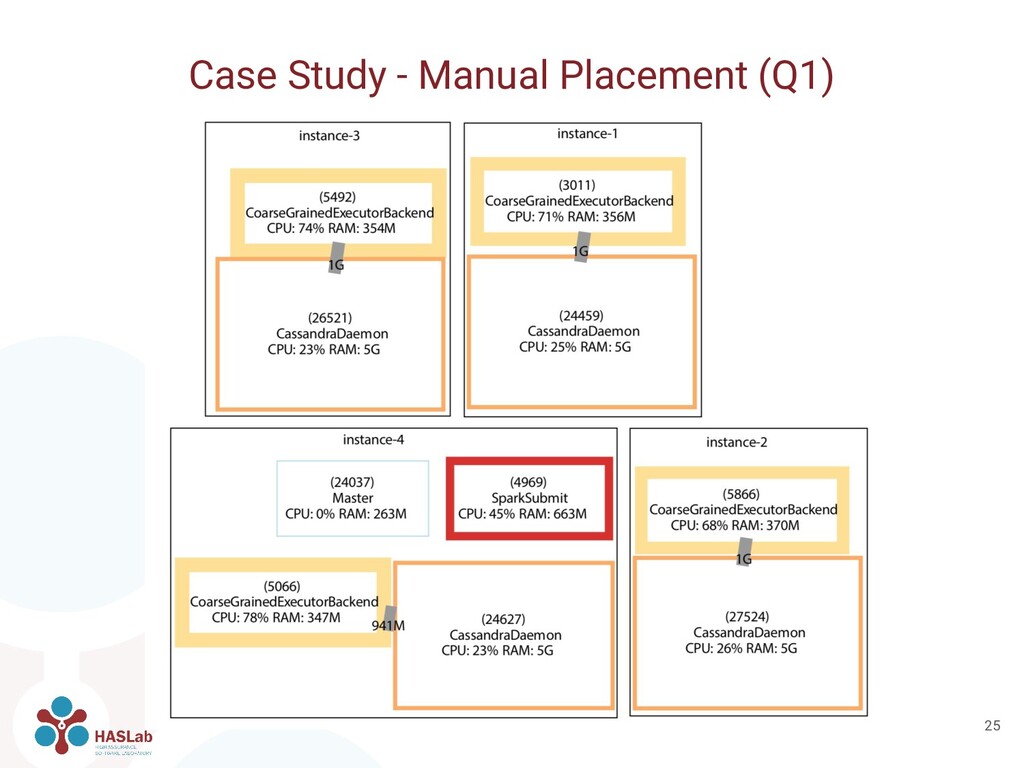
can be used also for manual placement and configuration • We manually placed and configured containers based on network traffic • Q1: Each Spark worker together with a Cassandra server ◦ Improves locality • Q2: Only one Spark worker with 4x as much resources assigned ◦ Avoids shuffling
black-box fashion, on systems performance • Quantifying the amount of data exchanged between software components is key for improving performance • Monitoring network connections is feasible with low overhead and without application knowledge Conclusions 27