Upgrade to Pro — share decks privately, control downloads, hide ads and more …

Machine Learning for Demand Prediction of Seasonal Second-hand Fashion Items Based on Prior and Fine-tuning Prediction Models

FuyuSaito
January 29, 2022

Machine Learning for Demand Prediction of Seasonal Second-hand Fashion Items Based on Prior and Fine-tuning Prediction Models

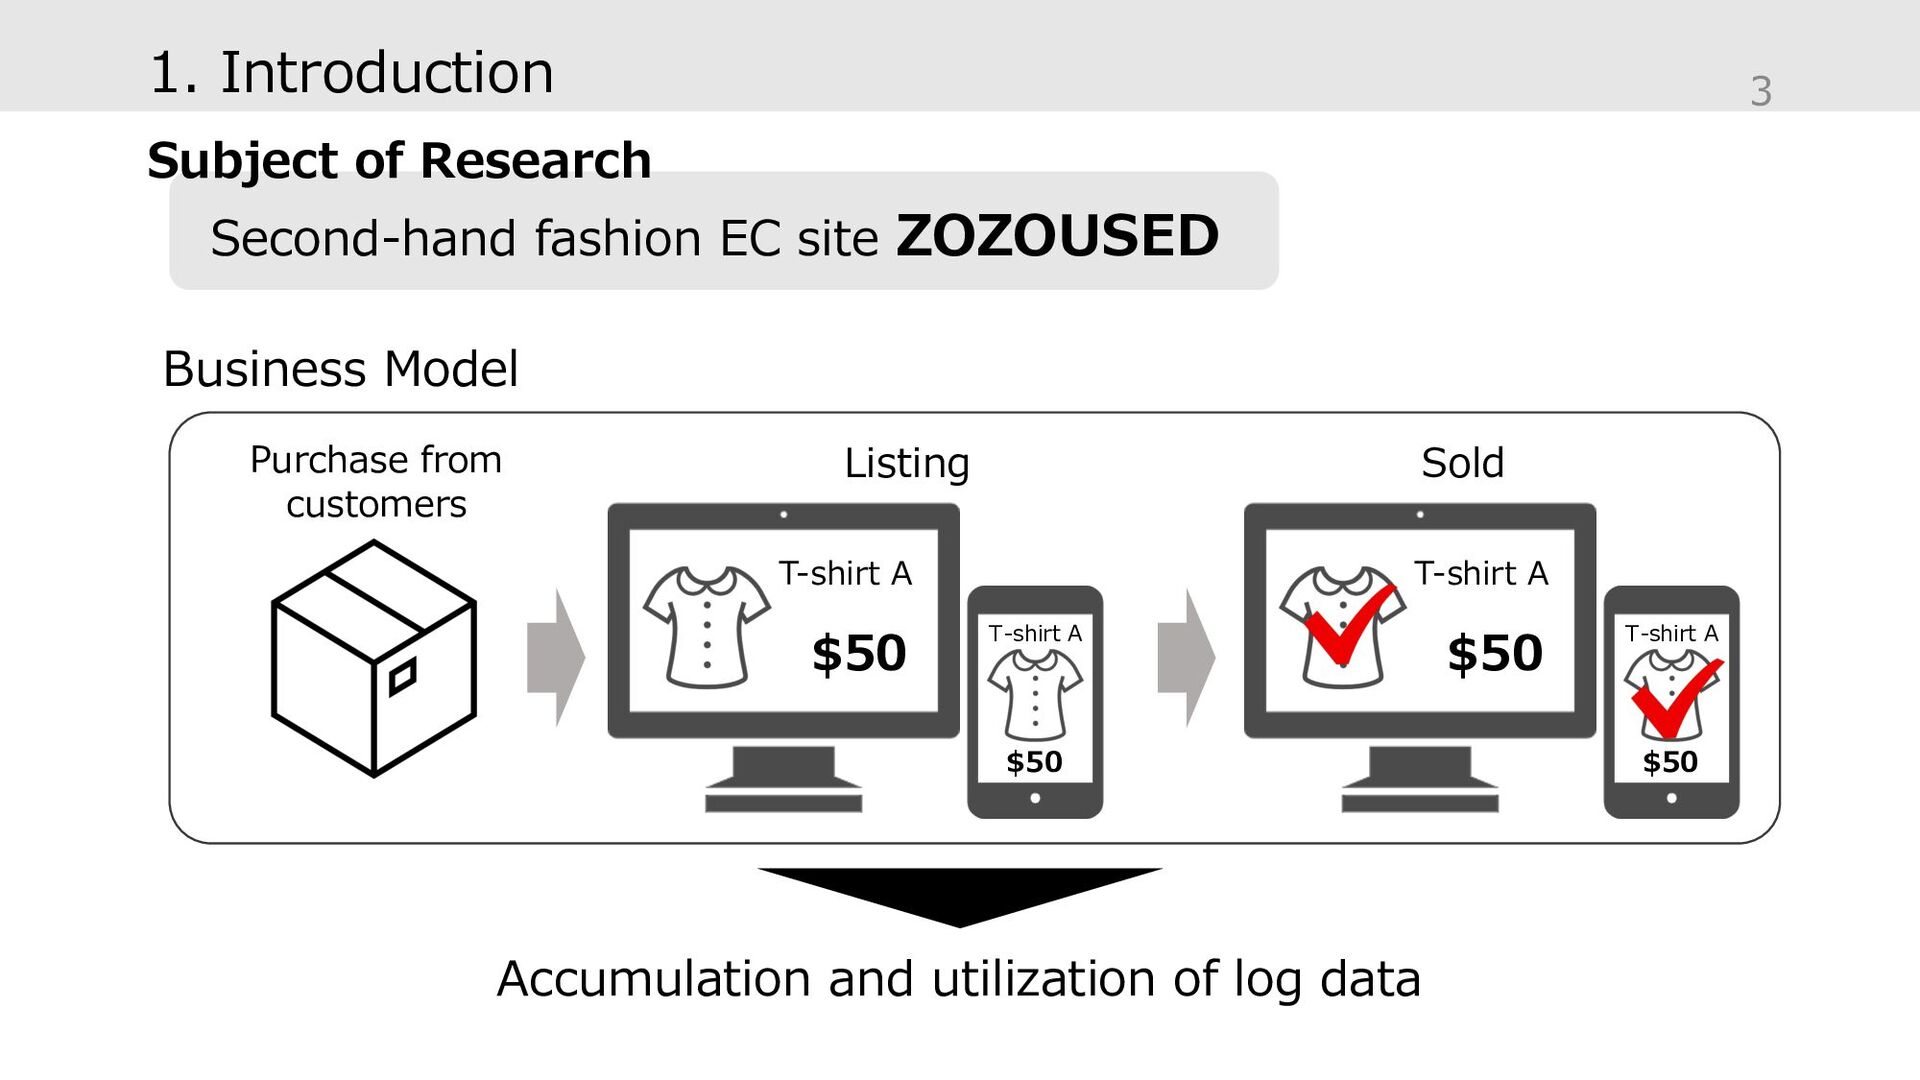
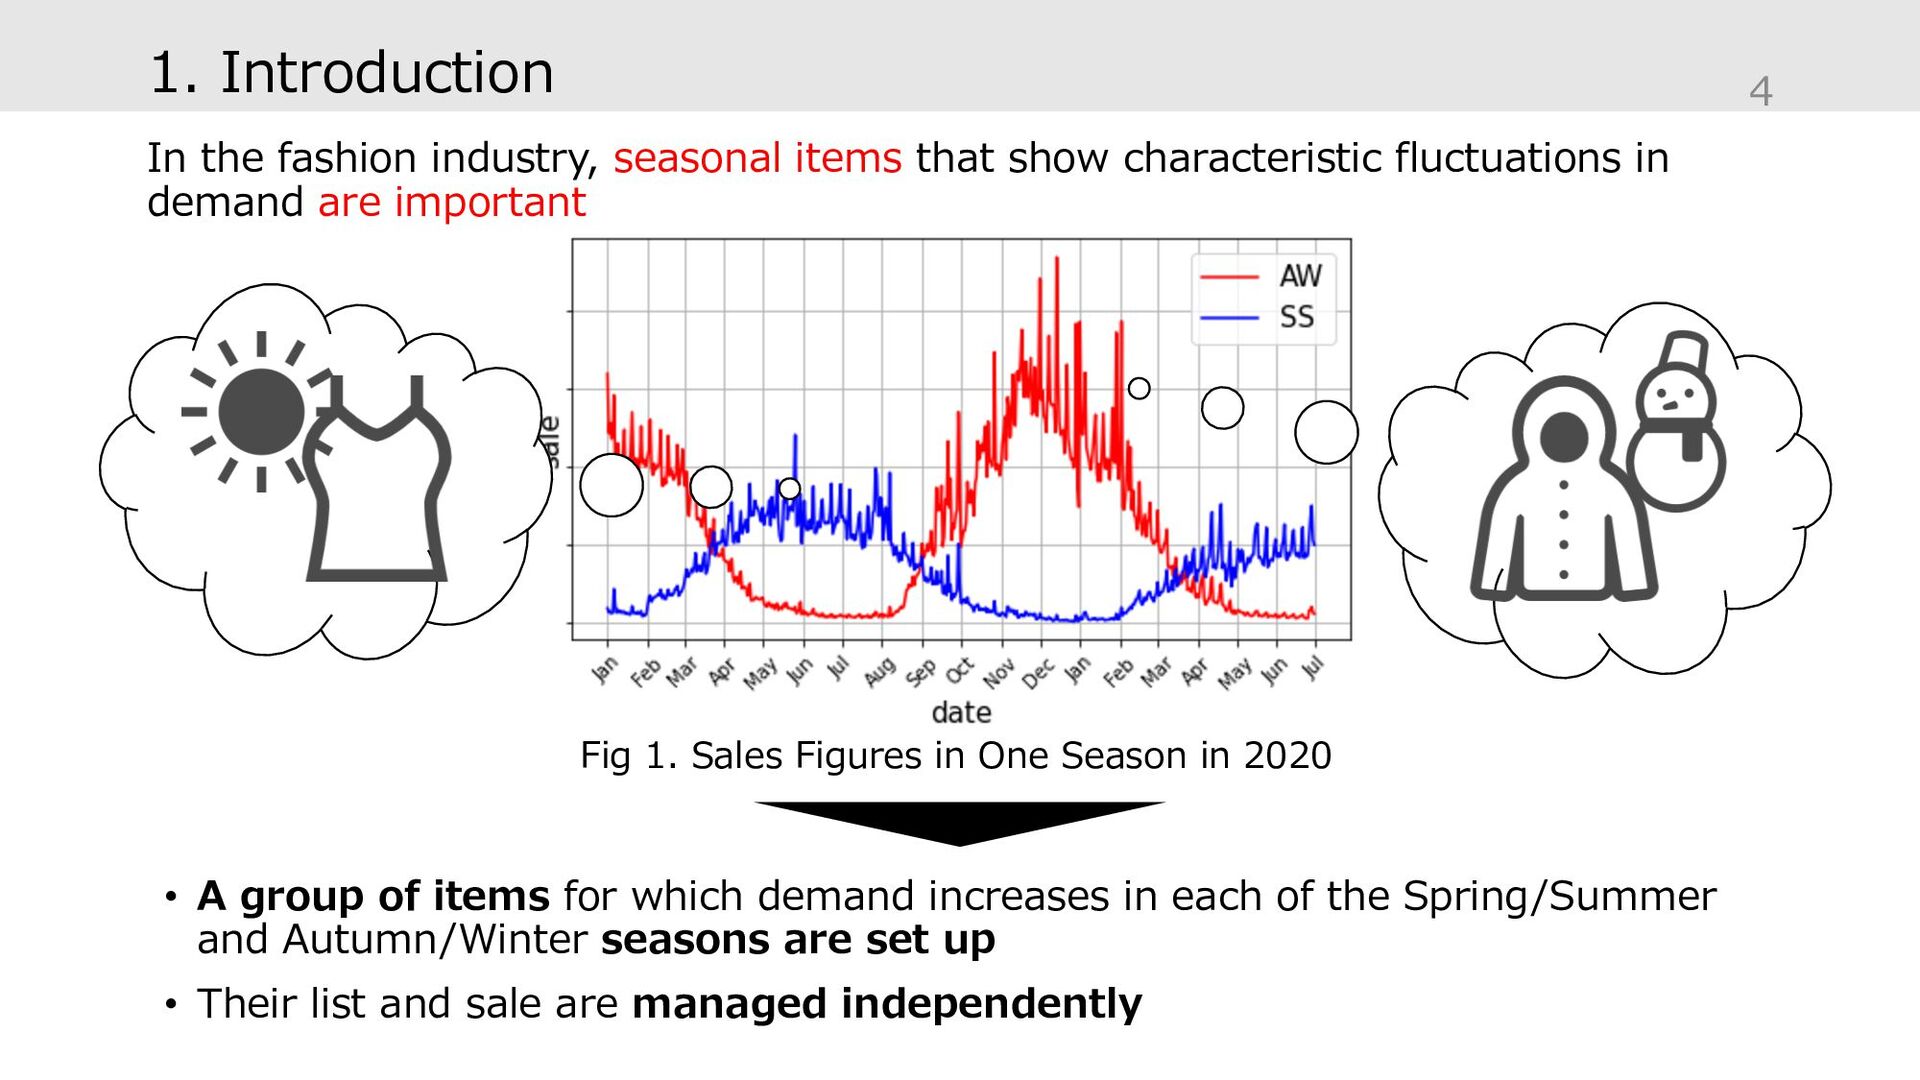
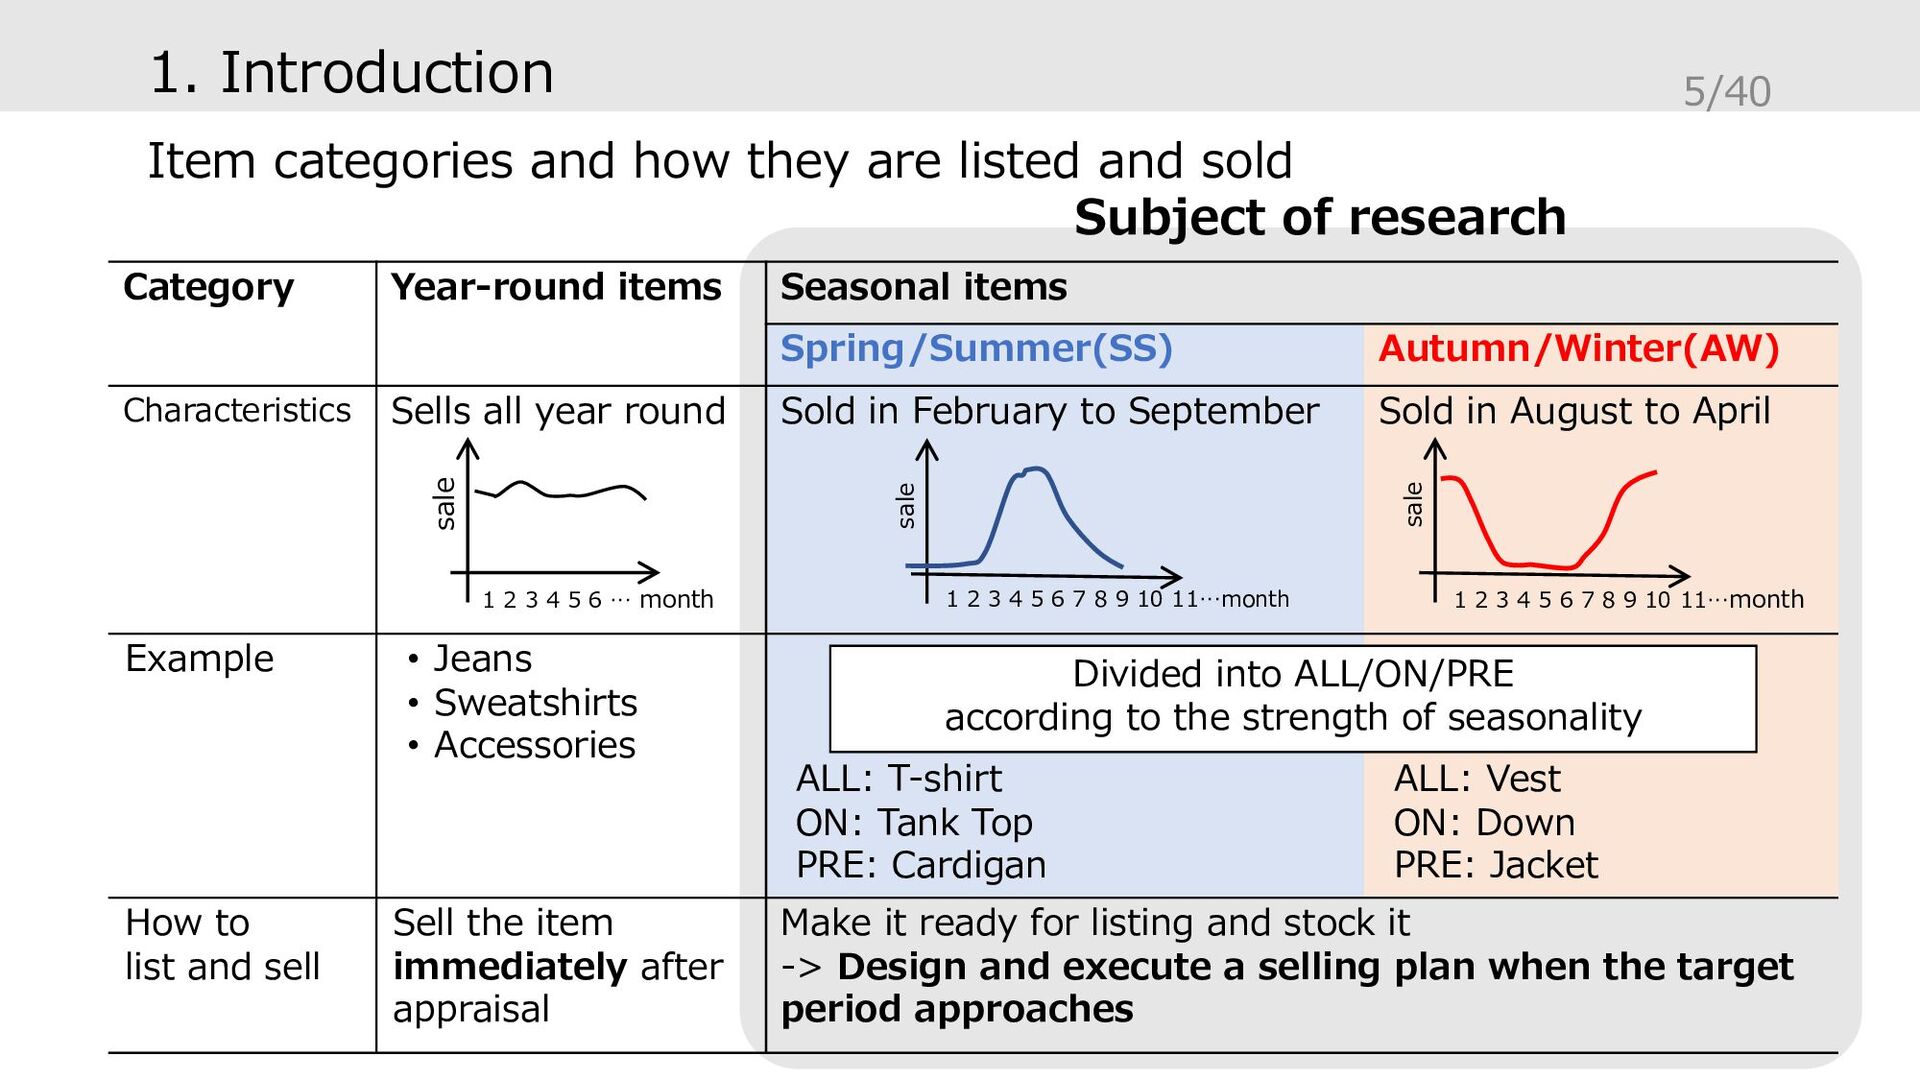
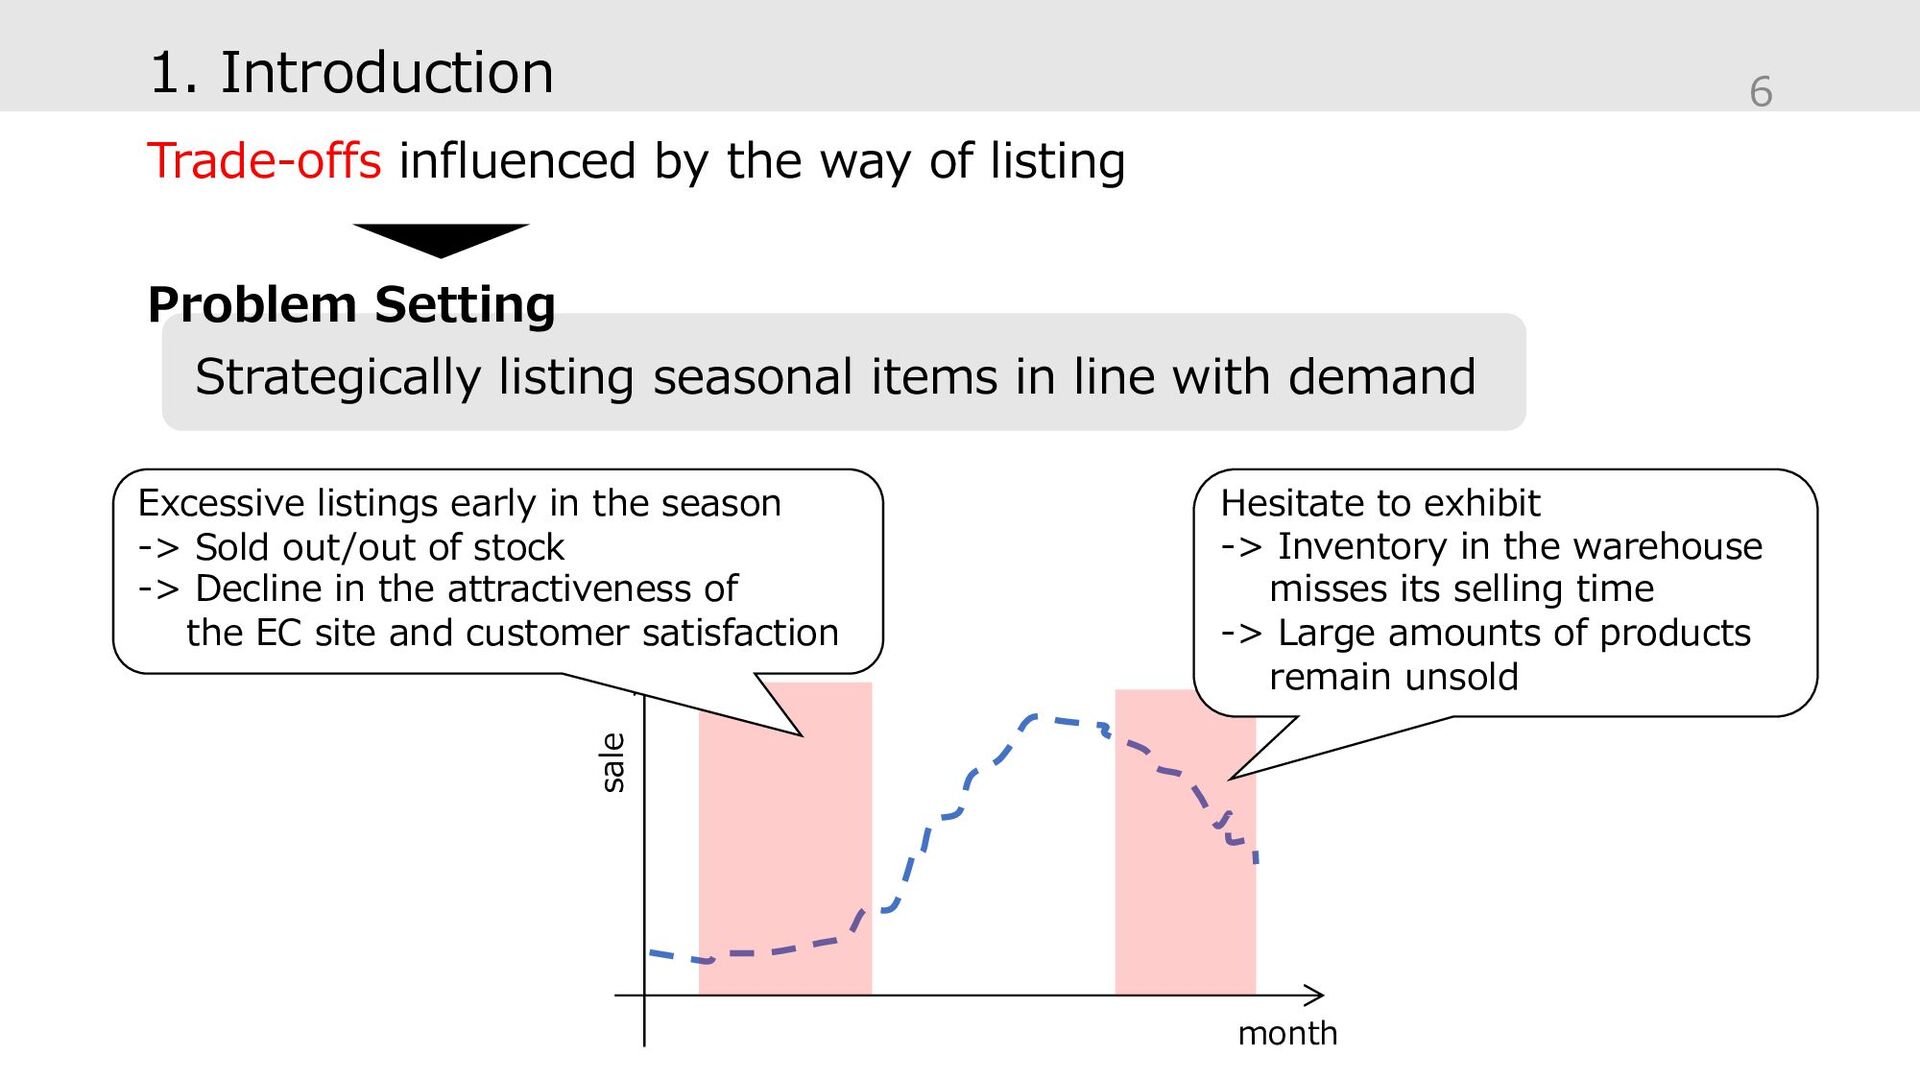
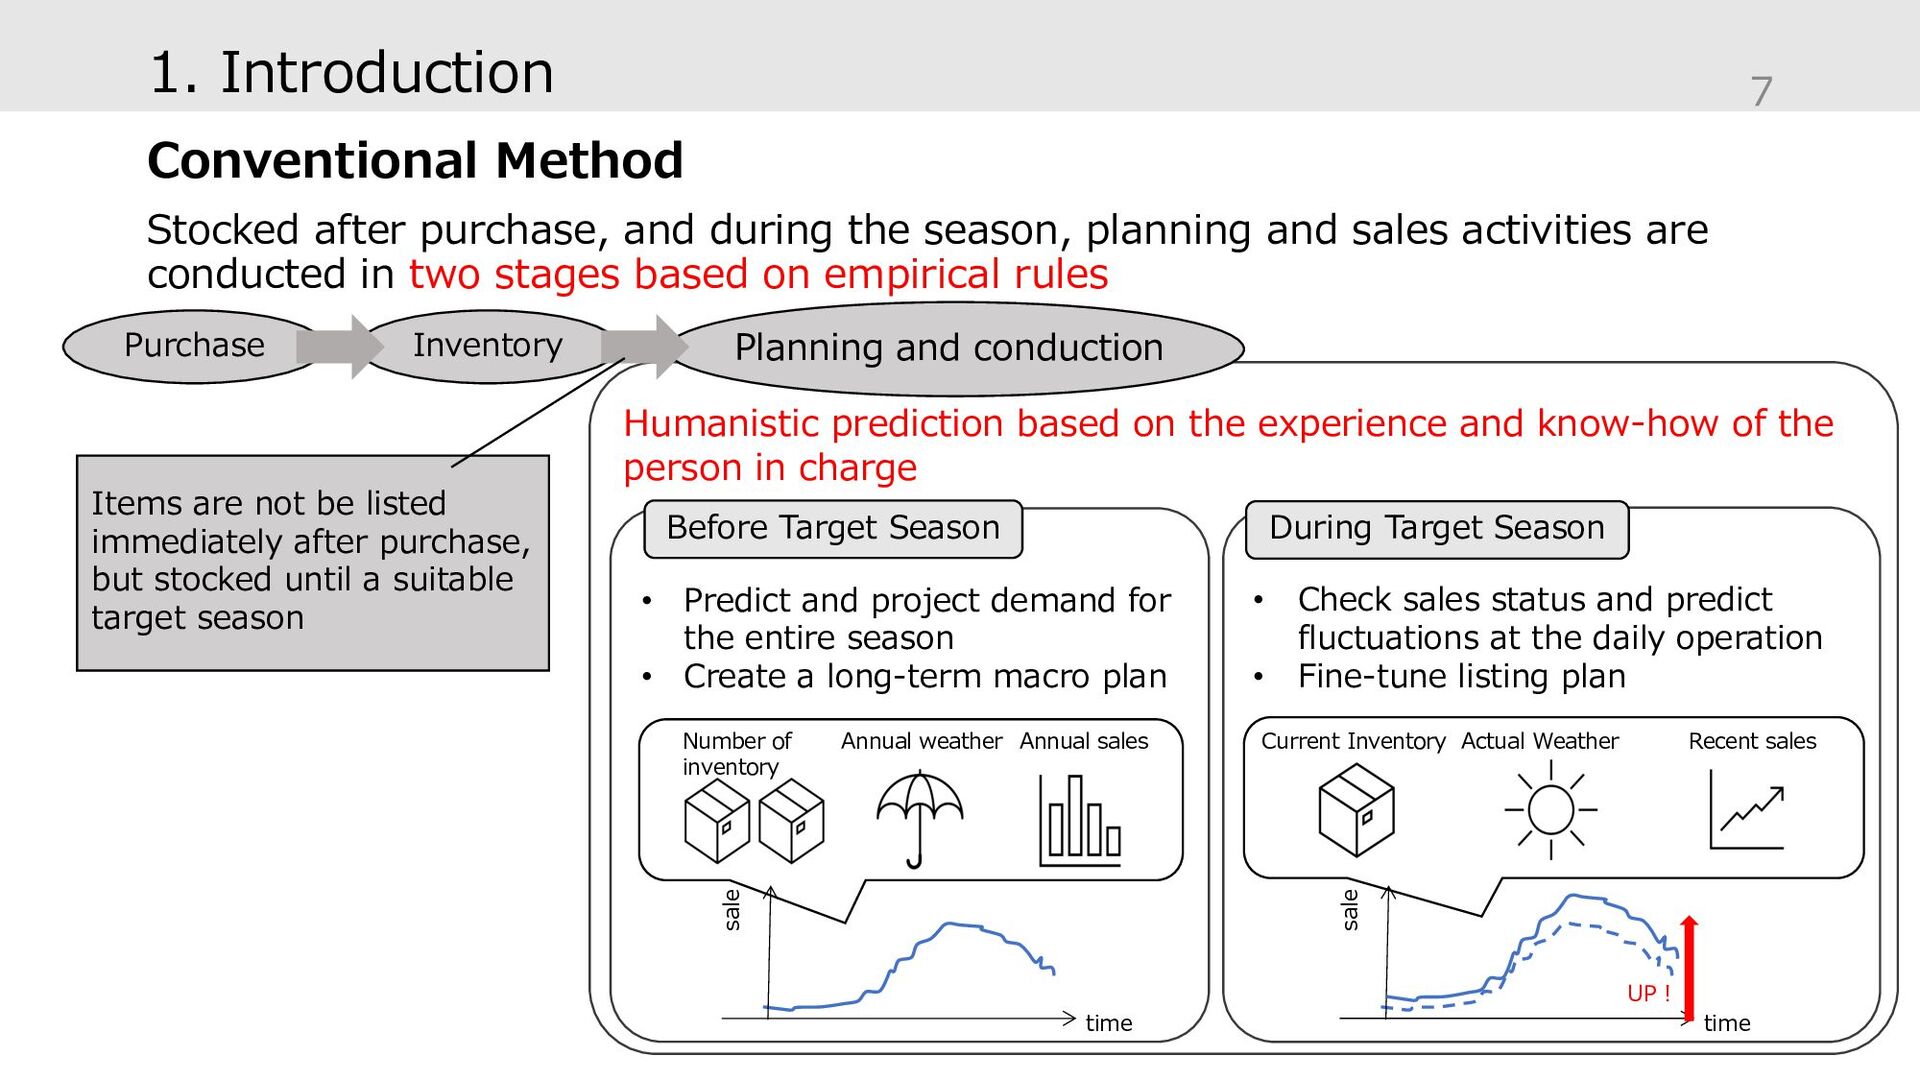
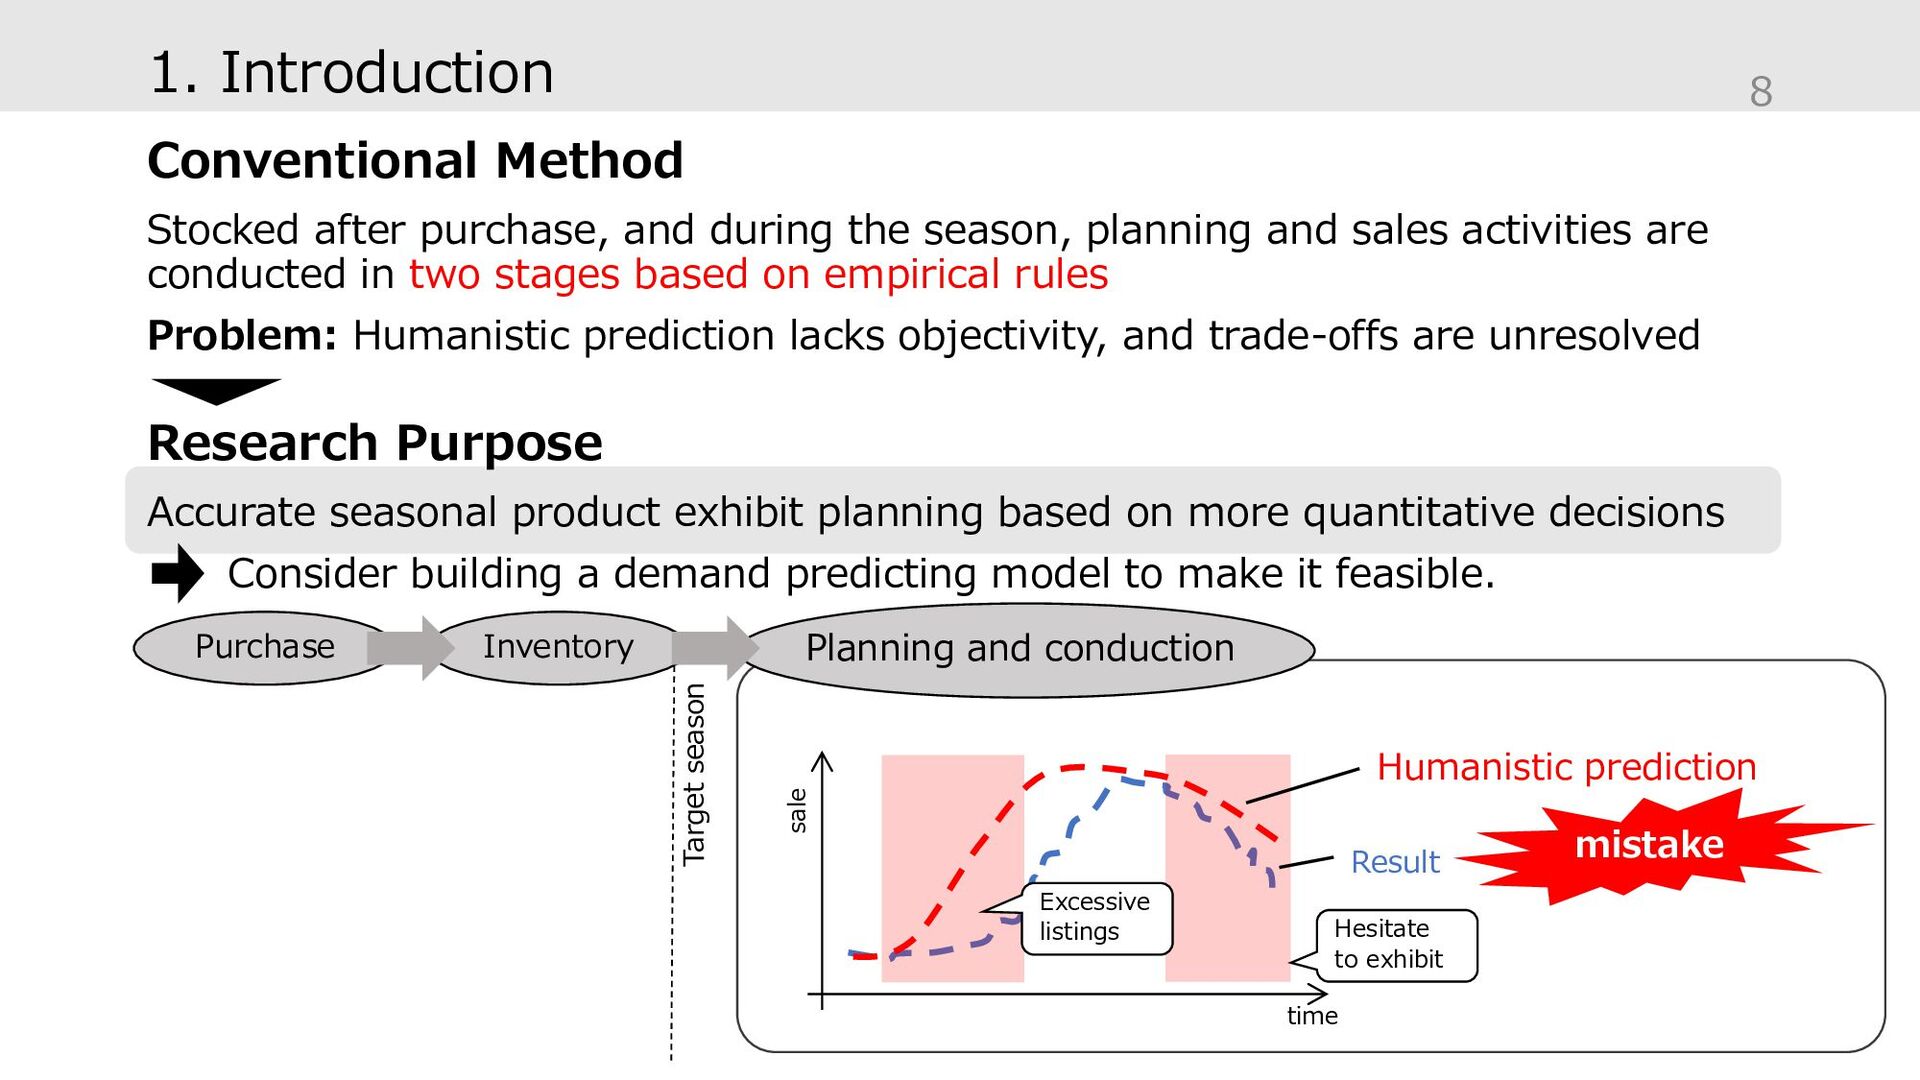
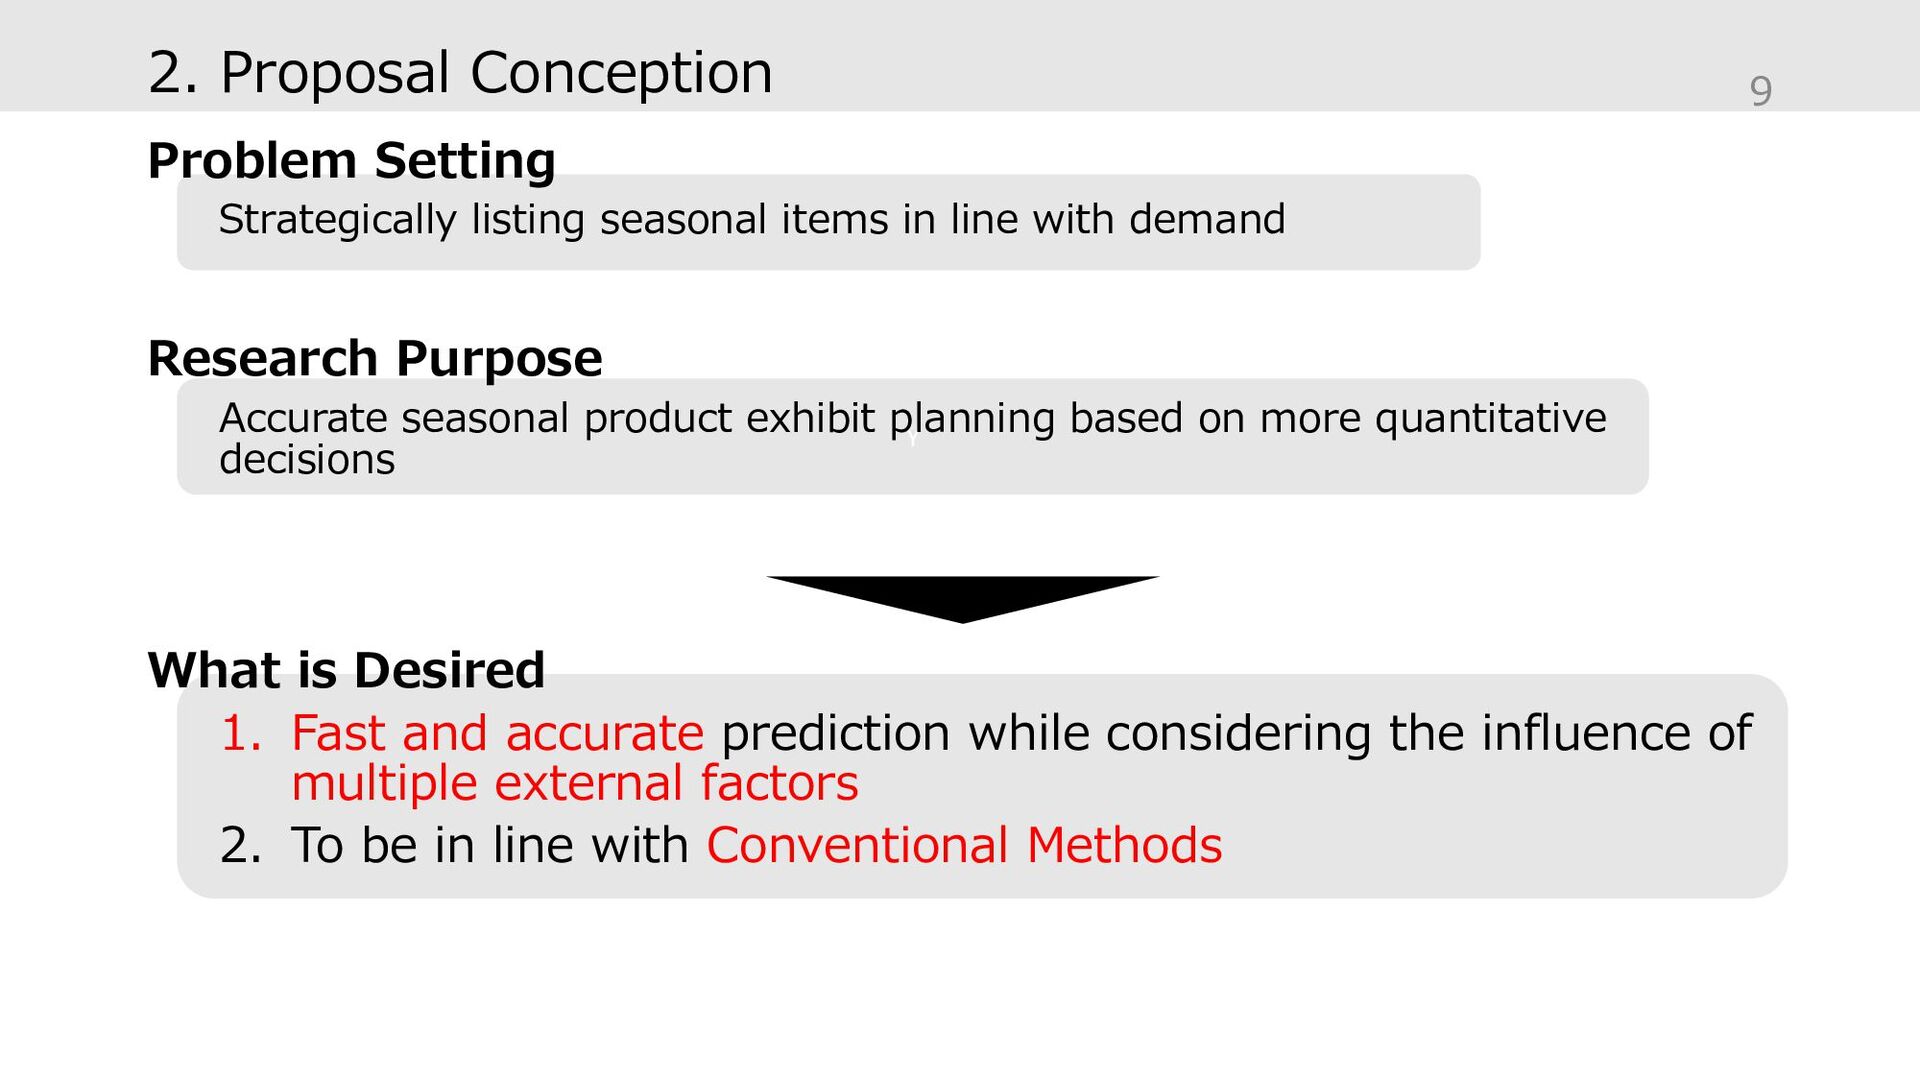
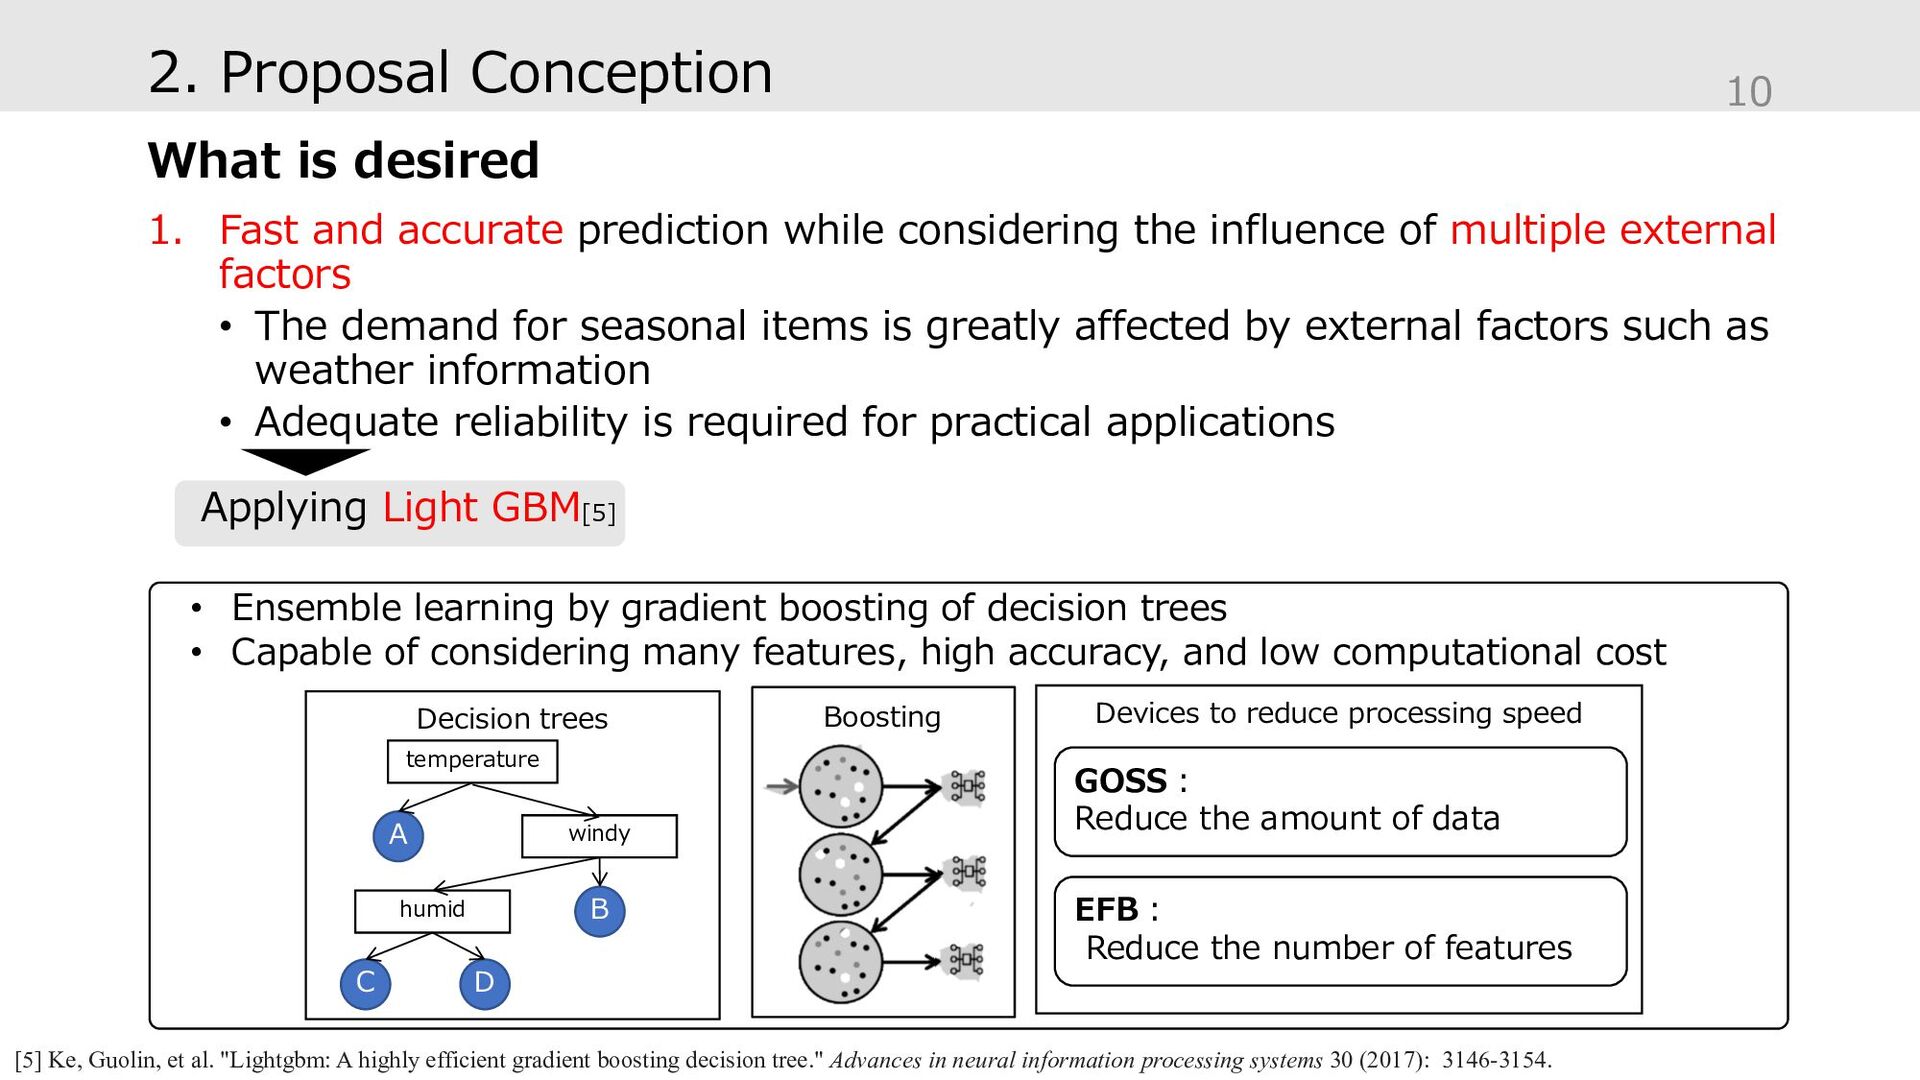
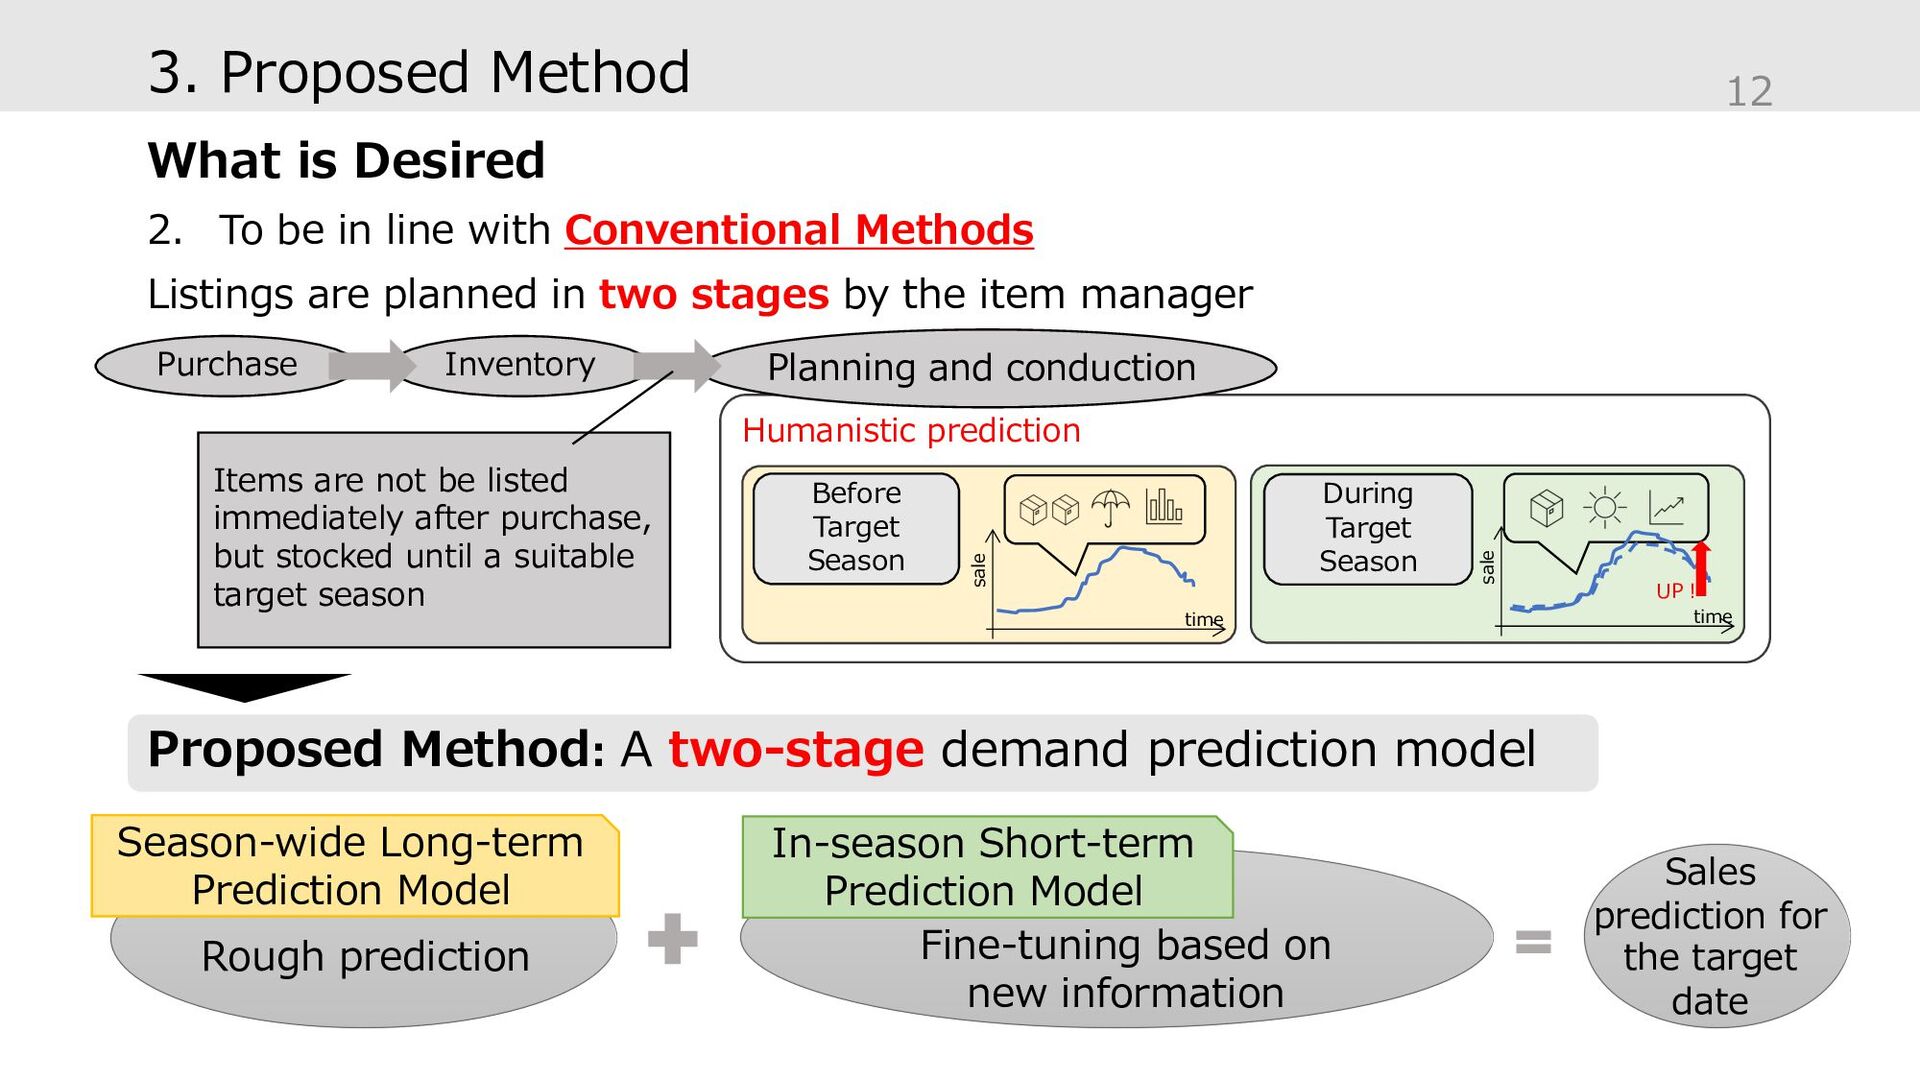
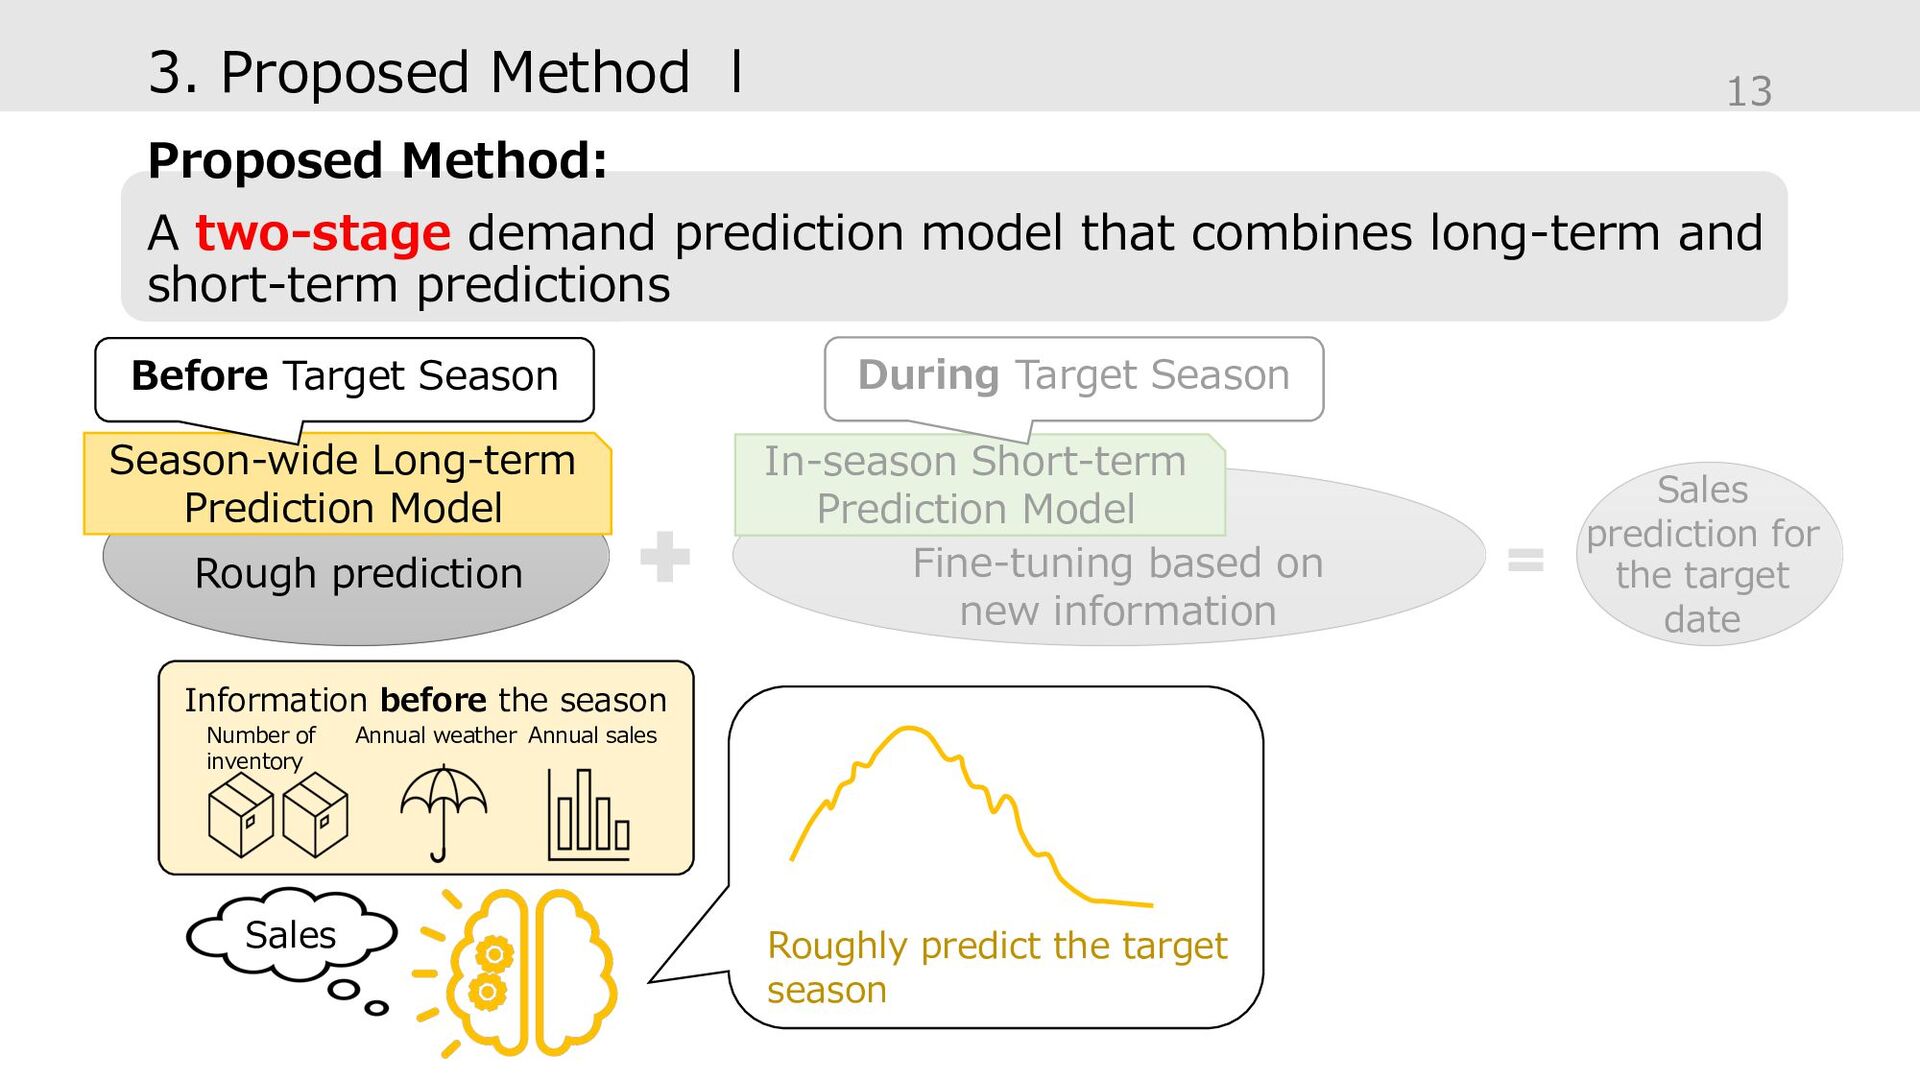
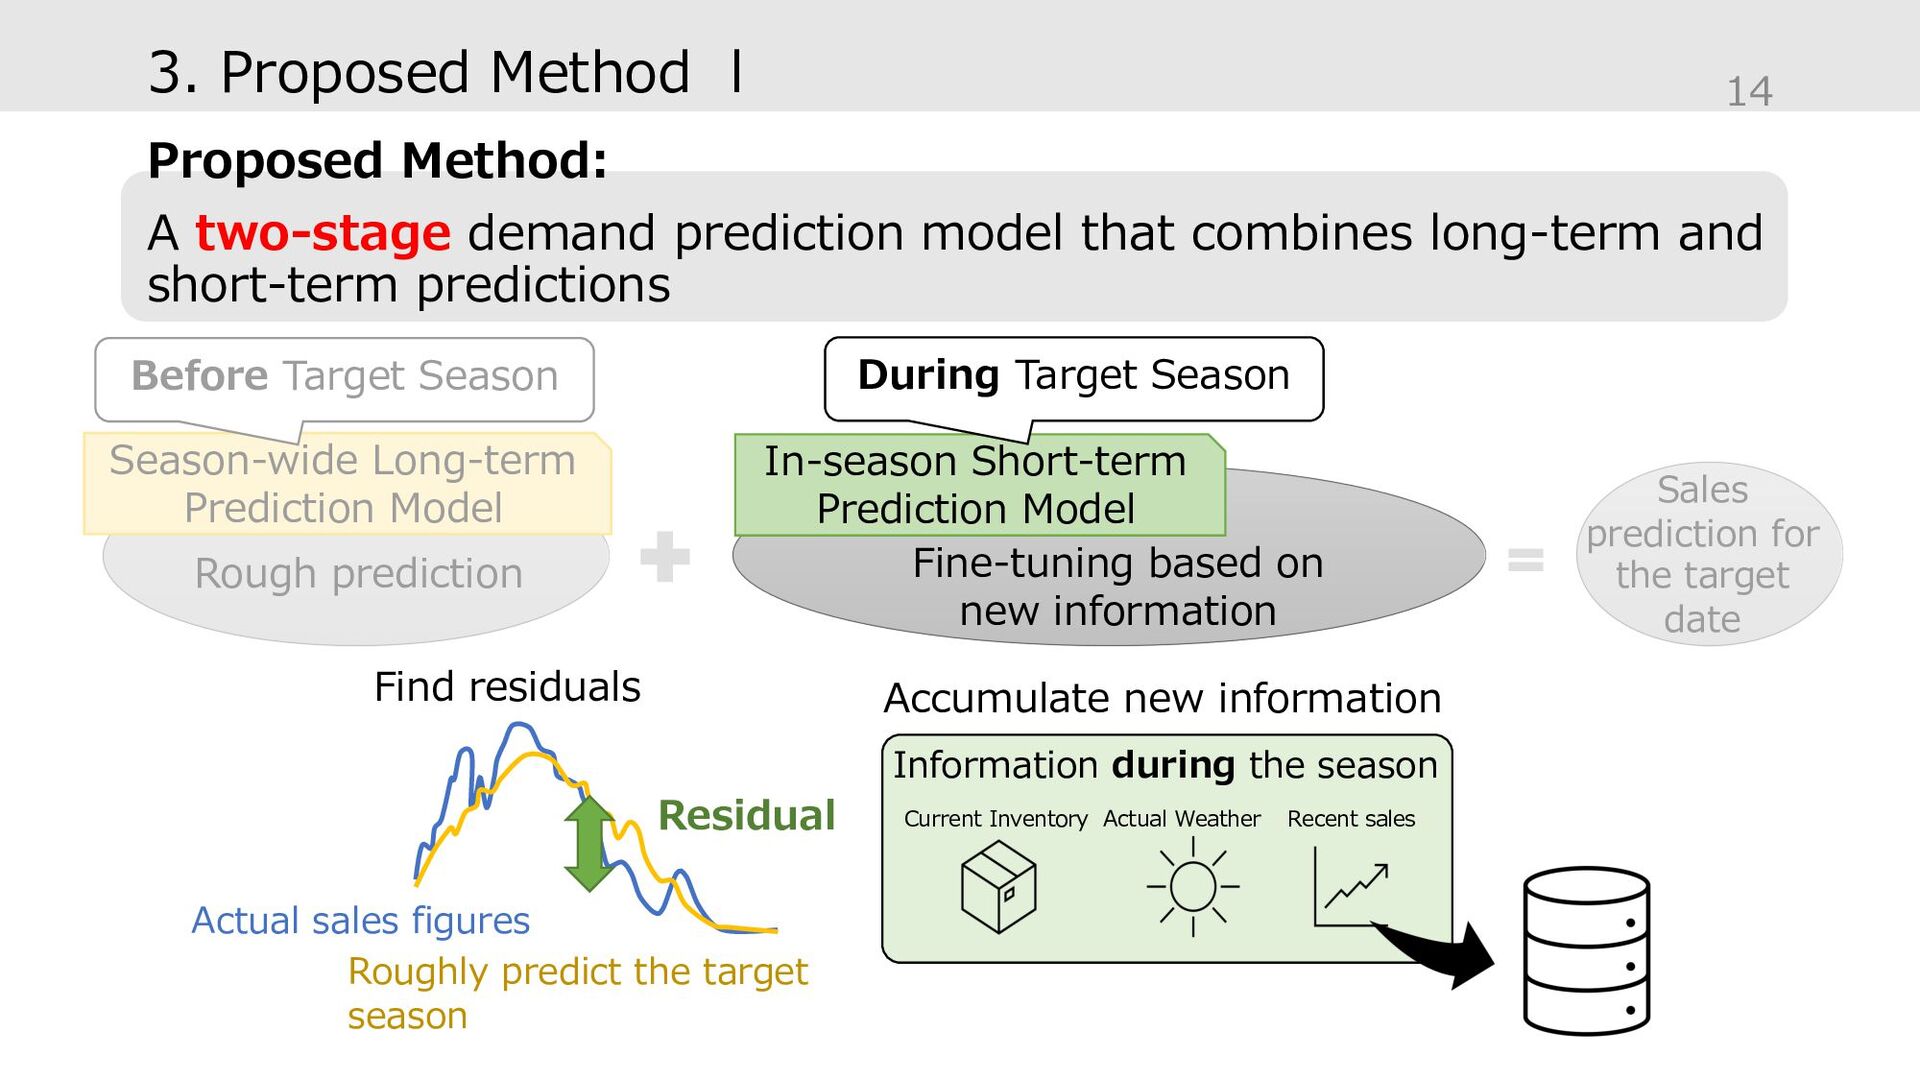
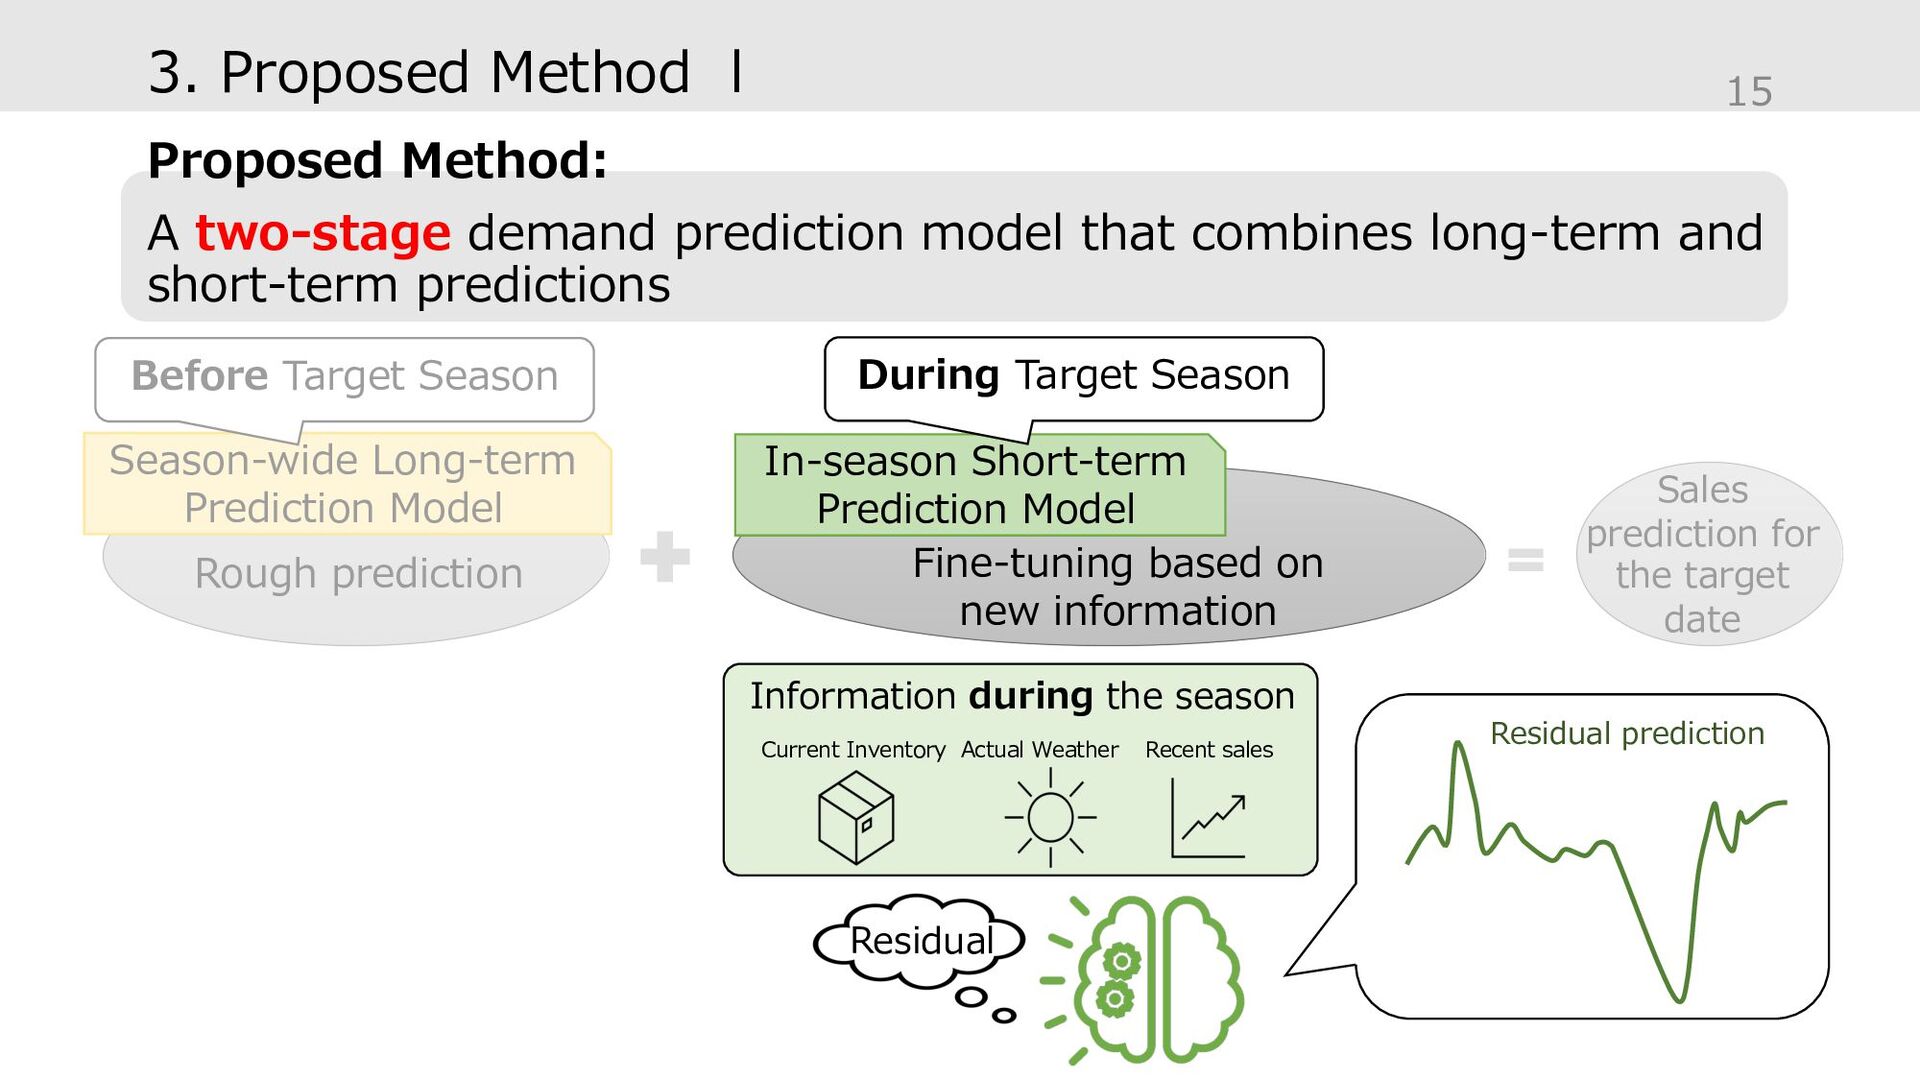
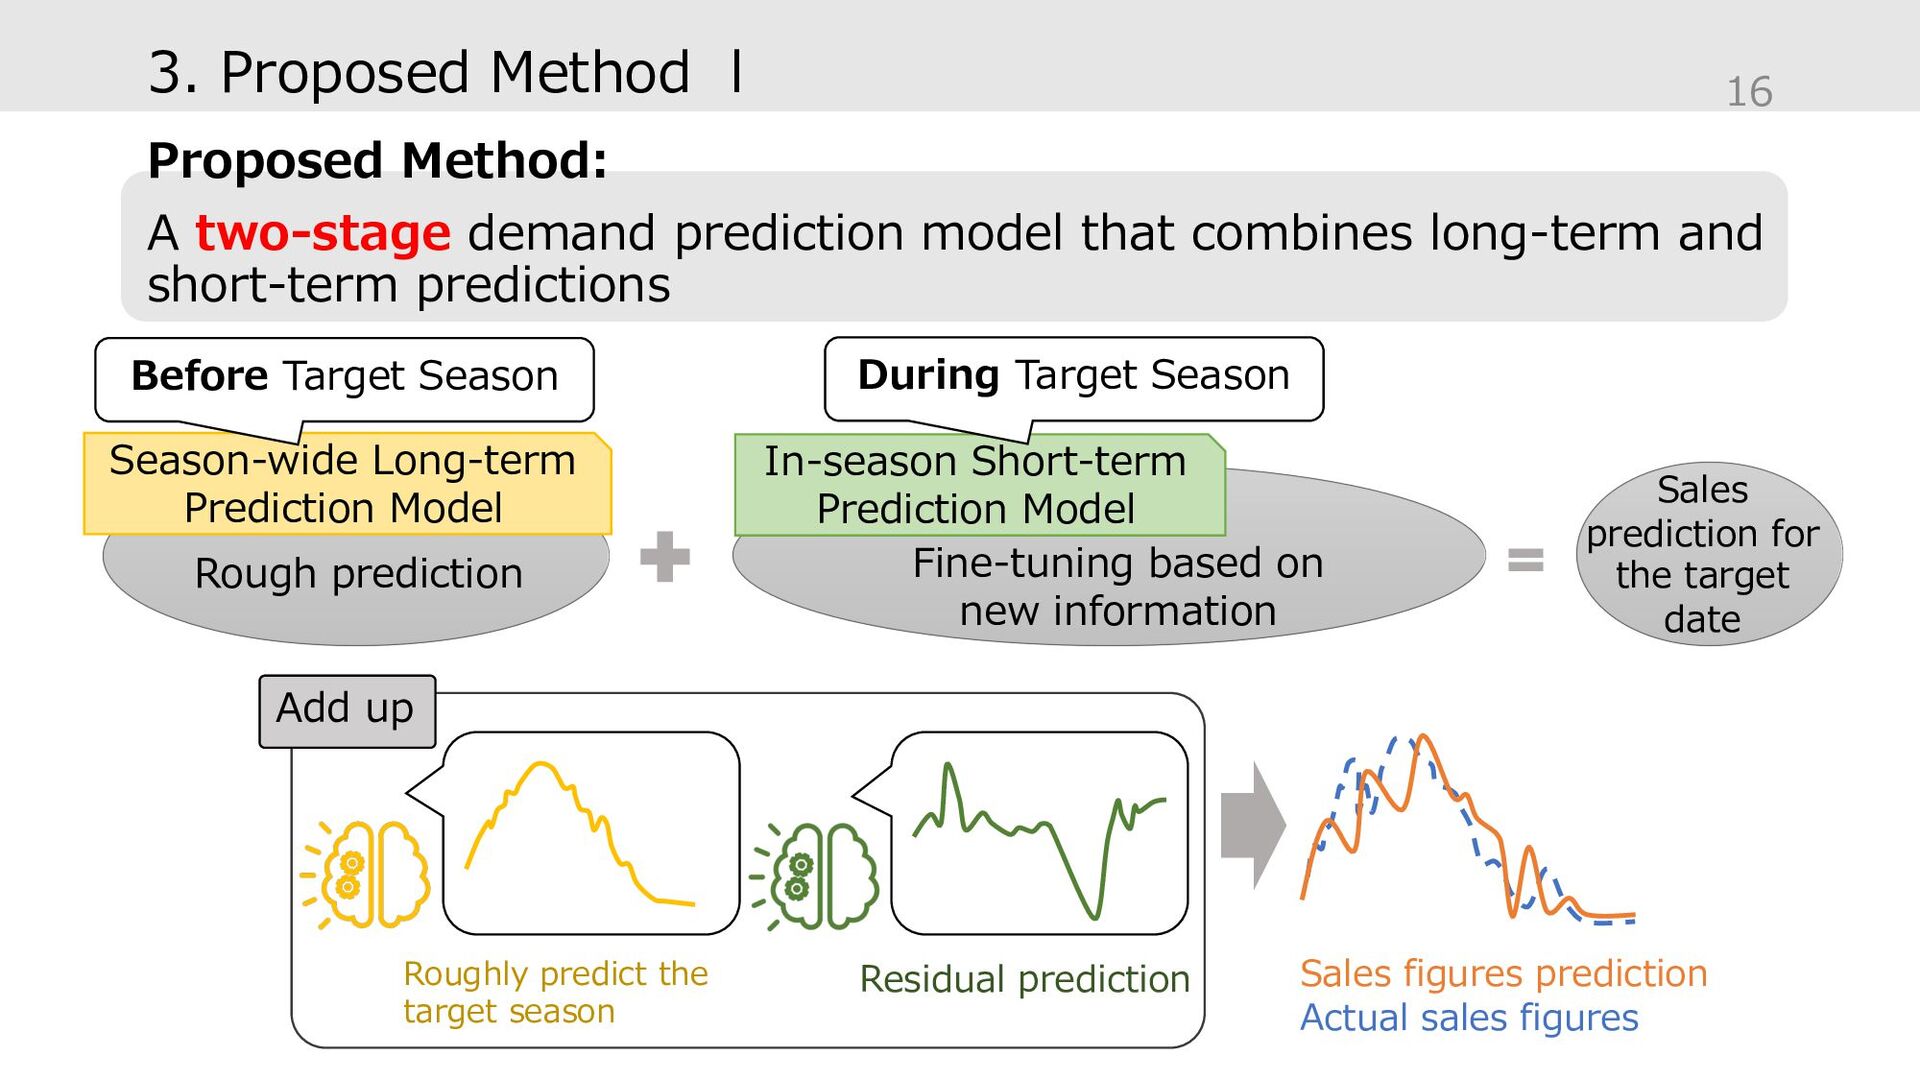
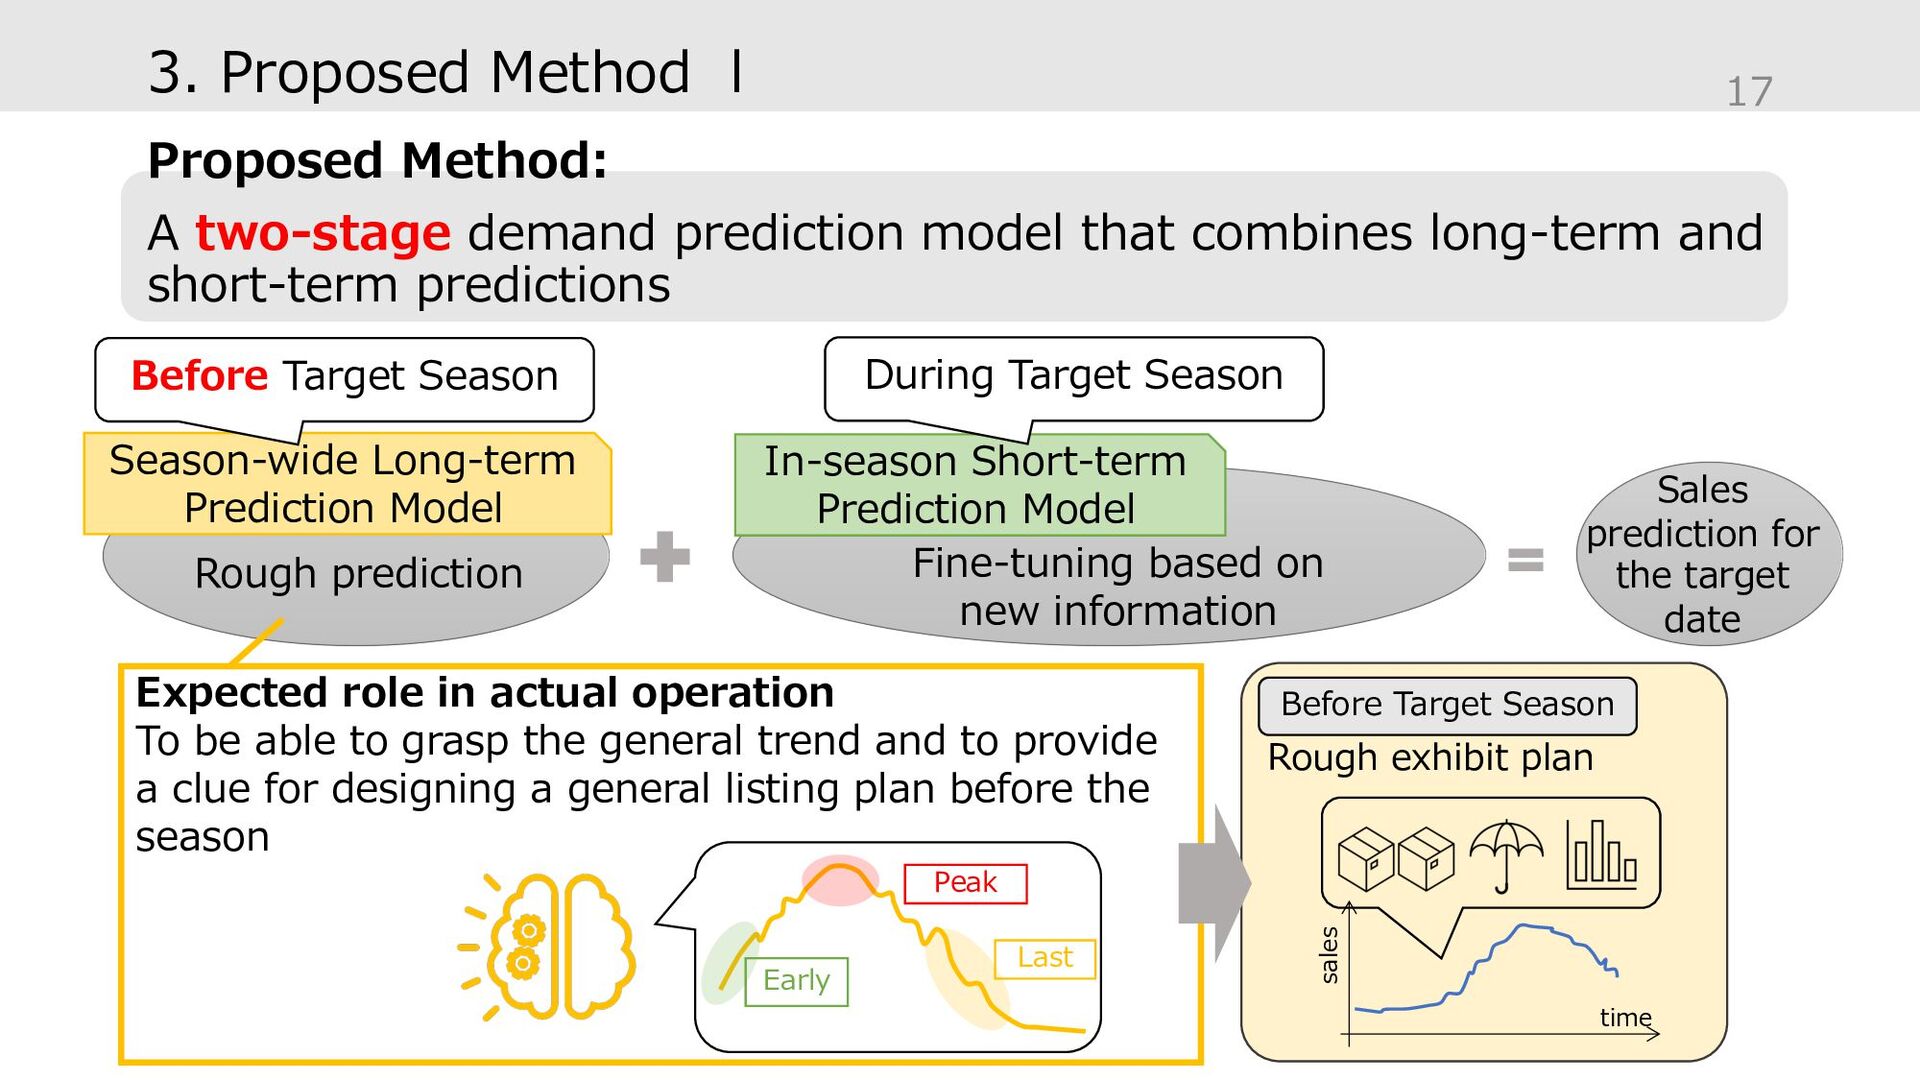
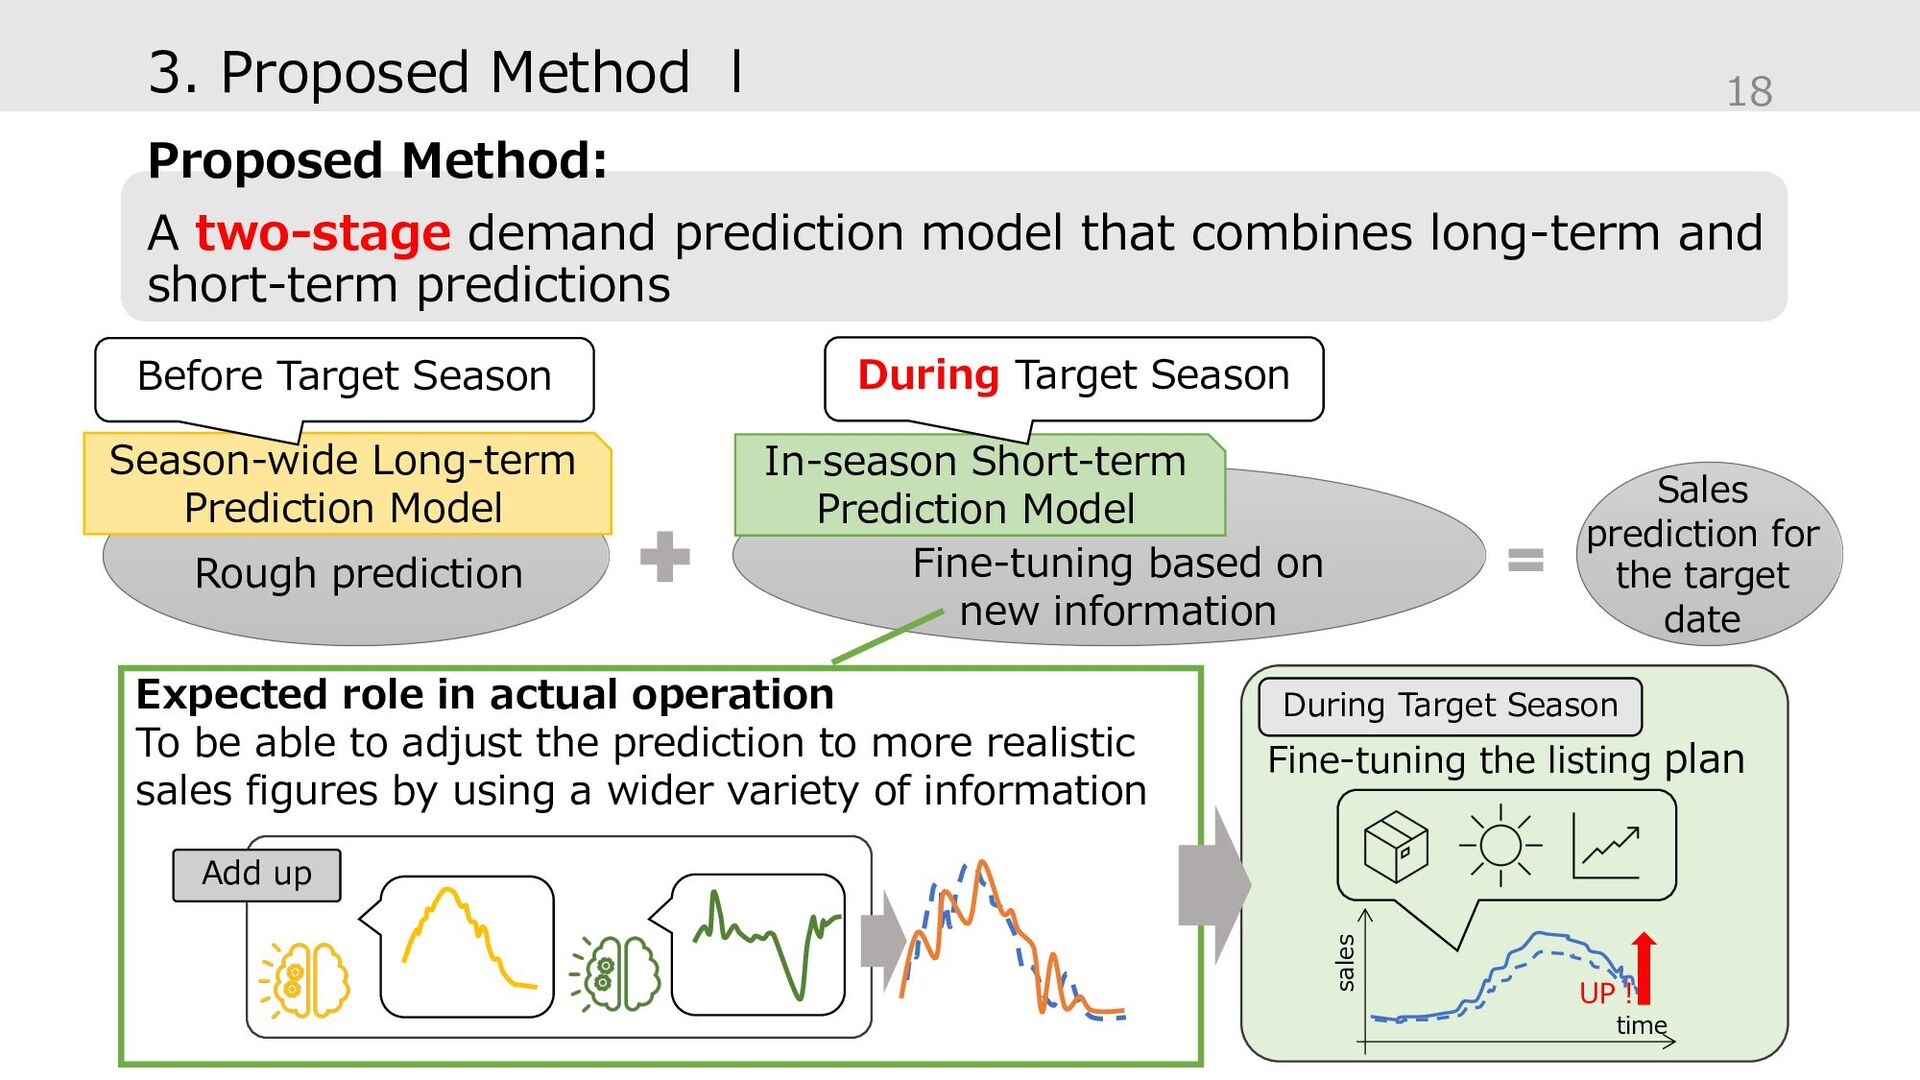
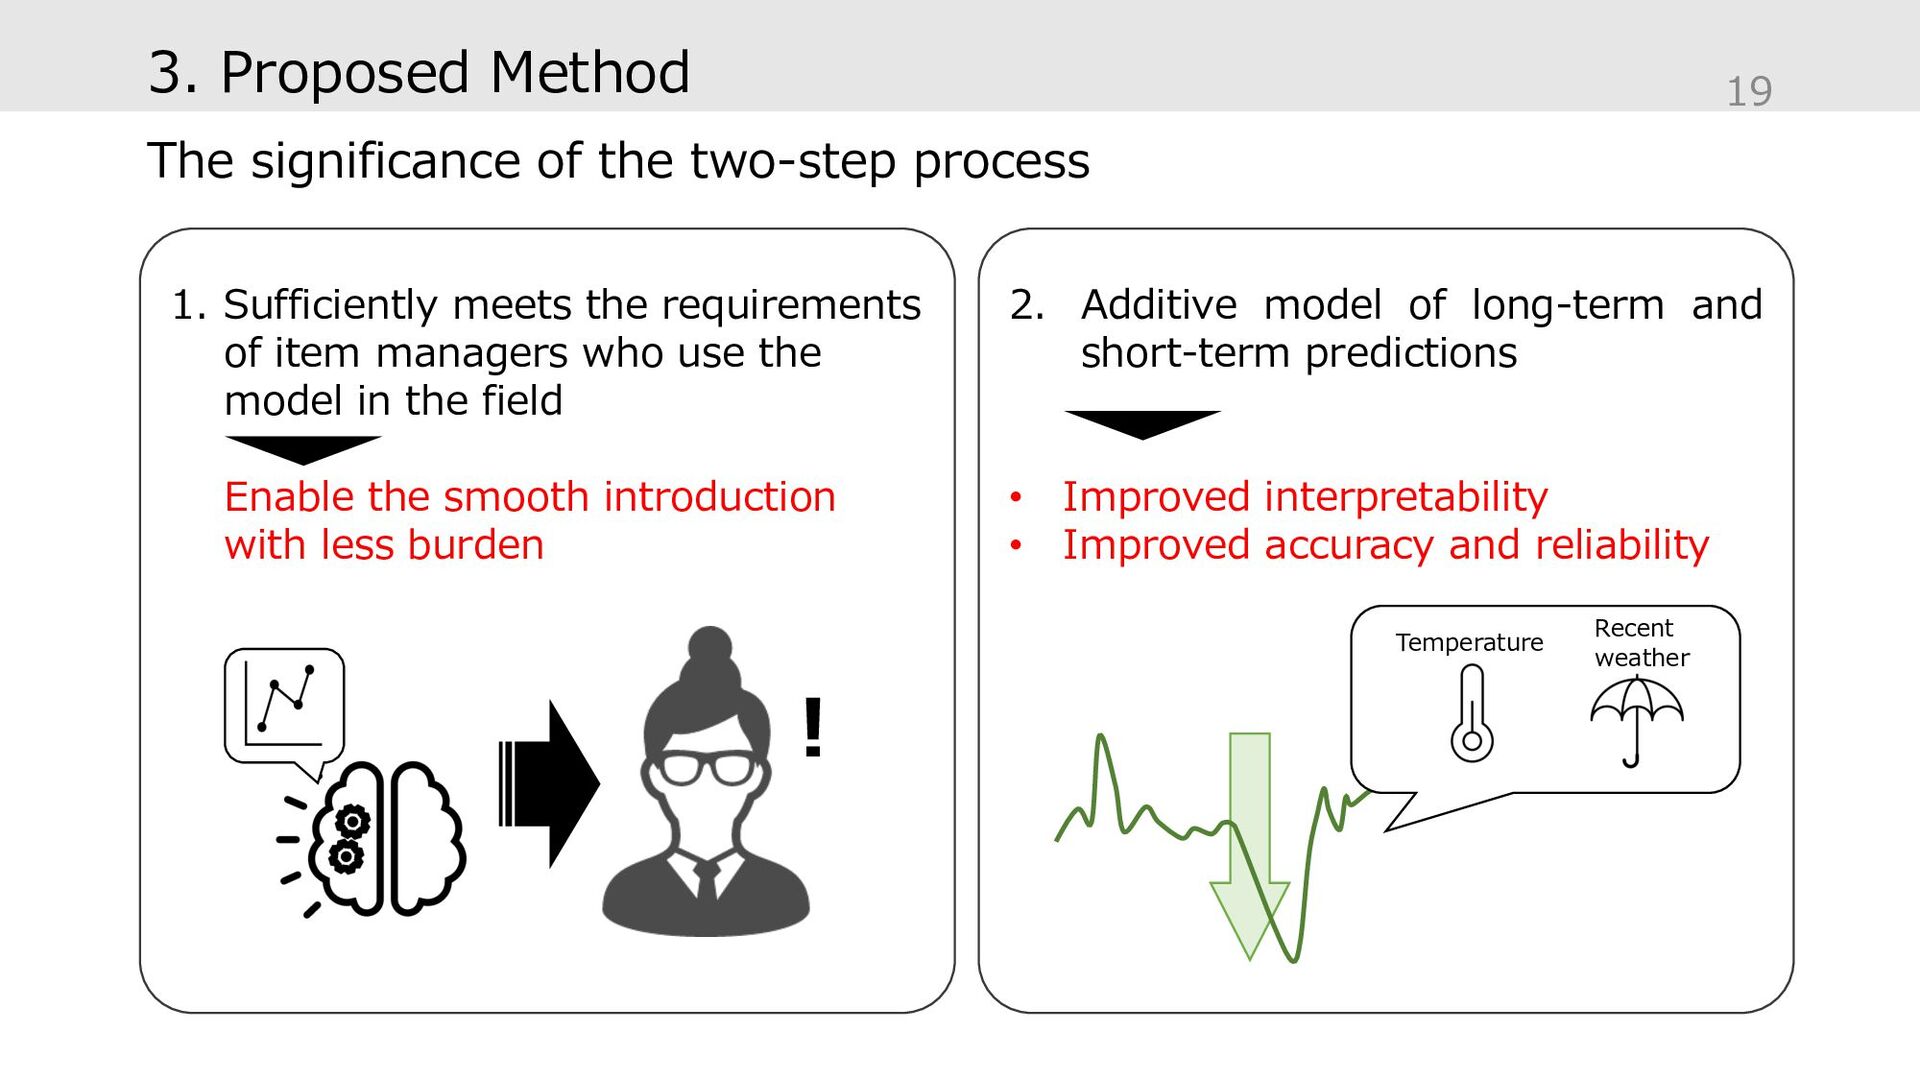
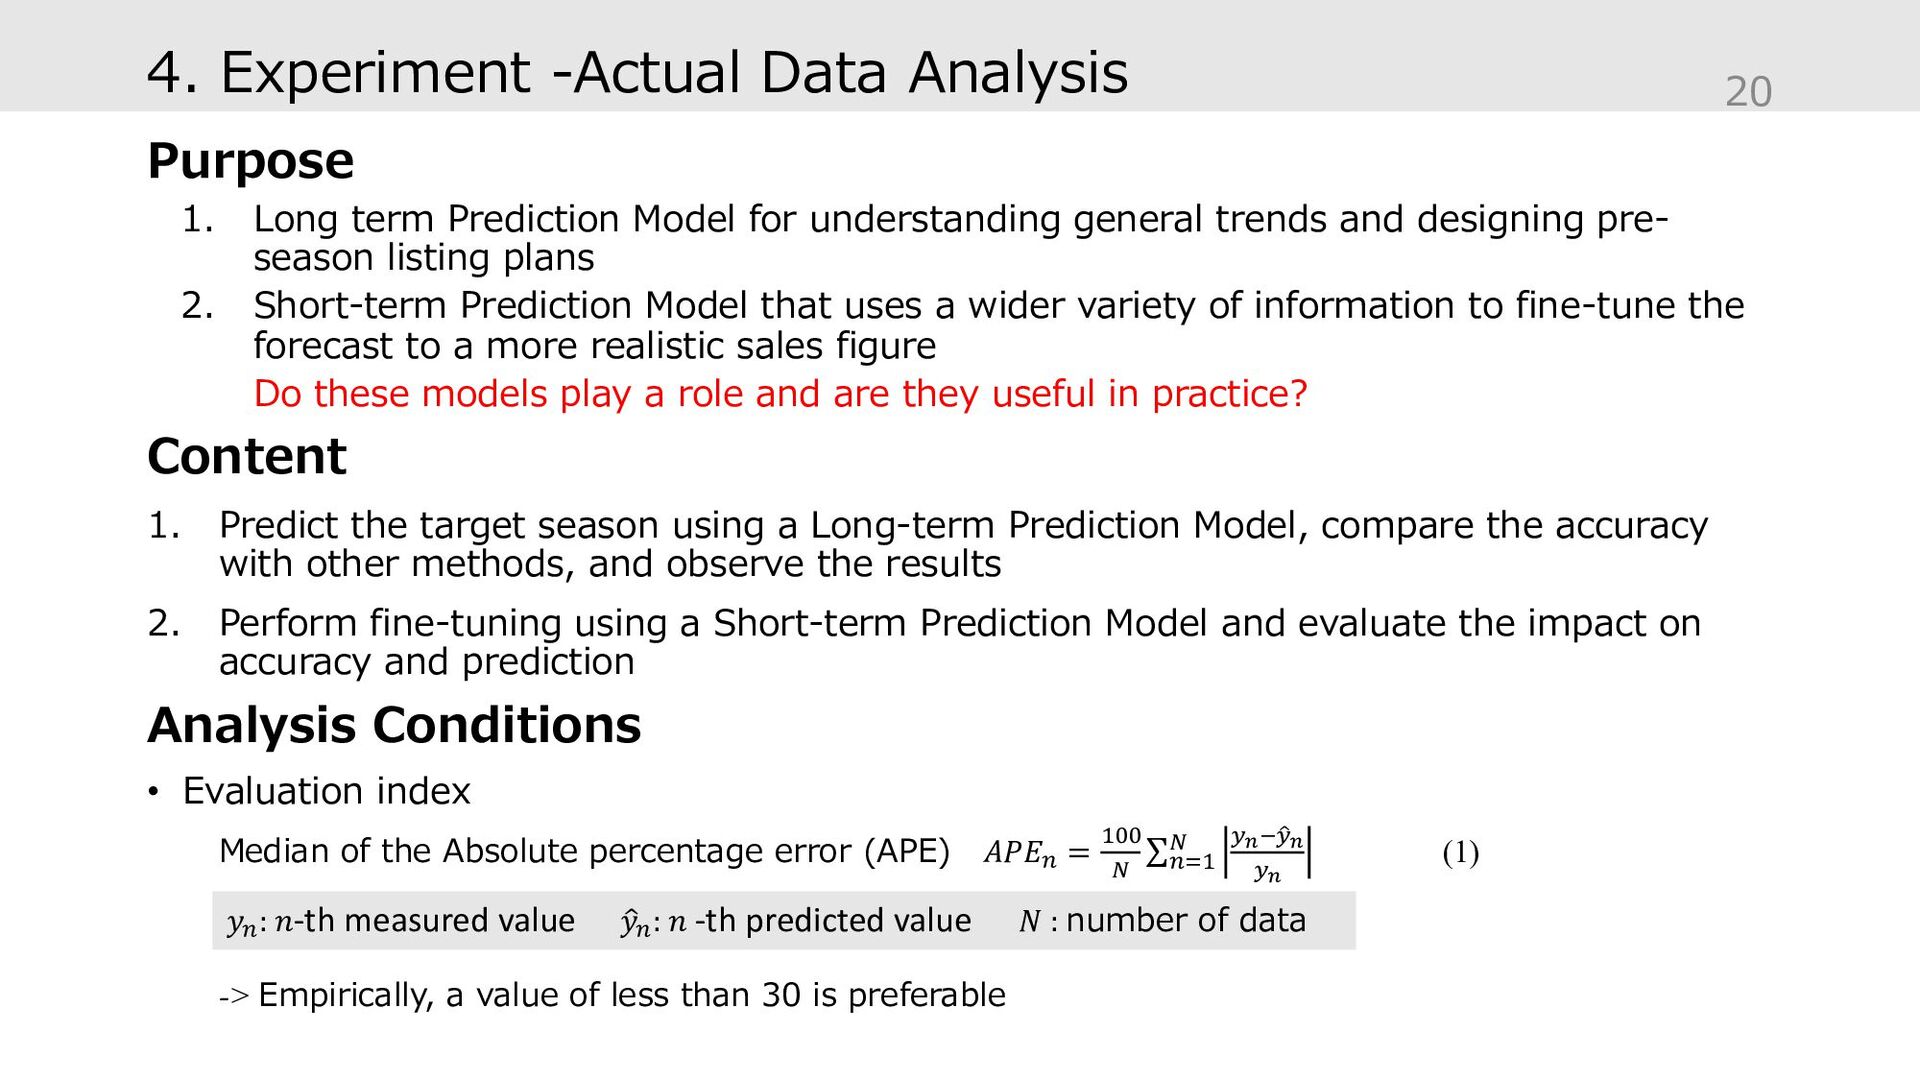
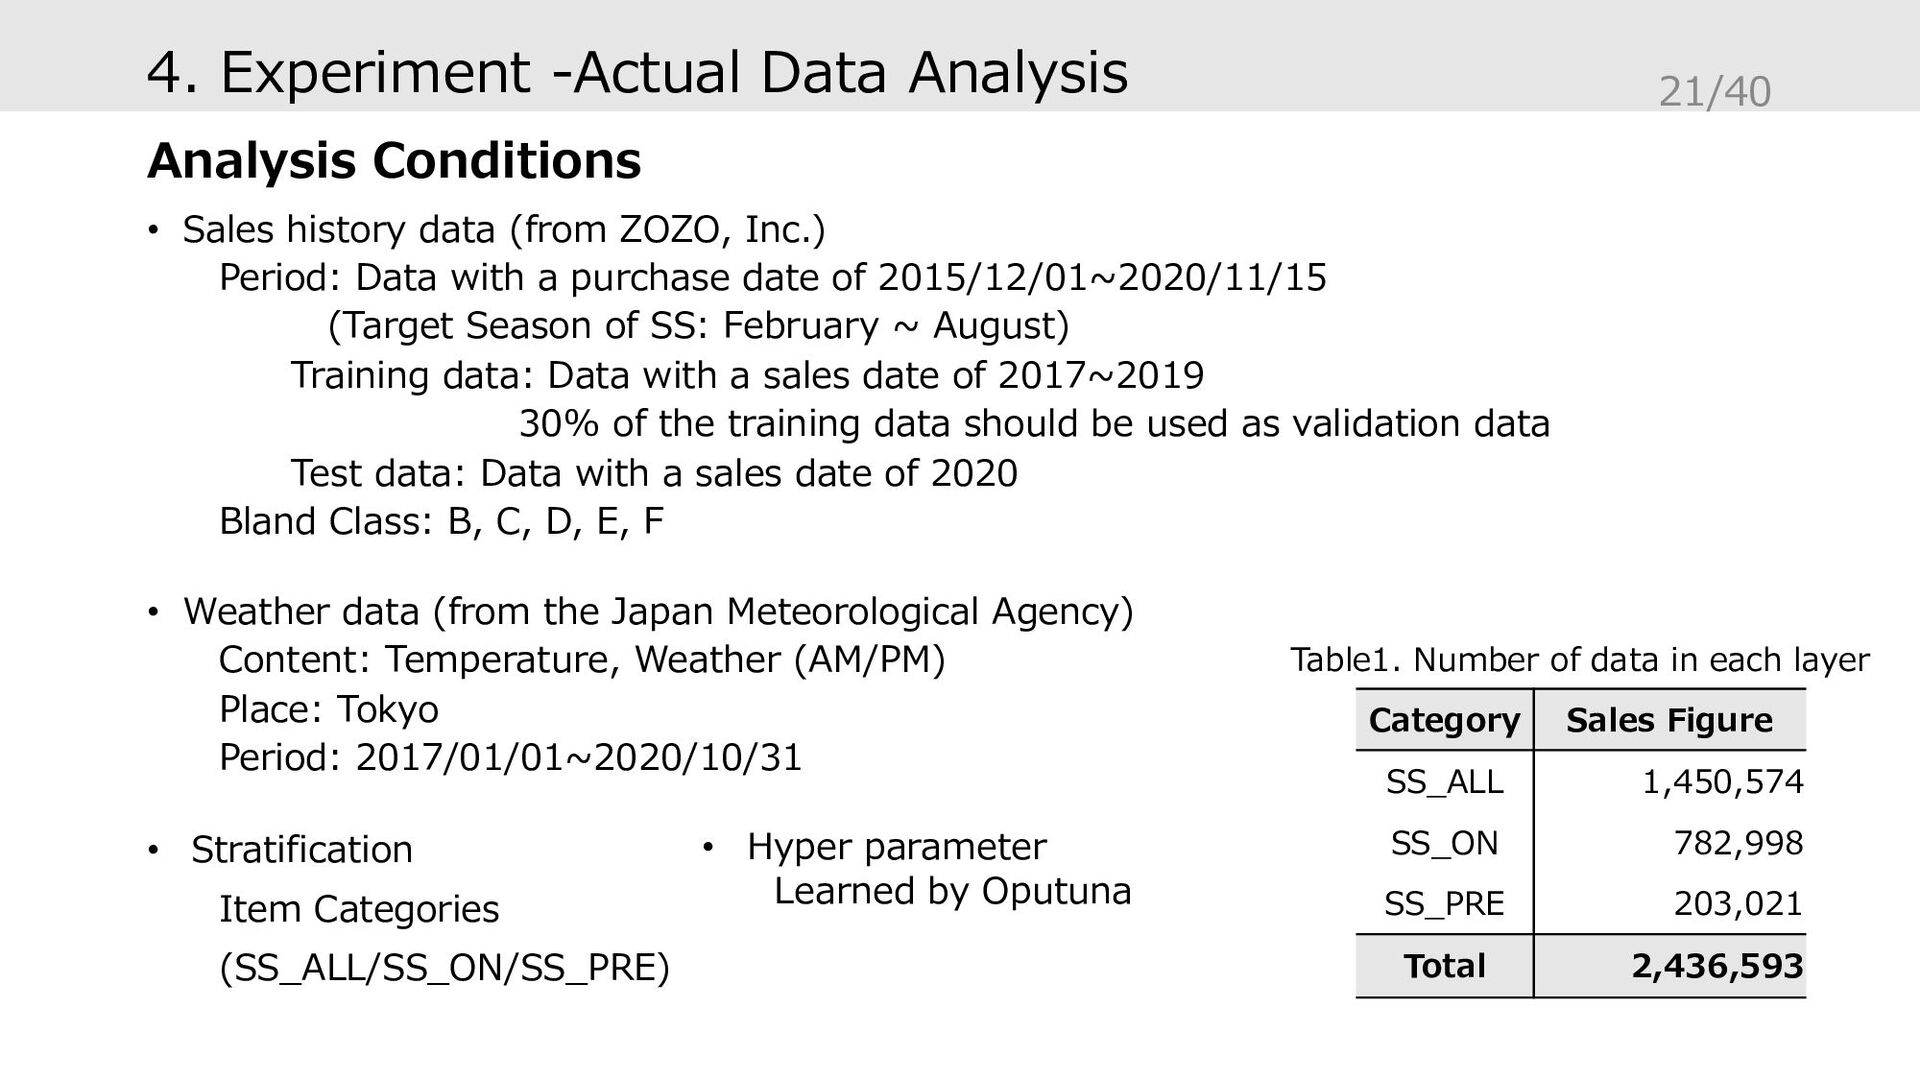
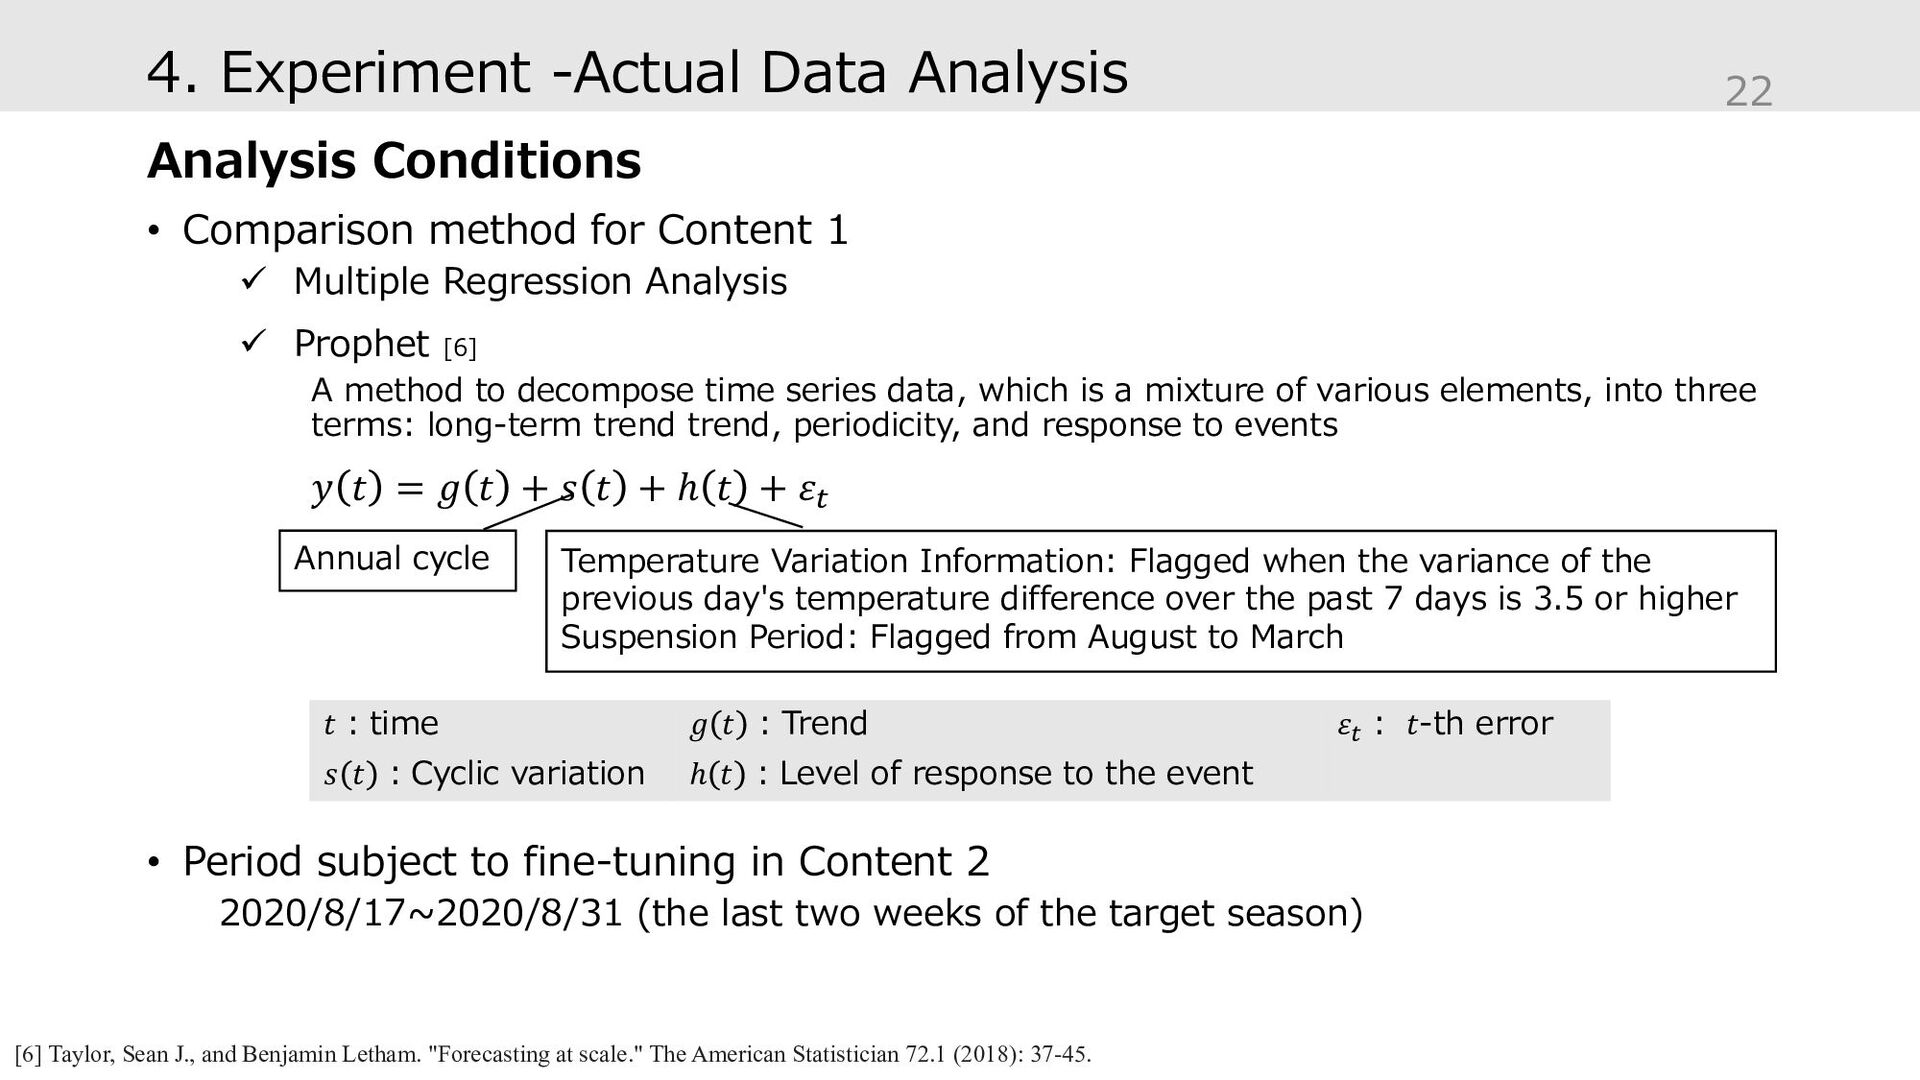
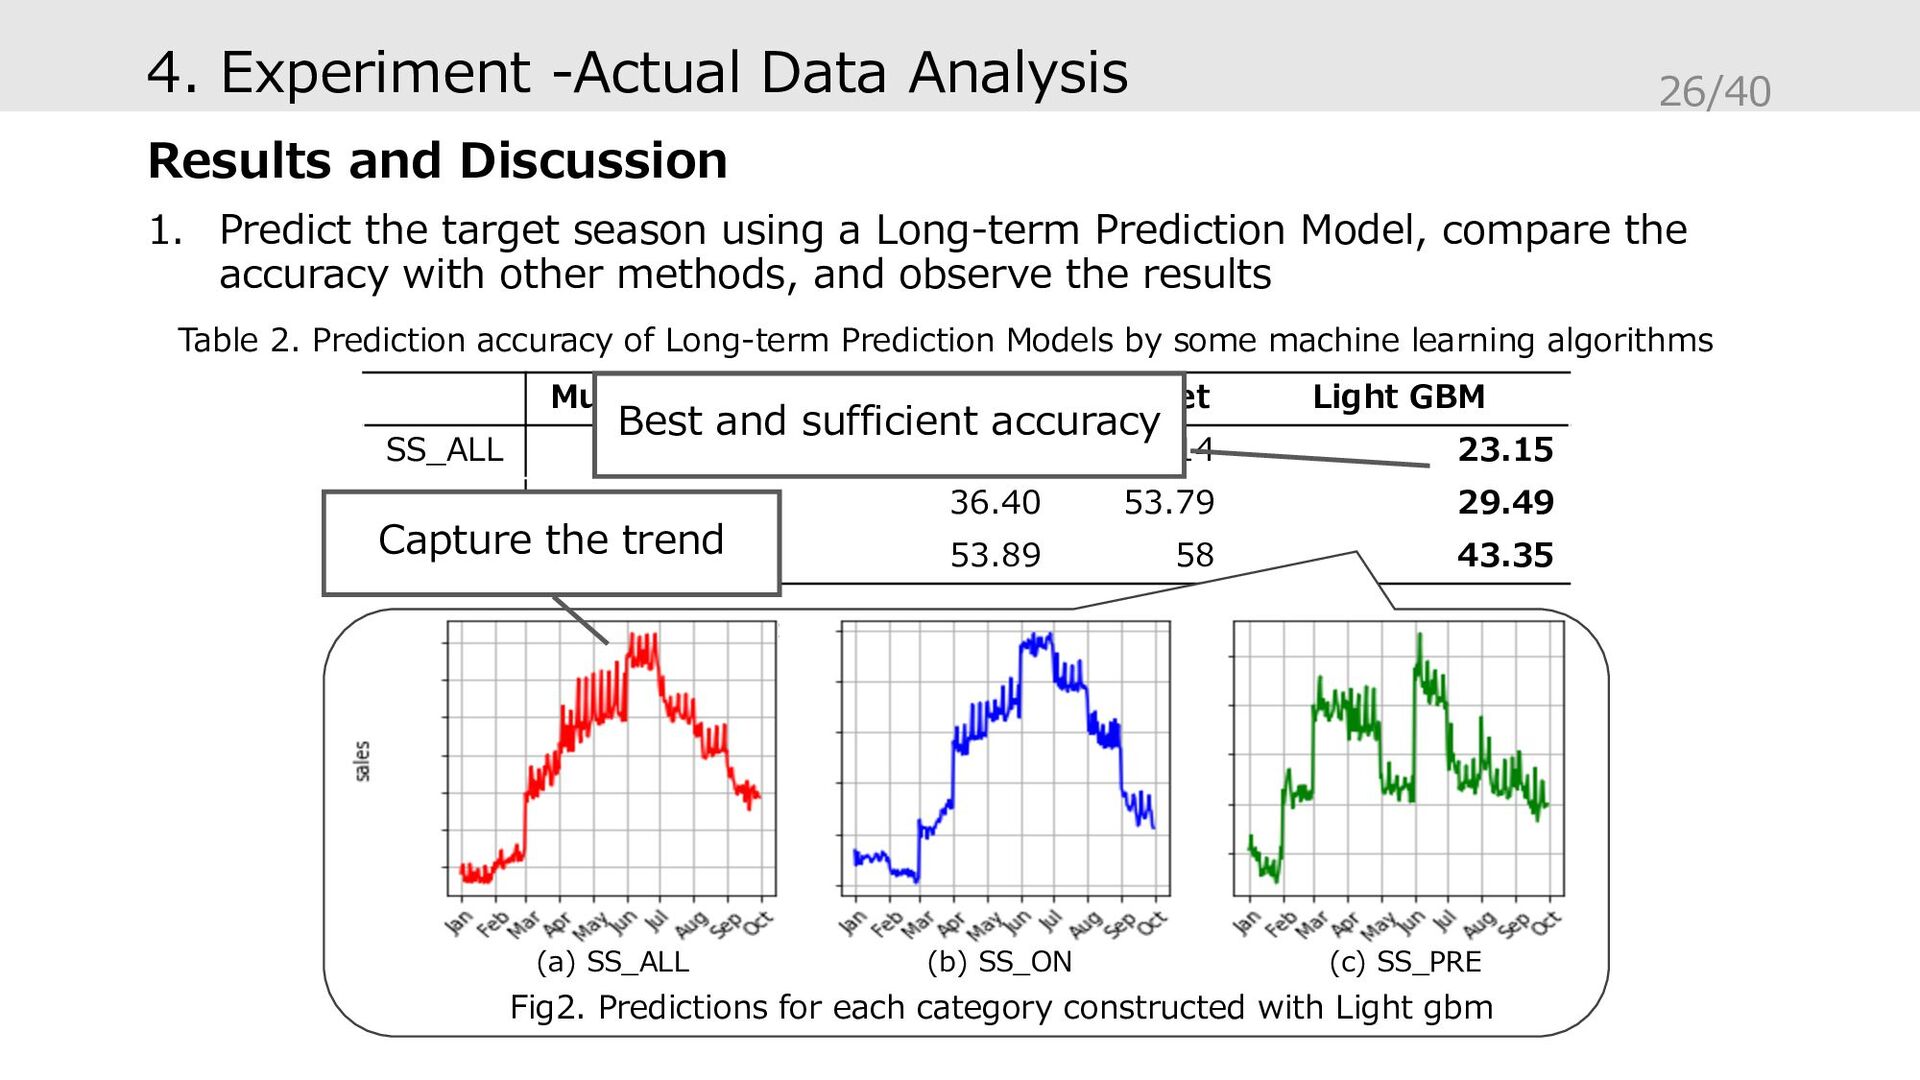
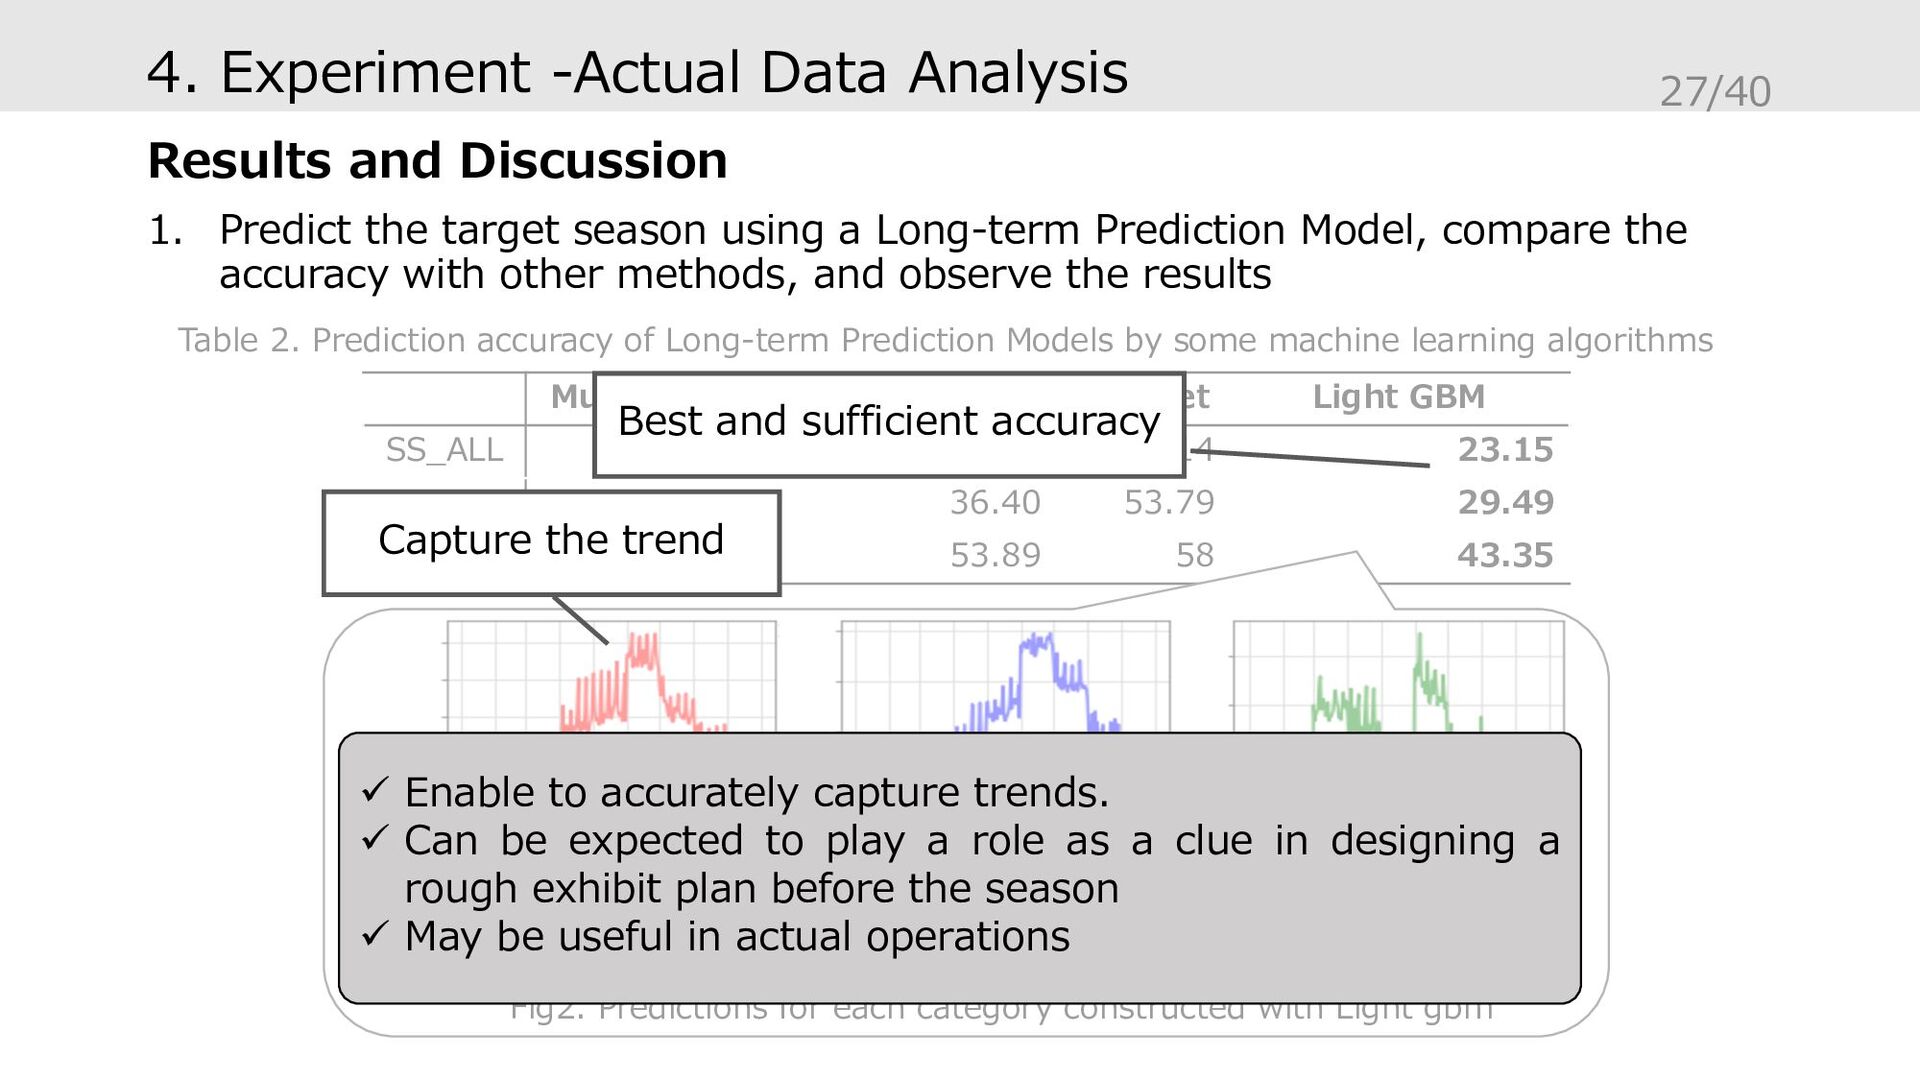
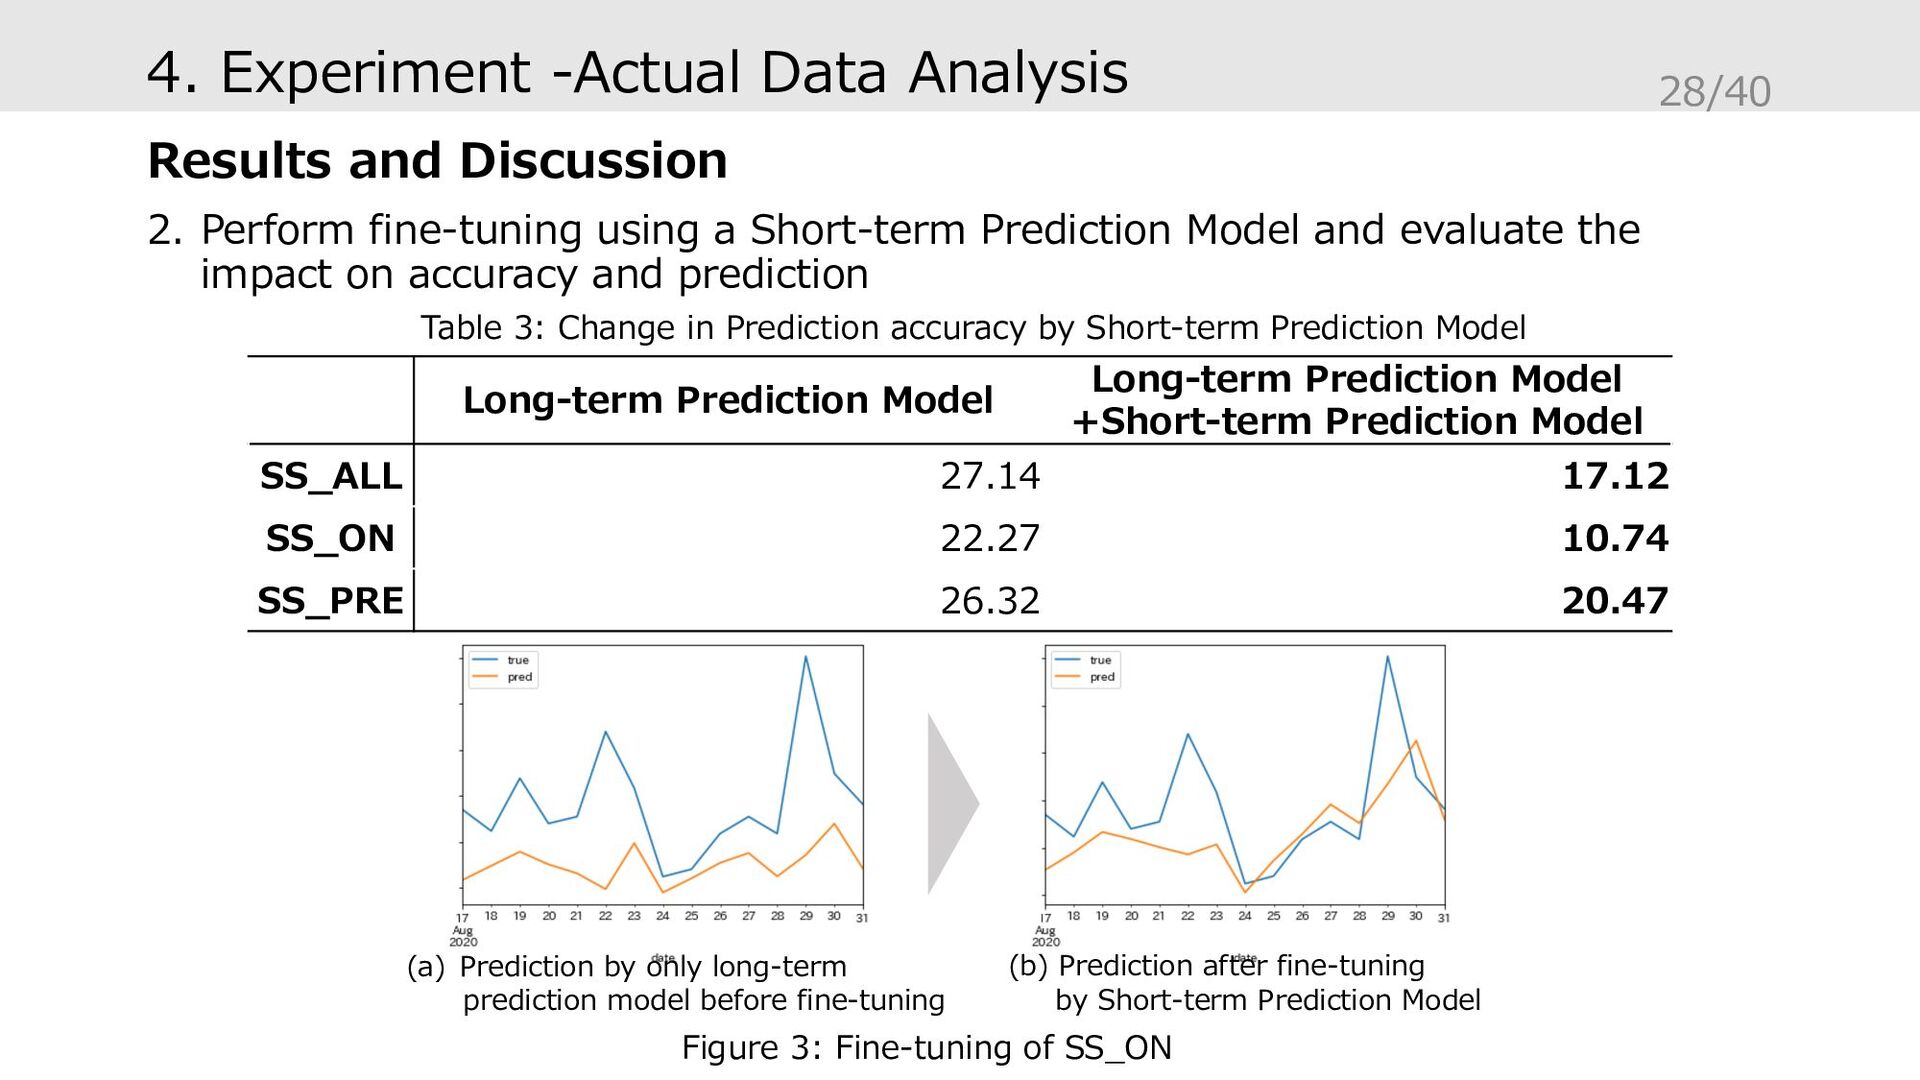
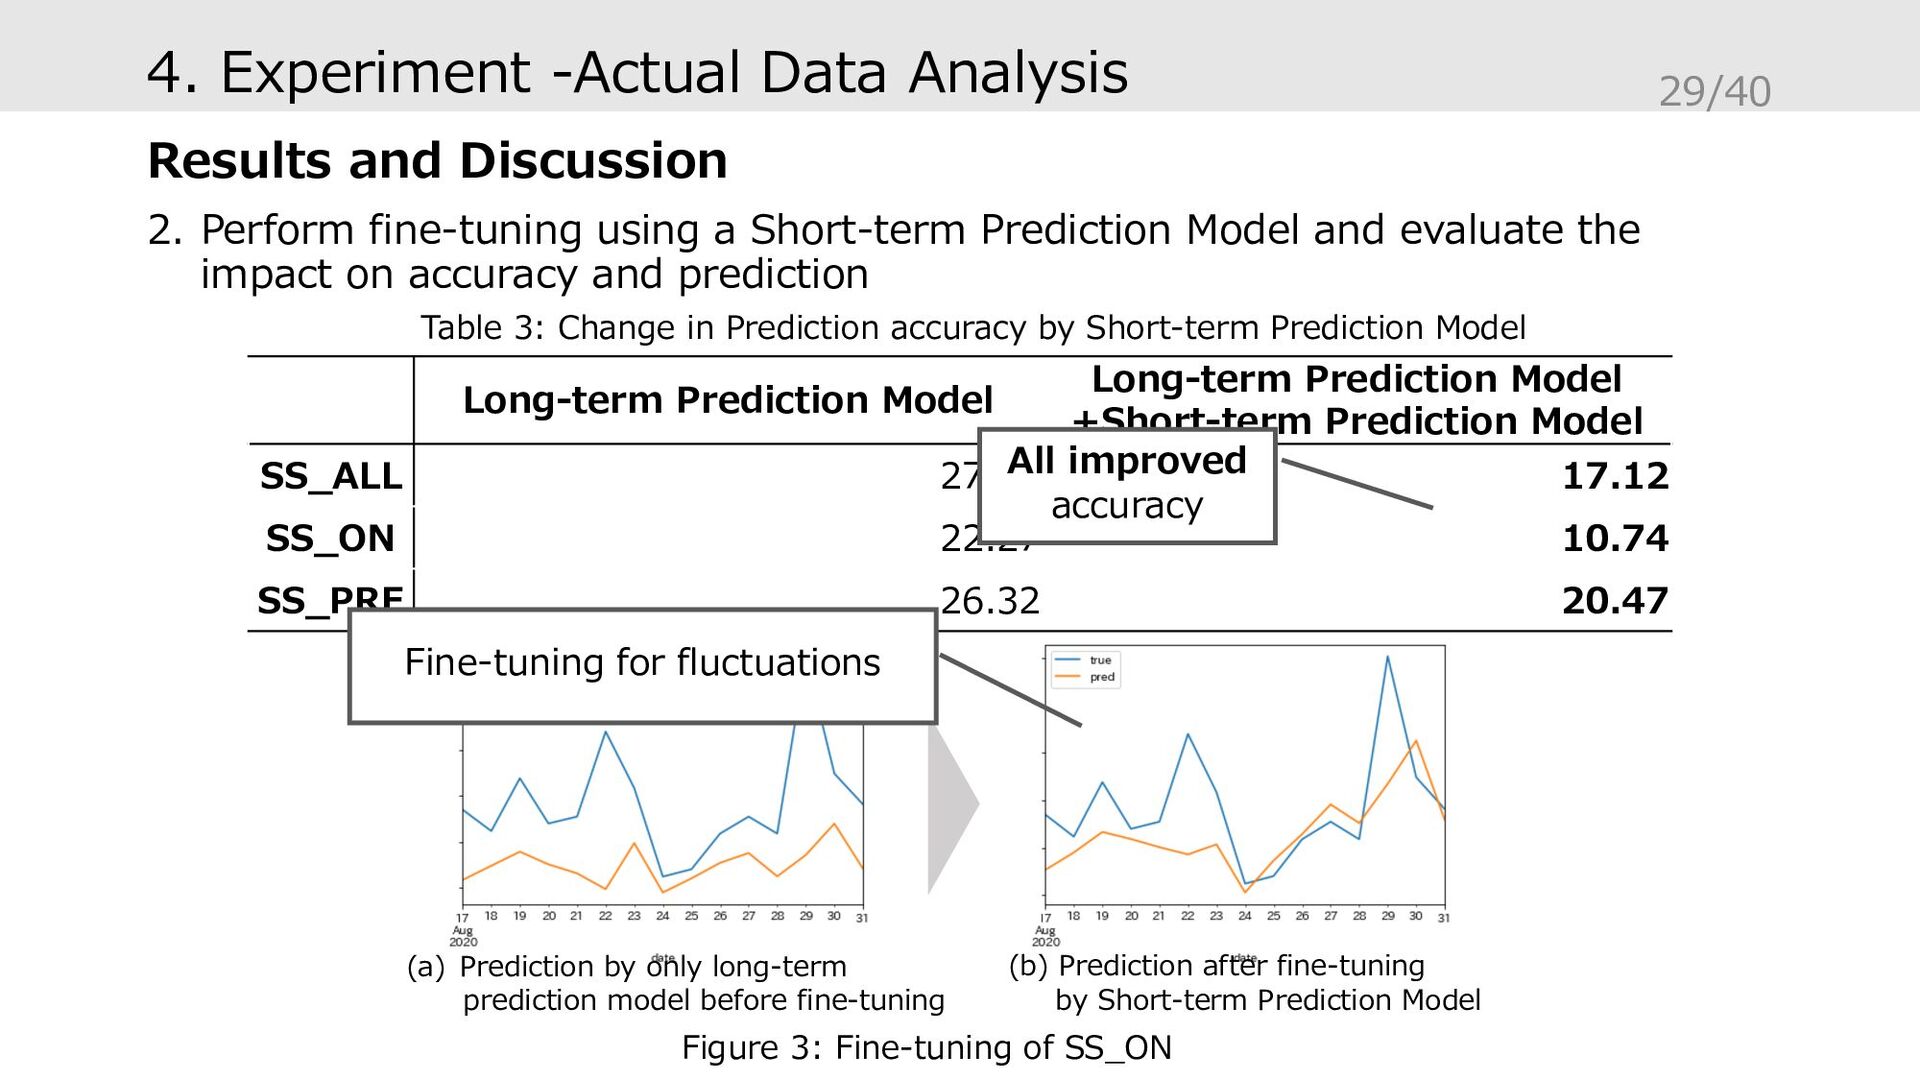
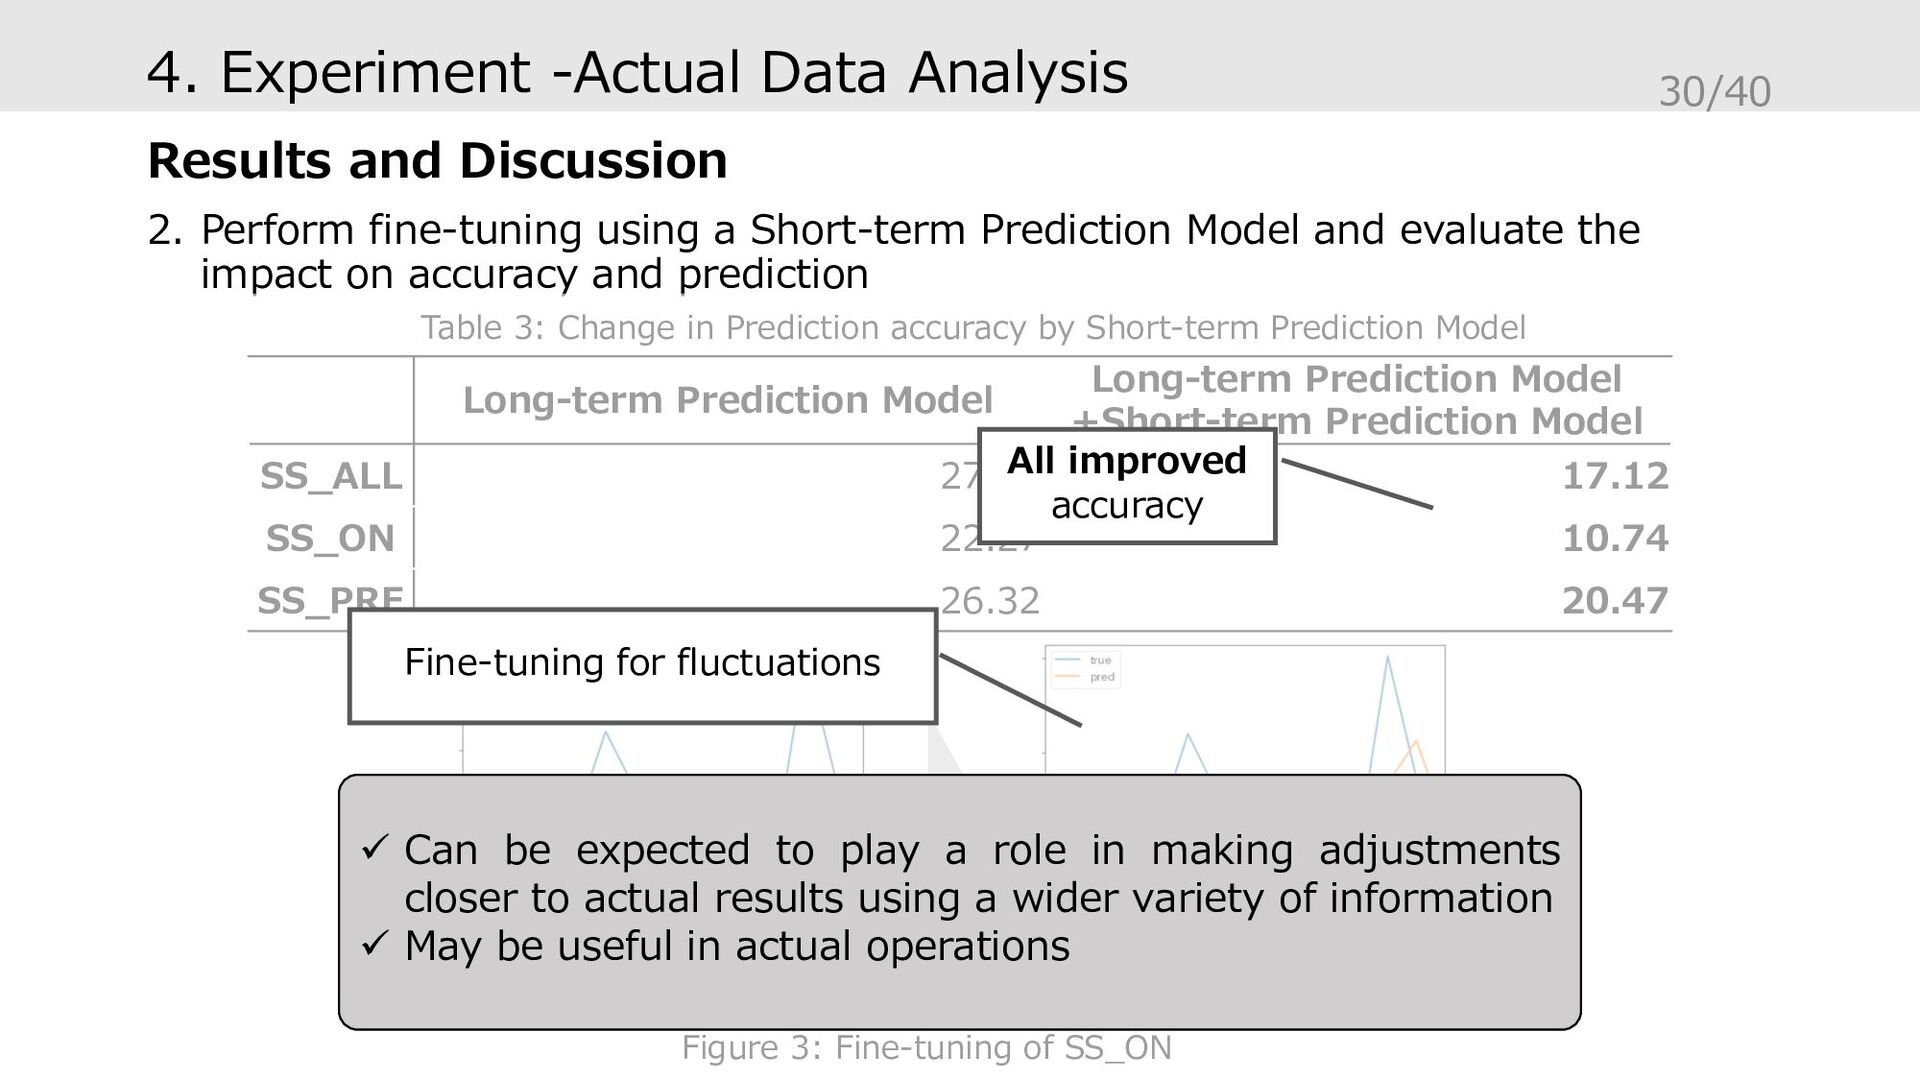
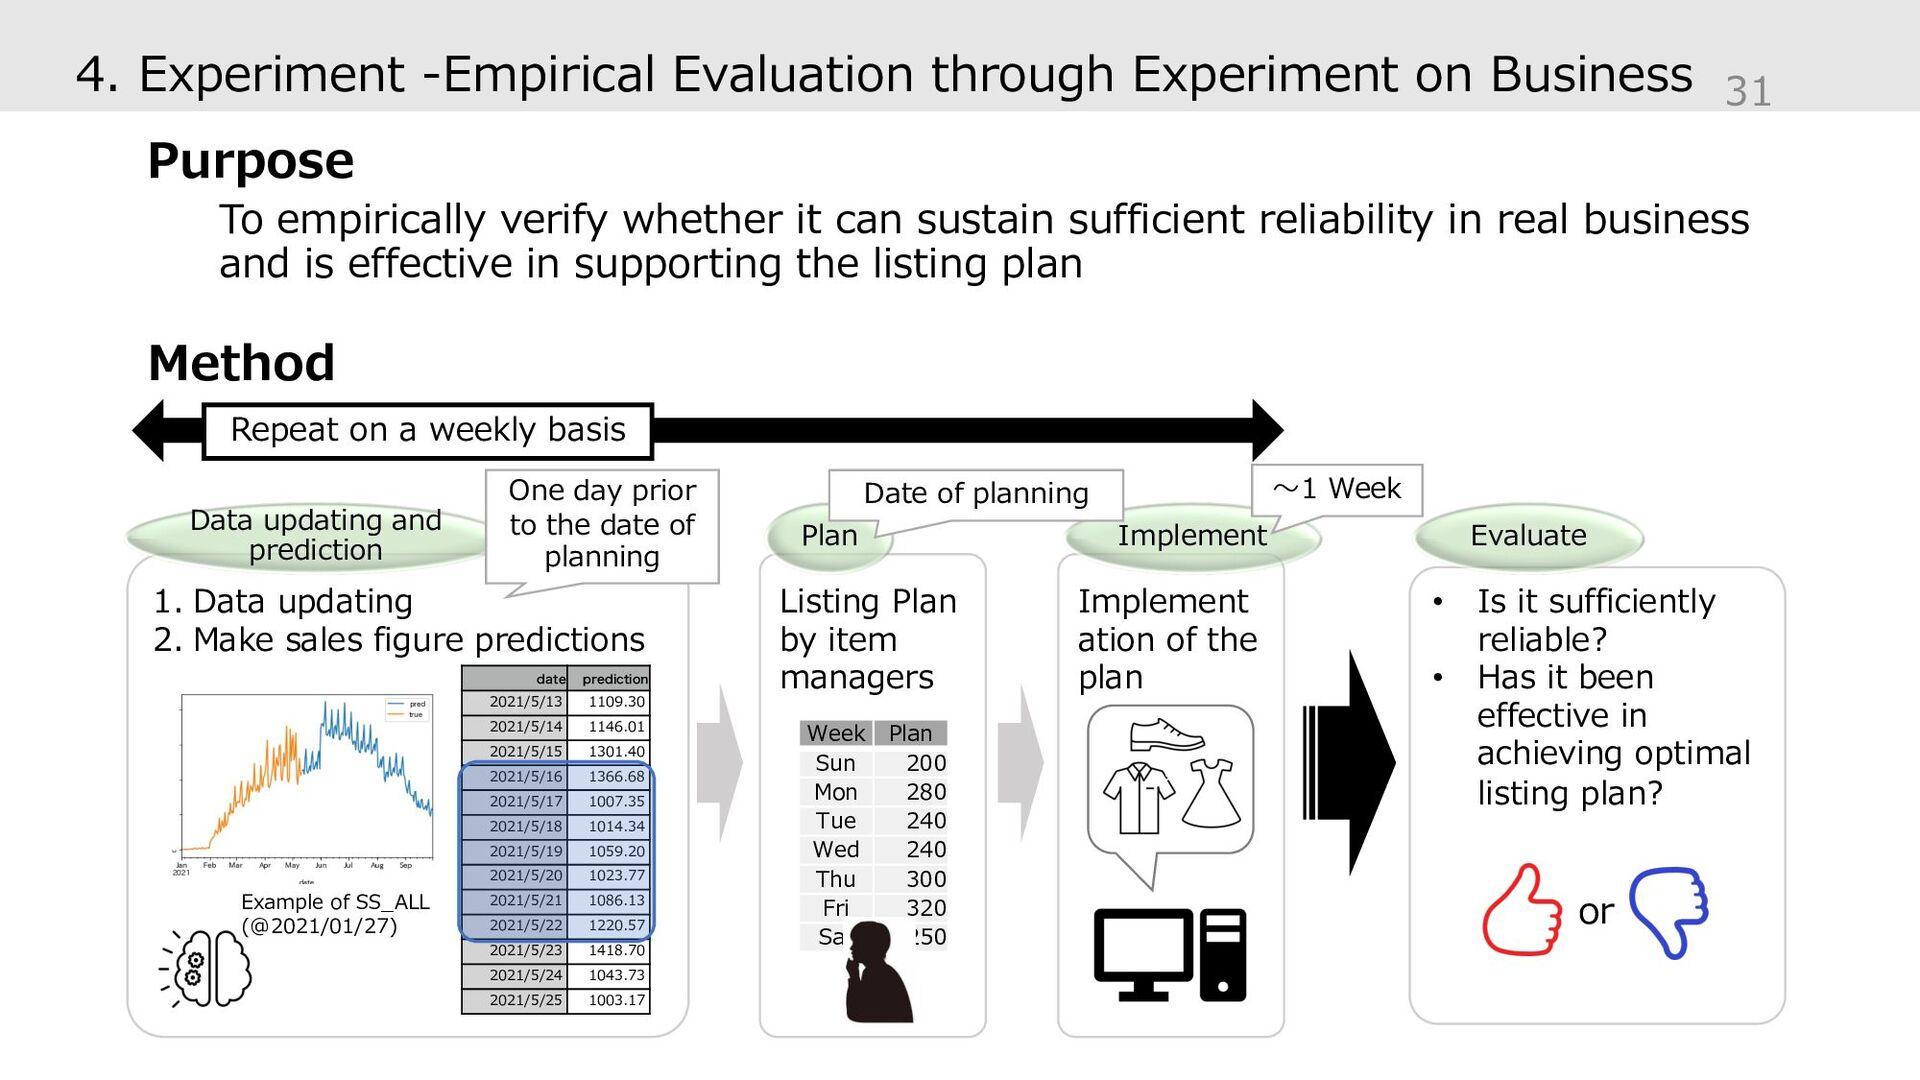
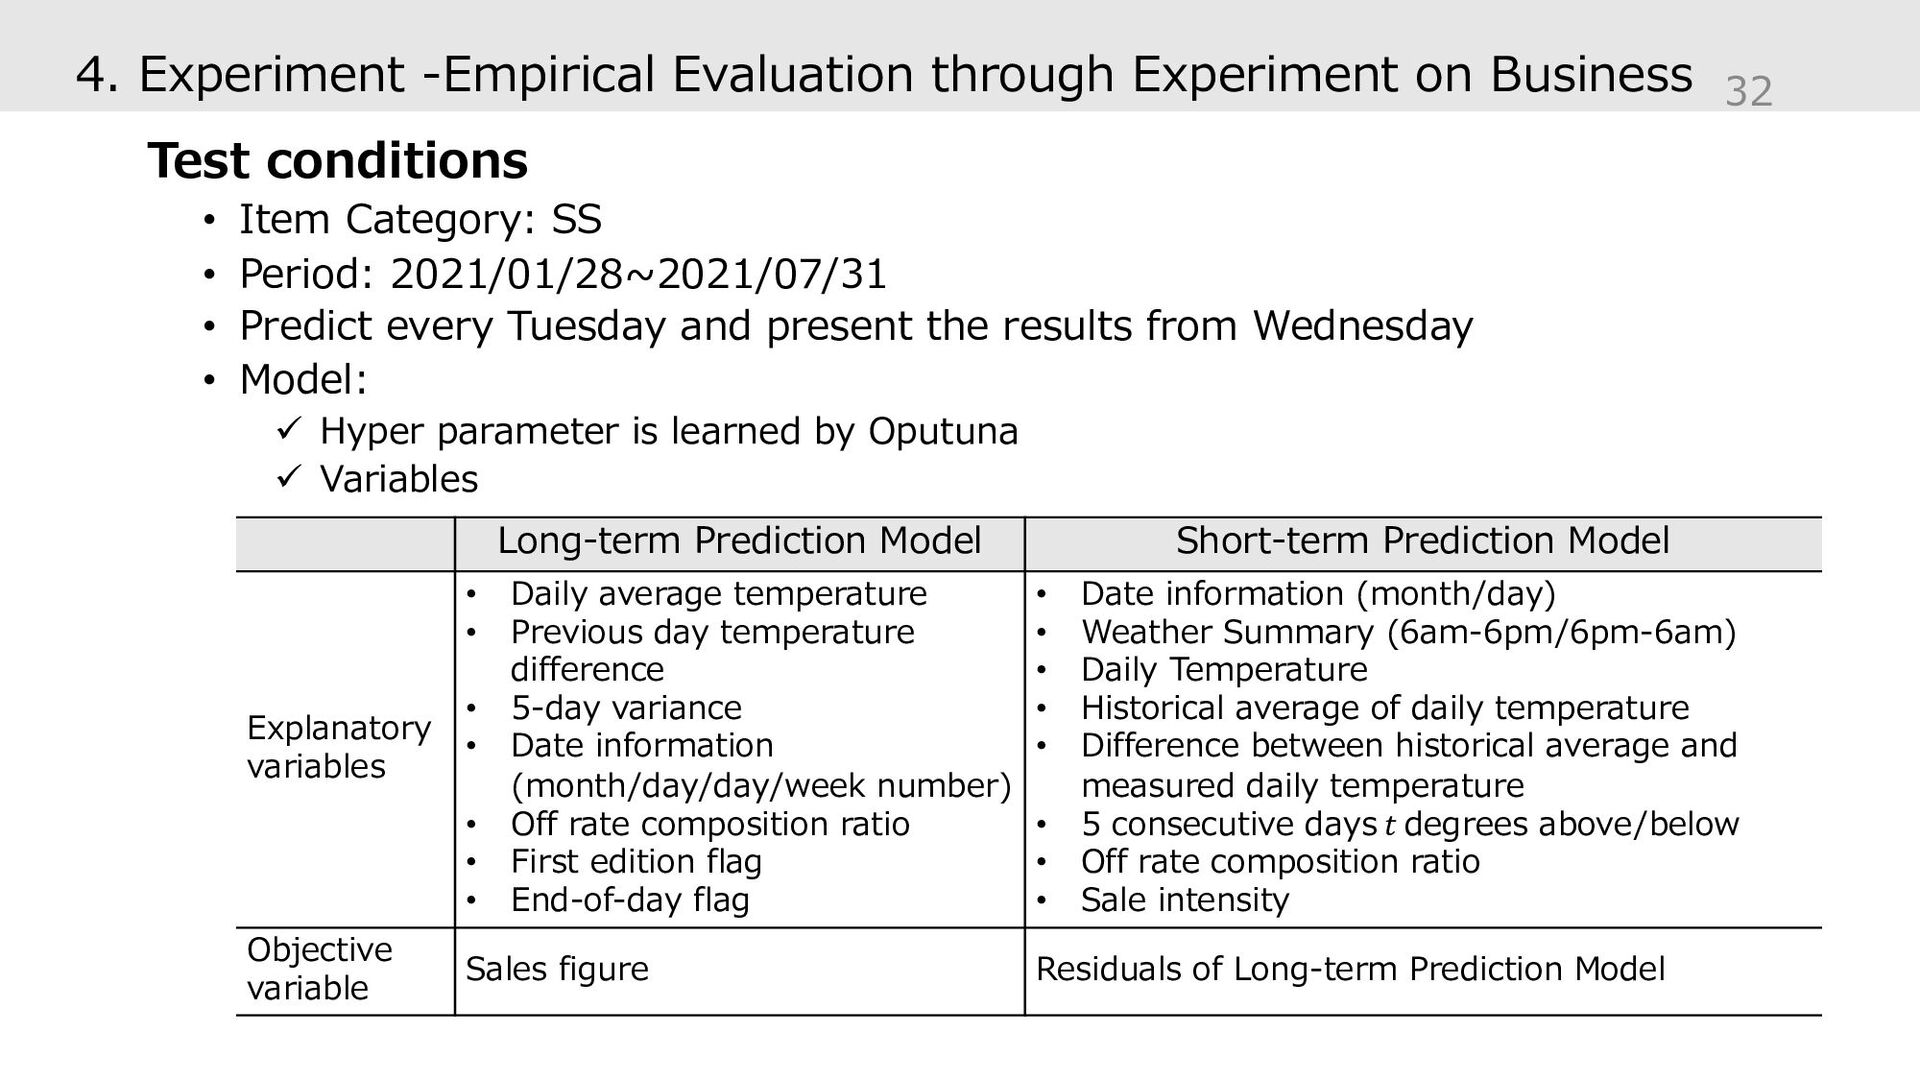
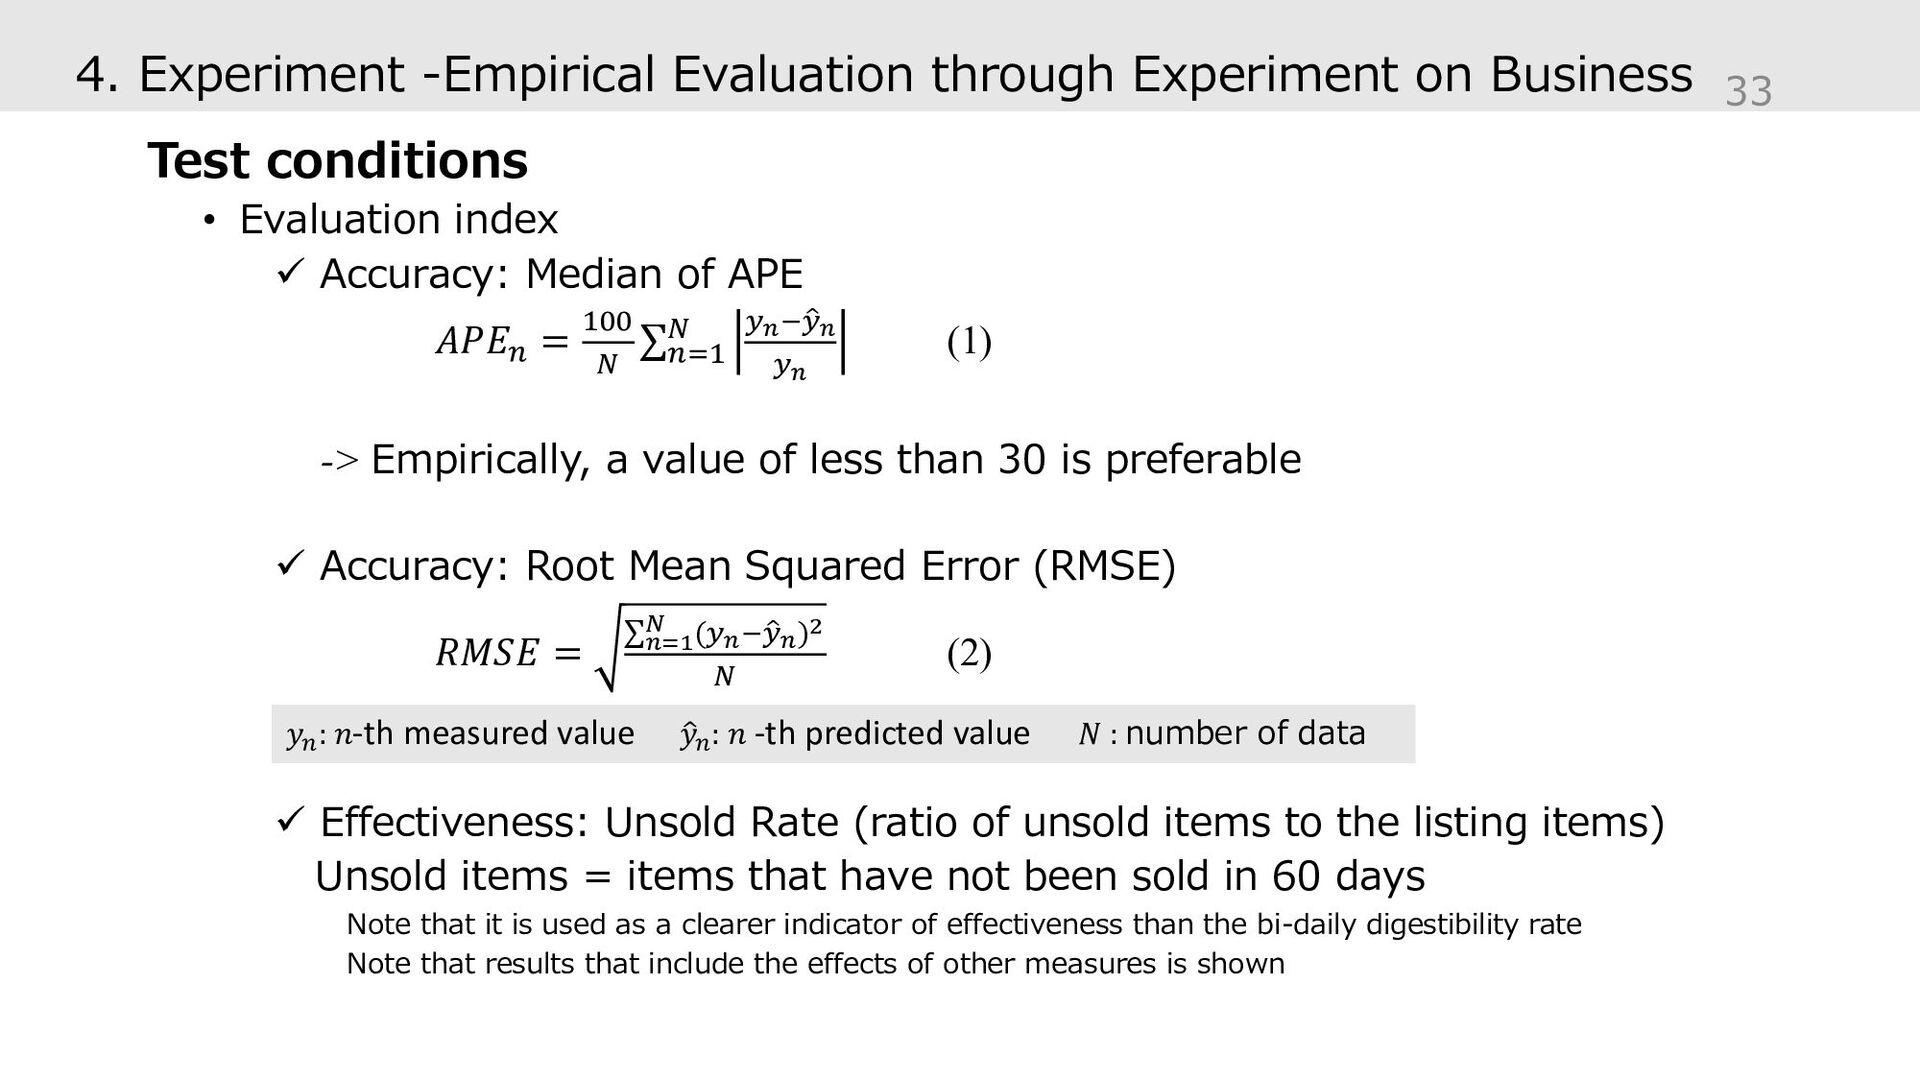
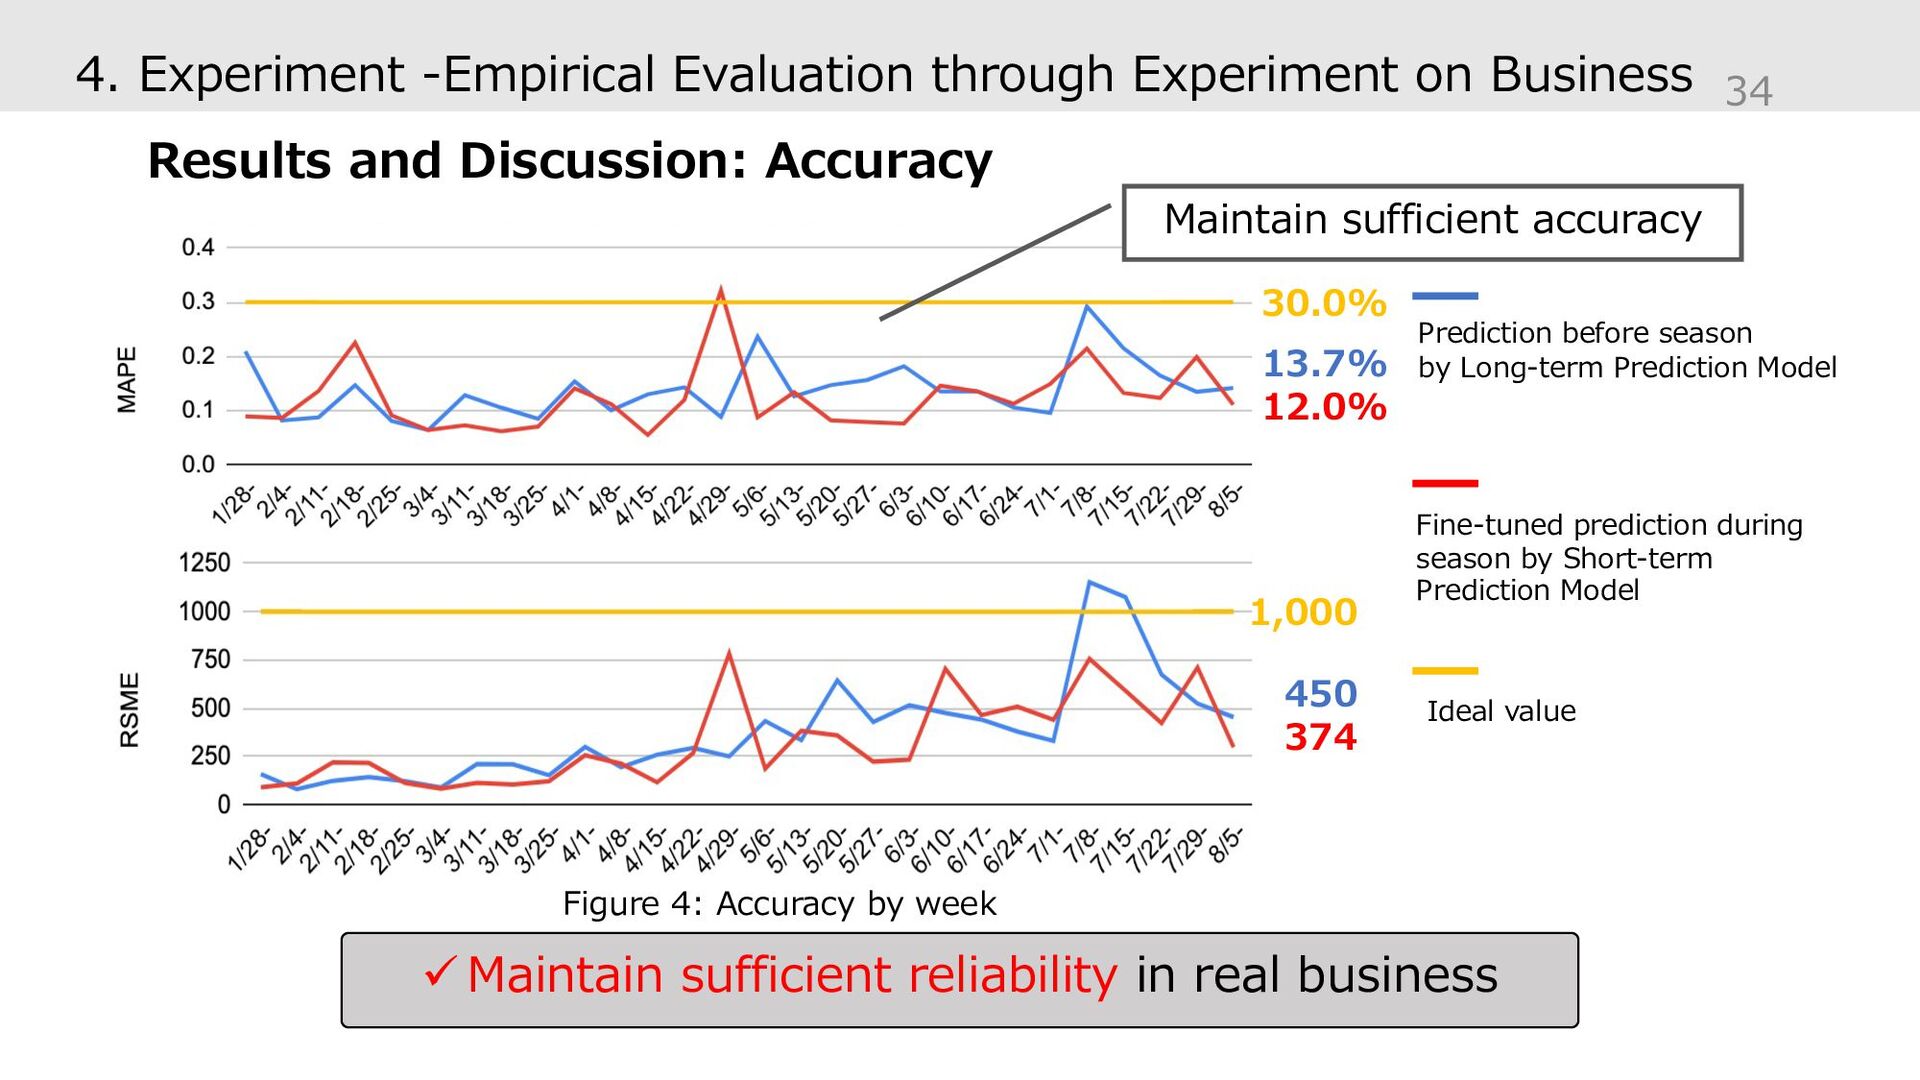
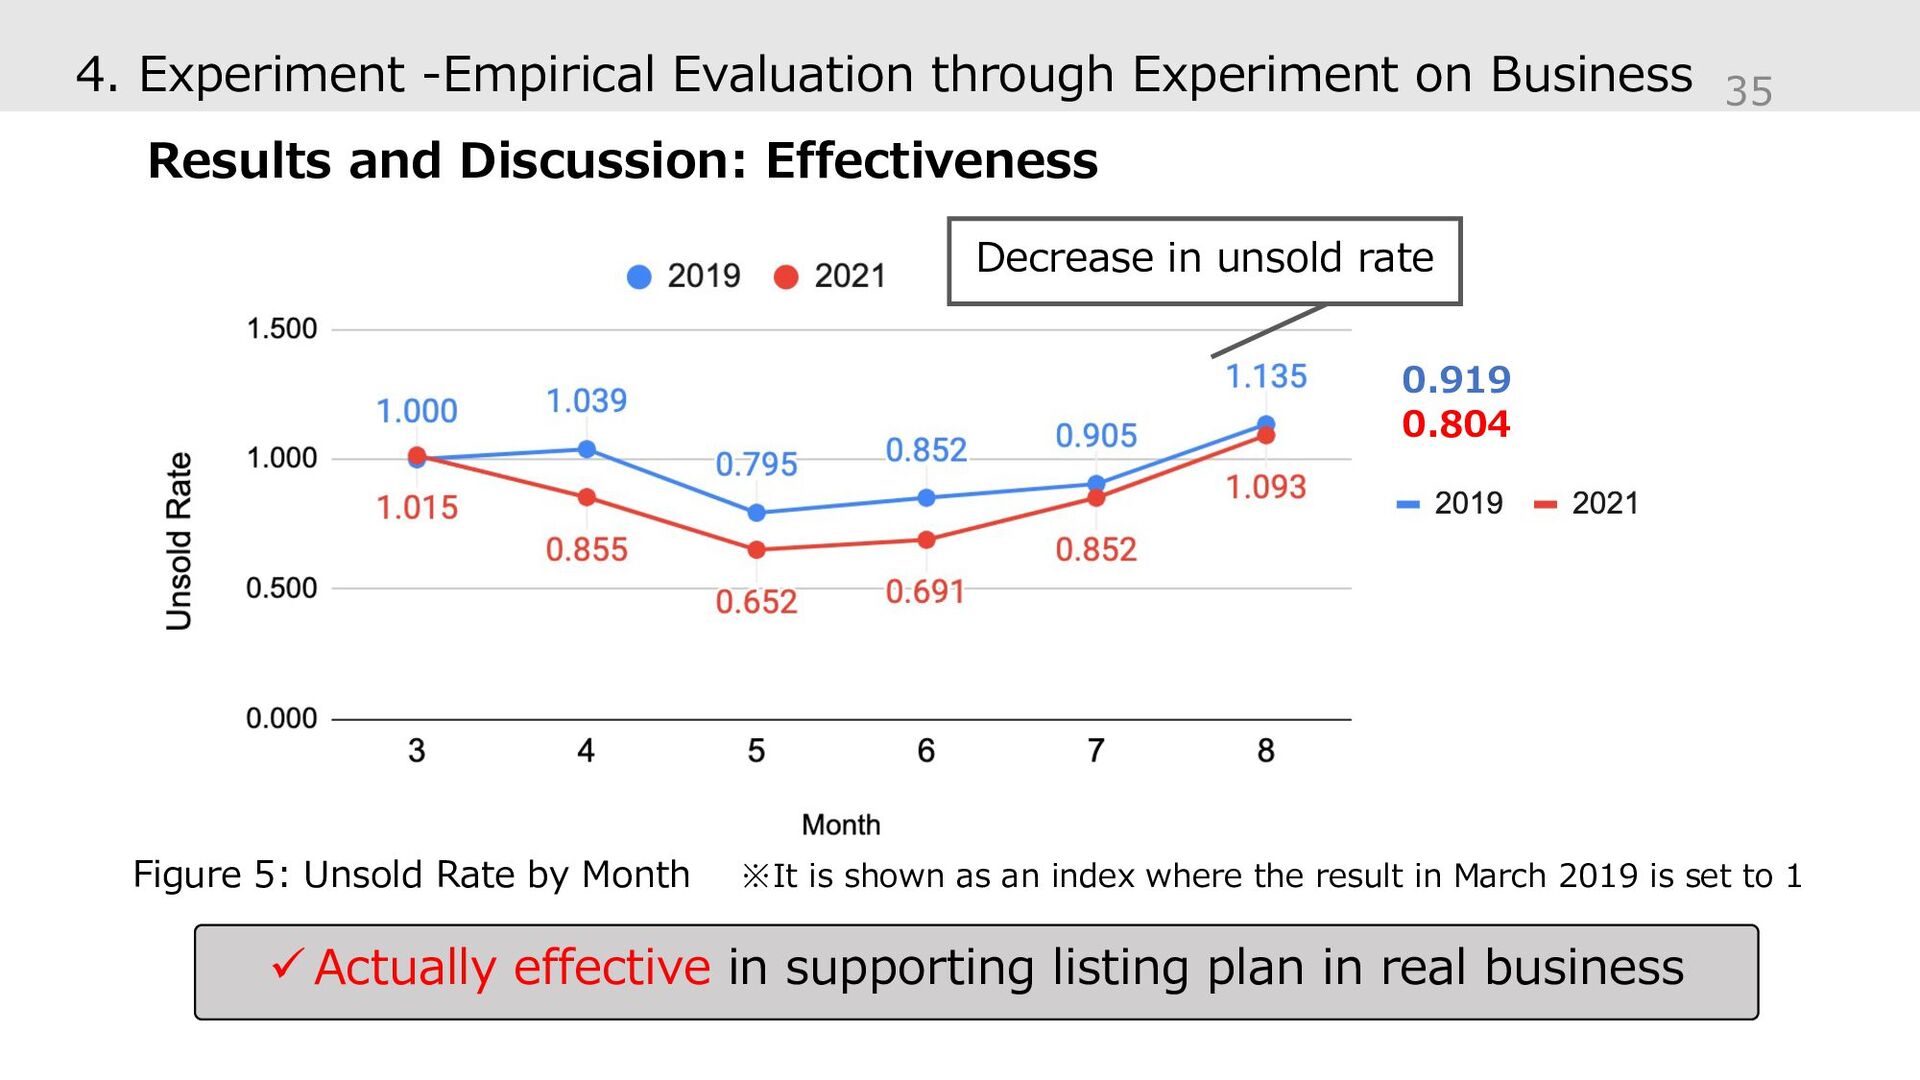
With the rapid development of information technology in recent years, it has become common for consumers to purchase various products via electric commerce (EC) sites. As a case study, this study focuses on ZOZOUSED, which is engaged in the business of buying used clothes from users, and reselling them as second-hand goods. From the perspective of inventory and management costs, it is desirable for items to be sold as soon as possible after they are listed on EC sites, and the number of listed items has been conventionally controlled, depending on the experience of item managers. However, owing to the subjective assessment of item managers, unnecessary price reductions for sales promotion of items, or opportunity losses triggered by an excessive number of listed items, may occur. For reasonable item management, the demand prediction for items by customers is a crucial task required to develop the optimal listing plan that balances supply and demand. Therefore, this study proposes a forecasting method of sales figures for the actual operation of listing second-hand goods, which comprises two-stage models: the first model is a prior seasonal long-term prediction of sales figures for each item group based on seasonal similarity, and the second model is a short-term fine-tuning prediction for daily operation via residual predictions with recent data. Furthermore, we apply the proposed model to the actual data of past sales figures accumulated in ZOZOUSED, and analyze the obtained results to demonstrate the usefulness of the proposed method. In addition, we empirically demonstrate the effectiveness of the proposed method by designing and performing an empirical experiment on an actual business by applying the output of the proposed method as a new index for determining the number of new items to be listed.

FuyuSaito

January 29, 2022
Tweet

Other Decks in Technology

Transcript

  1. Machine Learning for Demand Prediction of Seasonal Second-hand Fashion Items

    Based on Prior and Fine-tuning Prediction Models 2021 IEEE 12th International Workshop on Computational Intelligence and Applications Waseda University *Fuyu Saito Sophia University Haruka Yamashita ZOZO, Inc. Hokuto Sasaki Waseda University Masayuki Goto
  2. Outline 1. Introduction 2. Proposal Conception 3. Proposed Method 4.

    Experiment 1. Actual Data Analysis 2. Empirical Evaluation through Experiment on Business 5. Conclusion and Future Tasks 1
  3. 1. Introduction • Development of EC sites and flea market

    apps that handle a variety of products • Focus on SDGs • Increased time at home due to the COVID-19 pandemic, and more people are organizing and reselling unwanted items around the house • Lightweight and easy to transport • The tendency to believe that old is unique and valuable 2 Diversification of second-hand goods distribution channels Expansion of the reuse market Remarkable revitalization of the second-hand fashion item market
  4. Subject of Research Second-hand fashion EC site ZOZOUSED Business Model

    Accumulation and utilization of log data 1. Introduction 3 T-shirt A $50 T-shirt A $50 Purchase from customers Listing Sold T-shirt A $50 T-shirt A $50
  5. In the fashion industry, seasonal items that show characteristic fluctuations

    in demand are important • A group of items for which demand increases in each of the Spring/Summer and Autumn/Winter seasons are set up • Their list and sale are managed independently ≈ ≈ 1. Introduction 4 Fig 1. Sales Figures in One Season in 2020
  6. 1. Introduction Item categories and how they are listed and

    sold 5/40 Category Year-round items Seasonal items Spring/Summer(SS) Autumn/Winter(AW) Characteristics Sells all year round Sold in February to September Sold in August to April Example • Jeans • Sweatshirts • Accessories ALL: T-shirt ON: Tank Top PRE: Cardigan ALL: Vest ON: Down PRE: Jacket How to list and sell Sell the item immediately after appraisal Make it ready for listing and stock it -> Design and execute a selling plan when the target period approaches sale 1 2 3 4 5 6 … month sale 1 2 3 4 5 6 7 8 9 10 11…month sale 1 2 3 4 5 6 7 8 9 10 11…month Divided into ALL/ON/PRE according to the strength of seasonality Subject of research
  7. 1. Introduction Trade-offs influenced by the way of listing Problem

    Setting Strategically listing seasonal items in line with demand 6 month sale Excessive listings early in the season -> Sold out/out of stock -> Decline in the attractiveness of the EC site and customer satisfaction Hesitate to exhibit -> Inventory in the warehouse misses its selling time -> Large amounts of products remain unsold
  8. 1. Introduction Conventional Method Stocked after purchase, and during the

    season, planning and sales activities are conducted in two stages based on empirical rules 7 Humanistic prediction based on the experience and know-how of the person in charge Purchase Inventory • Check sales status and predict fluctuations at the daily operation • Fine-tune listing plan • Predict and project demand for the entire season • Create a long-term macro plan Before Target Season During Target Season Number of inventory Annual weather Annual sales time sale Current Inventory Actual Weather Recent sales time sale UP︕ Items are not be listed immediately after purchase, but stocked until a suitable target season Planning and conduction
  9. 1. Introduction Conventional Method Stocked after purchase, and during the

    season, planning and sales activities are conducted in two stages based on empirical rules Problem: Humanistic prediction lacks objectivity, and trade-offs are unresolved Research Purpose Accurate seasonal product exhibit planning based on more quantitative decisions Consider building a demand predicting model to make it feasible. 8 time sale Excessive listings Hesitate to exhibit mistake Result Target season Humanistic prediction Purchase Inventory Planning and conduction
  10. Y Y 2. Proposal Conception Problem Setting Strategically listing seasonal

    items in line with demand Research Purpose Accurate seasonal product exhibit planning based on more quantitative decisions What is Desired 1. Fast and accurate prediction while considering the influence of multiple external factors 2. To be in line with Conventional Methods 9
  11. 2. Proposal Conception What is desired 1. Fast and accurate

    prediction while considering the influence of multiple external factors • The demand for seasonal items is greatly affected by external factors such as weather information • Adequate reliability is required for practical applications Applying Light GBM[5] 10 • Ensemble learning by gradient boosting of decision trees • Capable of considering many features, high accuracy, and low computational cost Devices to reduce processing speed GOSS︓ Reduce the amount of data EFB︓ Reduce the number of features Boosting [5] Ke, Guolin, et al. "Lightgbm: A highly efficient gradient boosting decision tree." Advances in neural information processing systems 30 (2017): 3146-3154. Decision trees temperature windy humid A B C D
  12. 2. Proposal Conception What is Desired 2. To be in

    line with Conventional Methods In real business, the following are likely to exist • Information not available at the time of prediction • Implementation of measures that have not been implemented in the past Difficult to predict complete coverage of external factors ->Very risky to link to automation of business behavior • A model that aims to improve the quality of work through collaboration between models and humans • Item managers use prediction results as quantitative indicators in the field, make data-driven decisions. 11
  13. 3. Proposed Method What is Desired 2. To be in

    line with Conventional Methods Listings are planned in two stages by the item manager Proposed Method: A two-stage demand prediction model 12 Humanistic prediction Before Target Season During Target Season UP︕ time sale time sale Sales prediction for the target date Rough prediction Fine-tuning based on new information Season-wide Long-term Prediction Model In-season Short-term Prediction Model Purchase Inventory Planning and conduction Items are not be listed immediately after purchase, but stocked until a suitable target season
  14. Sales prediction for the target date Rough prediction Fine-tuning based

    on new information Season-wide Long-term Prediction Model In-season Short-term Prediction Model Proposed Method: A two-stage demand prediction model that combines long-term and short-term predictions 3. Proposed Method l 13 Roughly predict the target season Information before the season Sales Before Target Season During Target Season Number of inventory Annual weather Annual sales
  15. Sales prediction for the target date Rough prediction Fine-tuning based

    on new information Season-wide Long-term Prediction Model In-season Short-term Prediction Model Proposed Method: A two-stage demand prediction model that combines long-term and short-term predictions 3. Proposed Method l 14 Actual sales figures Residual Roughly predict the target season Information during the season Find residuals Accumulate new information Current Inventory Actual Weather Recent sales Before Target Season During Target Season
  16. Sales prediction for the target date Rough prediction Fine-tuning based

    on new information Season-wide Long-term Prediction Model In-season Short-term Prediction Model 3. Proposed Method l Proposed Method: A two-stage demand prediction model that combines long-term and short-term predictions 15 Residual prediction Residual Before Target Season During Target Season Information during the season Current Inventory Actual Weather Recent sales
  17. Sales prediction for the target date Rough prediction Fine-tuning based

    on new information Season-wide Long-term Prediction Model In-season Short-term Prediction Model 3. Proposed Method l Proposed Method: A two-stage demand prediction model that combines long-term and short-term predictions 16 Sales figures prediction Actual sales figures Roughly predict the target season Residual prediction Add up Before Target Season During Target Season
  18. Sales prediction for the target date Rough prediction Fine-tuning based

    on new information Season-wide Long-term Prediction Model In-season Short-term Prediction Model 3. Proposed Method l Proposed Method: A two-stage demand prediction model that combines long-term and short-term predictions 17 Expected role in actual operation To be able to grasp the general trend and to provide a clue for designing a general listing plan before the season Rough exhibit plan time sales Peak Last Early Before Target Season During Target Season Before Target Season
  19. Sales prediction for the target date Rough prediction Fine-tuning based

    on new information Season-wide Long-term Prediction Model In-season Short-term Prediction Model Fine-tuning the listing plan time sales Proposed Method: A two-stage demand prediction model that combines long-term and short-term predictions Expected role in actual operation To be able to adjust the prediction to more realistic sales figures by using a wider variety of information 3. Proposed Method l 18 UP︕ Add up Before Target Season During Target Season During Target Season
  20. 3. Proposed Method The significance of the two-step process 19

    2. Additive model of long-term and short-term predictions • Improved interpretability • Improved accuracy and reliability 1. Sufficiently meets the requirements of item managers who use the model in the field Enable the smooth introduction with less burden ︕ Temperature Recent weather
  21. 4. Experiment -Actual Data Analysis Purpose 1. Long term Prediction

    Model for understanding general trends and designing pre- season listing plans 2. Short-term Prediction Model that uses a wider variety of information to fine-tune the forecast to a more realistic sales figure Do these models play a role and are they useful in practice? Content 1. Predict the target season using a Long-term Prediction Model, compare the accuracy with other methods, and observe the results 2. Perform fine-tuning using a Short-term Prediction Model and evaluate the impact on accuracy and prediction Analysis Conditions • Evaluation index Median of the Absolute percentage error (APE) 𝐴𝑃𝐸! = "## $ ∑!%" $ &!'( &! &! (1) -> Empirically, a value of less than 30 is preferable 20 𝑦!: 𝑛-th measured value ) 𝑦!: 𝑛 -th predicted value 𝑁 : number of data
  22. 4. Experiment -Actual Data Analysis Analysis Conditions • Sales history

    data (from ZOZO, Inc.) Period: Data with a purchase date of 2015/12/01~2020/11/15 (Target Season of SS: February ~ August) Training data: Data with a sales date of 2017~2019 30% of the training data should be used as validation data Test data: Data with a sales date of 2020 Bland Class: B, C, D, E, F • Weather data (from the Japan Meteorological Agency) Content: Temperature, Weather (AM/PM) Place: Tokyo Period: 2017/01/01~2020/10/31 • Stratification Item Categories (SS_ALL/SS_ON/SS_PRE) 21/40 Table1. Number of data in each layer Category Sales Figure SS_ALL 1,450,574 SS_ON 782,998 SS_PRE 203,021 Total 2,436,593 • Hyper parameter Learned by Oputuna
  23. 4. Experiment -Actual Data Analysis Analysis Conditions • Comparison method

    for Content 1 ü Multiple Regression Analysis ü Prophet [6] A method to decompose time series data, which is a mixture of various elements, into three terms: long-term trend trend, periodicity, and response to events 𝑦 𝑡 = 𝑔 𝑡 + 𝑠 𝑡 + ℎ 𝑡 + 𝜀! • Period subject to fine-tuning in Content 2 2020/8/17~2020/8/31 (the last two weeks of the target season) 22 𝑡︓time 𝑔 𝑡 ︓Trend 𝜀) ︓ 𝑡-th error 𝑠 𝑡 ︓Cyclic variation ℎ 𝑡 ︓Level of response to the event Annual cycle Temperature Variation Information: Flagged when the variance of the previous day's temperature difference over the past 7 days is 3.5 or higher Suspension Period: Flagged from August to March [6] Taylor, Sean J., and Benjamin Letham. "Forecasting at scale." The American Statistician 72.1 (2018): 37-45.
  24. 4. Experiment -Actual Data Analysis Analysis Conditions • Variables of

    Long-term Prediction Model 23/40 Variables Explanation Weather Temperature Calculate daily averages for the past three years Temperature difference of the previous day Calculate the difference of daily mean temperature from the previous day Temperature SD for the past 5 days Calculate the variance of the daily mean temperature from the target day for the past 5 days Date Month - Day - Day of week Enter as category (Light GBM function) Weekly Flag Enter as category (Light GBM function) Early flag First 3 months of sales period Endgame flag Last 3 months of sales period EC site Discount rate Calculate the off-ratio composition of the products sold (0,10,20,...,90(%)) Number of planned listing item Calculate daily averages for the past three years
  25. 4. Experiment -Actual Data Analysis Analysis Conditions • Variables of

    Short-term Prediction Model 24/40 Variables Explanation Date Month - Day - Weather Weather from 6am to 6pm Dummy variables: clear/sunny/cloudy/rainy/snowy/sleet/hail Weather from 6pm to 6am Dummy variables: clear/sunny/cloudy/rainy/snowy/sleet/hail Temperature Weather Forecast Values Historical average temperature Calculated based on data from the past three years Temperature difference between historical average and actual measurements Calculate the difference between the input values of the Long-term Prediction Model More than/under t degree for 5 consecutive days Set a flag if the condition is met(t=0,10,20) EC site Discount rate Calculate the off-ratio composition of the products sold (0,10,20,...,90(%)) Sale strength Overall intensity of all events on a 5-point scale
  26. 4. Experiment -Actual Data Analysis Results and Discussion 1. Predict

    the target season using a Long-term Prediction Model, compare the accuracy with other methods, and observe the results 25/40 Multiple Regression Analysis Prophet Light GBM SS_ALL 26.05 39.14 23.15 SS_ON 36.40 53.79 29.49 SS_PRE 53.89 58 43.35 Table 2. Prediction accuracy of Long-term Prediction Models by some machine learning algorithms Fig2. Predictions for each category constructed with Light gbm (a) SS_ALL (b) SS_ON (c) SS_PRE
  27. Table 2. Prediction accuracy of Long-term Prediction Models by some

    machine learning algorithms Multiple Regression Analysis Prophet Light GBM SS_ALL 26.05 39.14 23.15 SS_ON 36.40 53.79 29.49 SS_PRE 53.89 58 43.35 4. Experiment -Actual Data Analysis Results and Discussion 1. Predict the target season using a Long-term Prediction Model, compare the accuracy with other methods, and observe the results 26/40 (a) SS_ALL (b) SS_ON (c) SS_PRE Best and sufficient accuracy Capture the trend Fig2. Predictions for each category constructed with Light gbm
  28. Table 2. Prediction accuracy of Long-term Prediction Models by some

    machine learning algorithms Multiple Regression Analysis Prophet Light GBM SS_ALL 26.05 39.14 23.15 SS_ON 36.40 53.79 29.49 SS_PRE 53.89 58 43.35 4. Experiment -Actual Data Analysis Results and Discussion 1. Predict the target season using a Long-term Prediction Model, compare the accuracy with other methods, and observe the results 27/40 (a) 春夏_ALL (b) 春夏_ON (c) 春夏_PRE Fig2. Predictions for each category constructed with Light gbm Best and sufficient accuracy Capture the trend ü Enable to accurately capture trends. ü Can be expected to play a role as a clue in designing a rough exhibit plan before the season ü May be useful in actual operations
  29. 4. Experiment -Actual Data Analysis Results and Discussion 2. Perform

    fine-tuning using a Short-term Prediction Model and evaluate the impact on accuracy and prediction 28/40 Table 3: Change in Prediction accuracy by Short-term Prediction Model Figure 3: Fine-tuning of SS_ON Long-term Prediction Model Long-term Prediction Model +Short-term Prediction Model SS_ALL 27.14 17.12 SS_ON 22.27 10.74 SS_PRE 26.32 20.47 (a) Prediction by only long-term prediction model before fine-tuning (b) Prediction after fine-tuning by Short-term Prediction Model
  30. 4. Experiment -Actual Data Analysis Results and Discussion 2. Perform

    fine-tuning using a Short-term Prediction Model and evaluate the impact on accuracy and prediction 29/40 Long-term Prediction Model Long-term Prediction Model +Short-term Prediction Model SS_ALL 27.14 17.12 SS_ON 22.27 10.74 SS_PRE 26.32 20.47 All improved accuracy Fine-tuning for fluctuations Table 3: Change in Prediction accuracy by Short-term Prediction Model (a) Prediction by only long-term prediction model before fine-tuning (b) Prediction after fine-tuning by Short-term Prediction Model Figure 3: Fine-tuning of SS_ON
  31. Table 3: Change in Prediction accuracy by Short-term Prediction Model

    4. Experiment -Actual Data Analysis Results and Discussion 2. Perform fine-tuning using a Short-term Prediction Model and evaluate the impact on accuracy and prediction 30/40 Figure 3: Fine-tuning of SS_ON Long-term Prediction Model Long-term Prediction Model +Short-term Prediction Model SS_ALL 27.14 17.12 SS_ON 22.27 10.74 SS_PRE 26.32 20.47 (a) Forecasts by only long-term forecasts model before fine-tuning (b) Forecast after fine-tuning by short-term forecast model All improved accuracy Fine-tuning for fluctuations ü Can be expected to play a role in making adjustments closer to actual results using a wider variety of information ü May be useful in actual operations
  32. Implement ation of the plan Listing Plan by item managers

    1. Data updating 2. Make sales figure predictions 4. Experiment -Empirical Evaluation through Experiment on Business Purpose To empirically verify whether it can sustain sufficient reliability in real business and is effective in supporting the listing plan Method 31 ≈ Week Plan Sun 200 Mon 280 Tue 240 Wed 240 Thu 300 Fri 320 Sat 250 EBUF QSFEJDUJPO 2021/5/13 1109.30 2021/5/14 1146.01 2021/5/15 1301.40 2021/5/16 1366.68 2021/5/17 1007.35 2021/5/18 1014.34 2021/5/19 1059.20 2021/5/20 1023.77 2021/5/21 1086.13 2021/5/22 1220.57 2021/5/23 1418.70 2021/5/24 1043.73 2021/5/25 1003.17 Example of SS_ALL (@2021/01/27) Data updating and prediction Plan Implement One day prior to the date of planning Date of planning 〜1 Week Repeat on a weekly basis • Is it sufficiently reliable? • Has it been effective in achieving optimal listing plan? Evaluate or
  33. Test conditions • Item Category: SS • Period: 2021/01/28~2021/07/31 •

    Predict every Tuesday and present the results from Wednesday • Model: ü Hyper parameter is learned by Oputuna ü Variables 32 Long-term Prediction Model Short-term Prediction Model Explanatory variables • Daily average temperature • Previous day temperature difference • 5-day variance • Date information (month/day/day/week number) • Off rate composition ratio • First edition flag • End-of-day flag • Date information (month/day) • Weather Summary (6am-6pm/6pm-6am) • Daily Temperature • Historical average of daily temperature • Difference between historical average and measured daily temperature • 5 consecutive days 𝑡 degrees above/below • Off rate composition ratio • Sale intensity Objective variable Sales figure Residuals of Long-term Prediction Model 4. Experiment -Empirical Evaluation through Experiment on Business
  34. Test conditions • Evaluation index ü Accuracy: Median of APE

    𝐴𝑃𝐸" = #$$ % ∑"&# % '*() '* '* (1) -> Empirically, a value of less than 30 is preferable ü Accuracy: Root Mean Squared Error (RMSE) 𝑅𝑀𝑆𝐸 = ∑*+, - ('*() '*). % (2) ü Effectiveness: Unsold Rate (ratio of unsold items to the listing items) Unsold items = items that have not been sold in 60 days Note that it is used as a clearer indicator of effectiveness than the bi-daily digestibility rate Note that results that include the effects of other measures is shown 33 4. Experiment -Empirical Evaluation through Experiment on Business 𝑦! : 𝑛-th measured value ) 𝑦! : 𝑛 -th predicted value 𝑁 : number of data
  35. Results and Discussion: Accuracy 34 12.0% 13.7% 30.0% Figure 4:

    Accuracy by week 374 450 1,000 Maintain sufficient accuracy ü Maintain sufficient reliability in real business 4. Experiment -Empirical Evaluation through Experiment on Business Prediction before season by Long-term Prediction Model Fine-tuned prediction during season by Short-term Prediction Model Ideal value
  36. 0.919 0.804 Results and Discussion: Effectiveness 35 Figure 5: Unsold

    Rate by Month ※It is shown as an index where the result in March 2019 is set to 1 Decrease in unsold rate ü Actually effective in supporting listing plan in real business 4. Experiment -Empirical Evaluation through Experiment on Business
  37. 5. Conclusion and Future Tasks Conclusion • We proposed a

    model for predicting the sales figures to support the listing plan of second-hand fashion items. • We applied the proposed method to past sales history data and demonstrated its usefulness through analysis results. • We designed and conducted a demonstration experiment and empirically demonstrated the effectiveness of the proposed method • We have developed a useful model for ZOZOUSED to support the listing plan Future Tasks • Continuation of the verification test for AW items • Further improvement of accuracy • Improve the model to be more flexible • Consideration of improvements to the model to make it more interpretable 36
  38. Appendix [1] M.Ninohira, K.Mikawa, and M.Goto, “Selling prices prediction modelconstruction

    of second-hand fashion items based on sales history data,”Information Processing Society of Japan, vol. 40, no. 6, pp. 1151–1161,2019. [2] S. Kanazawa, T. Yang, and M. Goto, “Analytical model of exhibitionprice change effects on second-hand fashion electronic commerce sites,”Journal of the Japan Society for Management Information, vol. 30, no. 1,pp. 47–64, 2021. [3] I. Kuwata, T. Sugisaki, K. Mikawa, and M. Goto, “An estimation modelof exhibits price for second-hand fashion items based on sales historydata,”The 33rd Annual Conference of the Japanese Society for ArtificialIntelligence, 2019. [4] I. Kuwata, S. Kanazawa, K. Mikawa, and M. Goto, “A decision modelof sales period on list price for second-hand fashion items basedon machine learning approach,”The 34rd Annual Conference of theJapanese Society for Artificial Intelligence, 2020 [5] Ke, Guolin, et al. "Lightgbm: A highly efficient gradient boosting decision tree." Advances in neural information processing systems 30 (2017): 3146-3154. [6] S. J. Taylor, B. Letham, “Forecasting at scale,”Peer J Preprints, Vol. 5, pp. 1–25, 2017. [7] Lloyd S. Shapley. A Value for n-person Games. In Contributions to the Theory of Games, volume II, by H.W. Kuhn and A.W. Tucker, editors. Annals of Mathematical Studies v. 28, pp. 307-317. Princeton University Press. 37/40