Upgrade to Pro — share decks privately, control downloads, hide ads and more …

Self Storage Initial Business Analysis

Gabriel Martinez
March 24, 2014
110

Self Storage Initial Business Analysis

Client wanted an initial analysis of the self storage market in Bakersfield, CA, and financial projections.

Gabriel Martinez

March 24, 2014
Tweet

Transcript

  1. CleanCrowd, LLC PO Box 322 • Wilder, VT 05088 www.CleanCrowd.com

    • 802.242.1293 INITIAL PROJECT REPORT July 18, 2013 Title: Market and Financial Feasibility Analysis for Mini-Storage Facility Goals: The goal of this Initial Project Report is to analyze the feasibility of opening and operating a Mini-Storage business in the defined target market. Hereunder, we have endeavored to a) determine the market price and value of storage space in the business’ area, b) estimate the minimum price at which the business can be a going concern, c) evaluate the sensitivity of price and occupancy in the financial model, and then d) analyze the overall feasibility of the business. Additionally, we have included an analysis of the overall investment return based on the provided risk-averse profile and desired operating conditions. Project Plan: Work completed and reported hereunder covers the first two phases of the project: Phase 1 – Market Survey and Evaluation During this phase we studied the general business concept and surveyed all of the similar businesses within a 12 mile radius from the planned facility (“Competitors”). A full and detailed inventory of the available Competitors’ price structures and additional information gathered was put together into a comprehensive survey, in order to determine the pricing, general terms and services, and other offerings throughout the market. Phase 2 – Initial Analysis and Report The following report comprises a comprehensive market and pricing analysis based on the data acquired in Phase 1. The report details the estimated minimum price to charge, potential profits, market and operational sensitivity, and the overall feasibility of the business, including recommendations and warnings. Phase 3 (Revision, Review, and Feedback) will continue after review of this report. Phase 4 (Provision of Additional Analytical Tools) may continue thereafter, if desired.
  2. CleanCrowd, LLC • PO Box 322 • Wilder, VT 05088

    • www.CleanCrowd.com • 802.242.1293 2/16 Table of Contents 1. Summary 2. Basic information 3. Market Analysis 4. Projected Financials 5. Suggested Strategy 6. Additional work 1. Summary Following is a basic financial forecast and analysis for a self-storage business located in north-western Bakersfield, California. The facility is designed for 622 self-storage rental units with sizes ranging from 5’ x 5’ to 10’ x 20’ and 119 RV Parking Spaces mostly of 12’ x 36’. Using a conservative target net occupancy of 80% and utilizing a retail price at 10% below market average, we calculate that company will produce in excess of in annual revenue once up and running. With minimized expenses, this leads to an operation that can see operating margins in excess of 40% and provide a stable and healthy cash flow with high potential for exit within 4 years with significant lingering cash flow (around ) if desired through the leasing of owned land. Circumstantially, the land ownership leads to a very low introductory cost. We have estimated as a down payment on a loan to fund the construction of the facility. There are many competitors in the market, even located next door to the target site. However the market seems to be healthy and under-saturated which indicates strong growth potential and dependable revenue.
  3. CleanCrowd, LLC • PO Box 322 • Wilder, VT 05088

    • www.CleanCrowd.com • 802.242.1293 4/16 BASIC STORAGE UNIT CALCULATIONS Storage Units SqFt/unit Qty Total Area % of Area 5x5 25 6 150 0.2% 5x10 50 47 2,350 2.4% 10x10 100 177 17,700 18.2% 10x15 150 22 3,300 3.4% 10x20 200 370 74,000 75.9% RV Storage 12x36 432 108 46,656 90.8% 12x64 768 11 8,448 9.2% Figure 2.2 Storage inventory from site plan
  4. CleanCrowd, LLC • PO Box 322 • Wilder, VT 05088

    • www.CleanCrowd.com • 802.242.1293 5/16 3. Market Analysis The goal of our Market Analysis was to determine the current average price charged to customers for storage in the area adjacent the facility target location. That price then becomes the core of the revenue projection model: we must know how much the market is paying for the product in order to reasonably predict projected revenue. In order to do calculate the average price, it was necessary to create a full landscape of direct competitors. Utilizing resources that would be open to any retail customer looking for a storage facility in the area, we determined that within a 12 mile radius of the target location there are currently 40 direct competitors. A “direct competitor” is defined as a currently existing company or location doing business with the general public providing self-storage or RV-storage services. We did not consider shipping and storing companies nor storage container companies, as their product and service offerings differ greatly from the intended function of the proposed business. Figure 3.1: Overview map of local competitors We were able to glean market prices for various sizes of self-storage offerings from 21 of the 40 identified competitors (see Appendix for full data). These were the companies which provided their prices online, and a few which required a phone call to determine pricing. Those for which we were able to determine current pricing are colored in Blue in Figures 3.1 and 3.2. For those colored green, we did not obtain their pricing data. As a side note, each competitor contacted by telephone initially requested to know whether or not we were a competitor. Upon discussion with a few people working in the market, it was determined that several competitors are actively polling the market price in order to set their own prices, and seem to do so on at least a monthly basis. This indicates that the market is competitive and any analysis of sales price needs to be conservative and aggressive relative to the market average. Additionally, we determined that there are three distinct concentrations of businesses in the various populated centers of the town. They are represented by the red circles in Figure 3.1. Concentrations of Competitors NW NE S
  5. CleanCrowd, LLC • PO Box 322 • Wilder, VT 05088

    • www.CleanCrowd.com • 802.242.1293 6/16 Figure 3.2: Closest Competitors to Target Location The resulting data from rental price polling is displayed in Figure 3.3. Therein the high, low, and average price charged for different size offerings has been charted. For example, a 10ft by 10ft rental space has a 10ft x 10ft = 100 square foot area. The high cost charged in the market for a 100 SqFt space is $0.86 per SqFt per month, or $86.00 per month. The low cost is $0.42 per SqFt, or $42.00 per month, and the average is $67.00 per month. Figure 3.3: Market Price, in $ per Square Foot of rented space for different size rentals $1.60 $1.20 $0.84 $0.86 $0.73 $0.70 $0.52 $0.51 $0.49 $0.76 $0.58 $0.40 $0.42 $0.44 $0.35 $0.36 $0.48 $0.48 $‐ $0.20 $0.40 $0.60 $0.80 $1.00 $1.20 $1.40 $1.60 $1.80 0 50 100 150 200 250 300 350 400 450 500 550 600 650 700 750 800 Market Price (per Month per SqFt) for Self‐Storage in Bakersfield, CA Average Price High Price Low Price Size in Square Feet of Rental
  6. CleanCrowd, LLC • PO Box 322 • Wilder, VT 05088

    • www.CleanCrowd.com • 802.242.1293 7/16 Main Trends Two trends of note emerged from the pricing analysis: 1) price per square foot decreases exponentially toward a base value as rental space increases, and 2) the range of prices vary wildly for the smaller sizes. The first trend (Declining Cost) is typical among any general product offering: retail cost decreases as the total volume of product sold per customer increases. One initial interpretation of this trend might be to consider consolidating the entire offering of self-storage rentals into smaller units, so as to maximize the net average price per square foot for the facility. While that idea may hold merit, it is also generally understood in the industry that smaller units have higher turnover and shorter rental times than the larger ones which greatly affects the annualized return on such units. Rental Size 5x5 5x10 5x15 10x10 10x15 10x20 10x30 10x40 20x40 Area Per Rental 25 50 75 100 150 200 300 400 800 Average Retail Price ($/sqft) $ 1.25 $ 0.84 $ 0.76 $ 0.67 $ 0.62 $ 0.52 $ 0.48 $ 0.49 $ 0.49 Average rental Time (Months) 2.5 5 7 9 10 14 18 18 18 Rentals per Year 3.4 2.0 1.5 1.2 1.1 1 1 1 1 Total Months Rentable 8.6 10.0 10.5 10.8 10.9 12 12 12 12 Occupancy (Gross) 40% 70% 85% 70% 80% 80% 80% 80% 80% Adjusted Average Price ($/sqft) $ 0.36 $ 0.49 $ 0.56 $ 0.42 $ 0.45 $ 0.42 $ 0.38 $ 0.39 $ 0.39 Figure 3.4: Calculating Adjusted Sales Values Figure 3.4 above shows the calculation of the adjusted average revenue potential for each storage size. The main adjustment comes from two factors: a) the length of rentals and b) gross occupancy. In the case of length of rentals, smaller storage spaces tend to rent for less time per customer (Average rental Time). We must attach additional time to clear, clean, administrate, re-advertise, and re-rent space. Here we assume an additional 1 month of dead time per rental turnover. As an example, if a 5x5 is rented for an average of 2.5 months per rental, we need to attach 1 month to the total time per rental, or 3.5 months. This results in the space only being rentable for 8.6 months out of the year. In the case of gross occupancy, we have made assumptions based on anecdotal evidence from within the industry to quantify the popularity of specific sizes, and their general occupancy rates. For example, at any given time, a storage facility will have 40% of their 5x5 spaces occupied. Figure 3.5: Adjusted Market Price, based on turnover and occupancy $1.25 $0.84 $0.76 $0.67 $0.62 $0.52 $0.48 $0.49 $0.49 $0.36 $0.49 $0.56 $0.42 $0.45 $0.42 $0.38 $0.39 $0.39 $‐ $0.20 $0.40 $0.60 $0.80 $1.00 $1.20 $1.40 0 50 100 150 200 250 300 350 400 450 500 550 600 650 700 750 800 Adjusted Market Price (per Month per SqFt) for Self‐Storage in Bakersfield, CA Average Price Adjusted Average Price
  7. CleanCrowd, LLC • PO Box 322 • Wilder, VT 05088

    • www.CleanCrowd.com • 802.242.1293 8/16 The net occupancy seen in the Projected Financials is a weighted average of the individual estimated occupancy rates. Figure 3.5 above shows the relationship between the base average Market Price for space and the adjusted average price. From the adjustment, we can see that 5x5 units will generally make less money than more popular sizes for the reasons indicated above. However, it is still a good idea to have a few available in the space as advertising vehicles. Because the size is so small, the net price is quite low (~$30/month). This can be a valuable tool in print advertising (stating that “Prices starting at….”) and as an initiative to get customers to visit the site. We suspect that a frugal customer looking for the cheapest price will be drawn to the 5x5, but upon inspection will realize that there is very little that can fit into a space. That customer then becomes a target for upselling to larger sizes. The second trend (Price Variance) can be further quantified by the large Standard Deviation from the average (up to 22%). Further, the Price Variance indicates a high level of competition and under-saturation in the market. According to several sources including the Self Storage Assocation Report from 2009 (see Appendix), markets with average net occupancies around 70% indicate market saturation, meaning that there is much more space available for rent than the market demands. In that case, prices will dramatically drop: however, the market should see this drop across all competitors. In the case of the market relative to the target location, we do not see a consistently low retail price. Rather, we see that while some very cheap alternatives exist, competitors are staying in business with much higher prices. This indicates that the market is healthy and that demand continues to exceed supply. The downside of the turbulent pricing scenario is also an opportunity that should not be missed. Namely, to operate in this space a business owner should regularly maintain a comprehensive understanding of the current market price and dynamically adjust prices to beat the market. Doing so will enhance the ability to maintain high occupancy rates. Additional Considerations It is impossible to pre-determine the exact needs of the market and match the business’ design to meet it. The best course of action is to enter the market with a better than average rate, and then adjust over a period of time. In this analysis we have assumed that it will take up to 6 months to vet the market and reach full occupancy. However, there are a couple of research items which were outside of the scope of this report that may be of interest: 1) Determining real market saturation, and 2) Developing pricing tools. With regard to determining real market saturation, we would complete the market pricing analysis with data concerning occupancy rates in order to compare the market saturation to the guidelines prepared by the Self Storage Association. With regard to developing market tools, we are able to develop web-applications that would permit you to regularly keep track of the market price and dynamically adjust, in order to maximize occupancy and margin based on the market demand and supply. Both items are potentially interesting, but would require much additional work.
  8. CleanCrowd, LLC • PO Box 322 • Wilder, VT 05088

    • www.CleanCrowd.com • 802.242.1293 10/16 Line 3: the first 6 -8 months of the project would see no revenue due to build out so there would be no revenue in 2013, then the first 6 months of operation in 2014 would be a ramp up to the target occupancy so we calculated a net net occupancy for the first full year of operation; Line 4-10: the rental spaces used to calculate should be those in the site plan drawing, and that each size of rental has a different average occupancy rate. This is based on anecdotal evidence gathered from talking with several facility operators and the Storage Association Report (see Appendix). As mentioned in the Market Analysis, the smaller rentals tend to have higher turnover and periods of transition resulting in net lower occupancy. Also we assumed a 3% annual increase in revenue to approximately match the Consumer Price Index average for the last decade; Line 11: late fees can add around 10% to the total rental cost. This is based on anecdotal evidence and operation research on the web for this type of business; Line 12: incidental fees can add around 5% or more (see Additional Revenue Resources). With targeted traffic at the site, every opportunity to sell additional merchandise should be employed; Expenses Line 17: four contracted workers would be used such that the Manager would be the only one working full time and the others overlapped part time positions and be paid as independent contractors. This avoids the extra cost of insurance, unemployment, taxes, etc. The manager and two part time workers would be able to sufficiently run the entire facility, with the last part time position filled for maintenance and cleaning Full calculations for the employee line item can be seen in the projected financials spreadsheet attached in the Appendix; Line 18: the land currently owned which is the target site, would be leased to the operating business for , increasing at 3% annually; Line 19: the total cost for construction of the facility would be under and since the land is owned with a high level of equity, would be able to get a very reasonable equity loan or line of credit to fund the build-out. We used the basic terms of which results in a monthly payment just under For a breakdown of the estimated costs to build, see Analysis below; Line 20: a budget for advertising will be important to garnering business. It seems that most advertising in this arena is online, so purchasing Google Ad words, pay-per-click, SEO, etc should be employed, as well as up to date and appropriate signage on the property; Line 21: some legal help will be needed during the setup of the business structure and formulating the rental agreements, etc. Legal costs should decrease once the business is setup. Line 22: some outside maintenance and landscaping will be necessary; Line 23: some contracted work, such as HVAC work, electrical work, etc. will undoubtedly occur; Line 24: there are several software packages available for maintaining and operating storage facilities. The best are fully web based and require a monthly payment which is quite low; Line 25: utilities will be minimal, mostly for lights and gate operation. We did not include the Manager’s residence, assuming that they will be responsible for that cost.
  9. CleanCrowd, LLC • PO Box 322 • Wilder, VT 05088

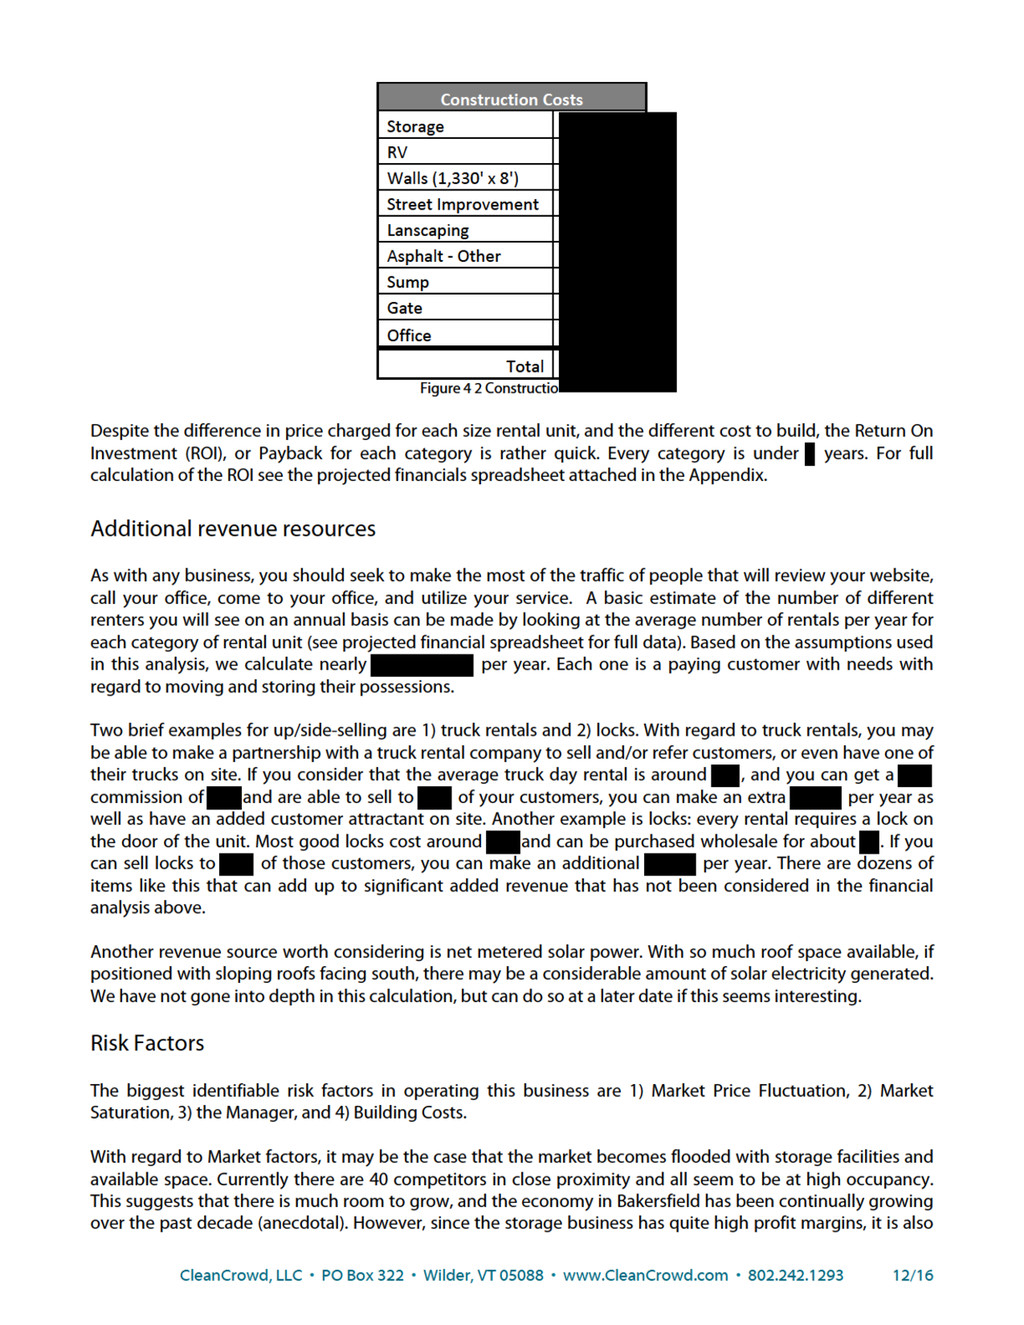
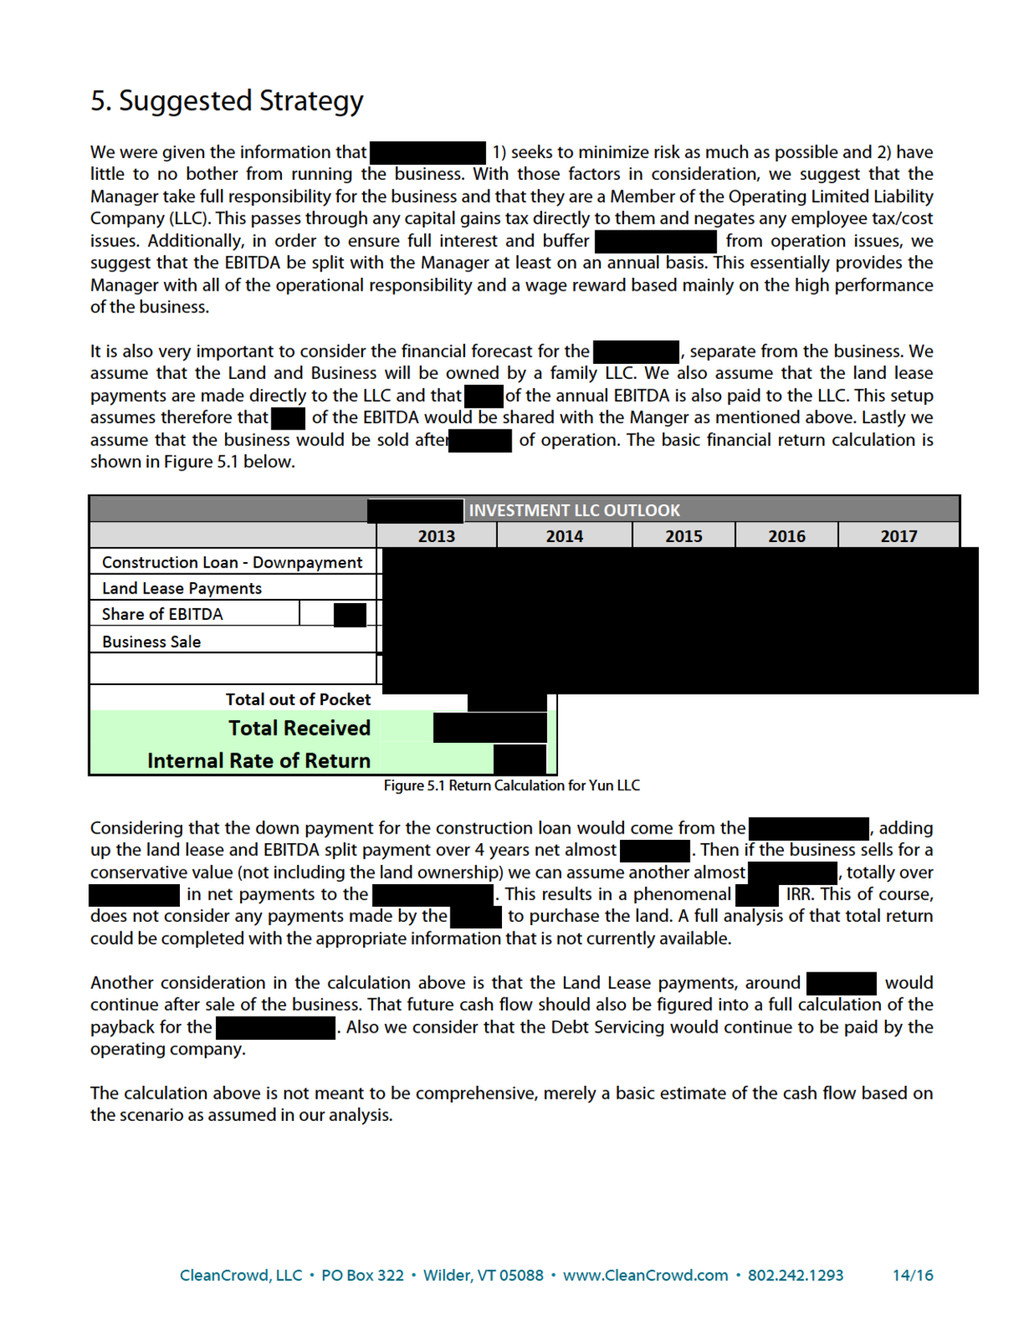
    • www.CleanCrowd.com • 802.242.1293 11/16 Line 26: equipment includes Computers, Furniture, and Office supplies; Line 27: insurance can be kept to a minimum, but at least Liability Insurance will be necessary for the business and premises, Line 28: in order to account for anything that may have been missed, unaccounted, or underestimated we have included a contingency at the rate of of the rest of the expenses; Totals Line 32-33: EBITDA means Earnings Before Interest, Taxes, Depreciation, or Amortization and represents the Annual and Monthly Gross Profit on lines 32 and 33 respectively; Line 34: the Cash Flow is a tally of the annually accumulated Gross Profits of the business; Line 36: the Operating Margin is the Gross Profit as a percentage of Gross Revenues; Line 37: if the business is operating regularly and with a strong operating history and future, one way to value the company is as a multiple of EBITDA, which is essentially assuming that the company will produce the same Gross Profit for the multiple of years. Line 38: the Present Value (PV) of Future Cash Flows is a calculation of the value now, of the EBITDA paid out over the Multiple years at a discounted rate of . This is a more appropriate (and conservative) method for calculating the value of the business at any given time because it allows for discounting using a purchasers Weighted Average Cost of Capital and associated risk factors. Analysis The main factors driving the revenue of the company are 1) the Price charged for space, and 2) the Occupancy. The two are not exclusive and are inextricably linked. If one increases Price more than the market will bear, the Occupancy will suffer, and oppositely, if one decreases Price lower than the market, Occupancy should increase. There is no way to know beforehand how the average market price will fluctuate, however it will be very important to monitor the market price on an on-going basis. As mentioned in the Market Analysis above, although the smaller rentals bring in more per square foot, their net occupancy is low and therefore less favorable than the larger footprints. The largest costs for operation are 1) Labor, 2) Debt Servicing, and 3) Land Leasing. There may be some opportunity to decrease the Land Leasing, depending on the temperance of and what they expect to receive from the use of the land. Additionally, depending on the terms of the loan the Debt Servicing component may change considerably. With respect to the total cost to build, we searched for average costs to build this type of facility an spoke with a few business owners. Based on that evidence, we assumed an average cost of per Square Foot to build storage rental space and per Square Foot to build RV Storage. The additional components were estimated based on prices provided by the Client and verification through research and discussions with contractors. Figure 4.2 below shows the assumed construction costs.
  10. CleanCrowd, LLC • PO Box 322 • Wilder, VT 05088

    • www.CleanCrowd.com • 802.242.1293 13/16 very attractive to investors and business owners. It is not inconceivable that within 8-10 years the market will become over saturated and profits will recede. If you are averse to that risk, it would be therefore in your best interest to get the company up and running and sell it within a few years (as suggested above). With regard to the Manger, since it was expressed that the does not want to expend much energy in running the business, it is therefore paramount to find a trusted, honest, and reputable Manager that will be capable of dealing with all aspects of the business in its entirety. Such people are rare, and there is some risk that they may embezzle, etc. To deal with any potential issues in that regard, we suggest to have an open and honest dialog with the Manager and strongly suggest to use an outside independent accountant or service. That way the financial reporting cannot be materially changed by the Manager. With regard to Building Costs, we have done our best to conservatively estimate building costs. However, we did not consult nor contract with a building contractor and therefore can not offer any dedicated accuracy to the estimated cost. Additionally contractors tend to go over budget on a regular basis. We therefore suggest that any contract with a builder be structured such that there is a ceiling to the total budget and penalties for non-performance, etc.
  11. CleanCrowd, LLC • PO Box 322 • Wilder, VT 05088

    • www.CleanCrowd.com • 802.242.1293 15/16 6. Additional work The analysis contained in this report, while quite detailed and thorough, is not exhaustively comprehensive. In order to provide additional security in the projected financials and risk factors, there are a number of projects or analyses that we could complete if so desired. Full market survey and tool for the future As mentioned in the Market Analysis, the data utilized for this analysis included only those businesses that had readily available retail cost data. We could complete that survey to get a more accurate picture of the market, including such things as real occupancy rates for each competitor. In doing so, we would be able to develop a basic or advanced tool for regularly monitoring the market price for rentals in the target market, to be used for accurate pricing and maximizing occupancy rates. Past sales analysis of similar businesses It may be beneficial to complete a detailed survey of other businesses in this area both geographically and operationally in order to better understand the risk factors, market factors, sales fluctuations, etc. Fully vetting and identifying potential customers We may be able to develop a method for gathering contact information for most of the local potential customers, to allow for direct contact and advertising. Targeted advertising can be much more effective per dollar spent versus non-targeted.
  12. CleanCrowd, LLC • PO Box 322 • Wilder, VT 05088

    • www.CleanCrowd.com • 802.242.1293 16/16 7. Appendix Interactive map of competitors: Storage Association Report 2009: http://www.selfstorage.org/ssa/AM/downloads/09 Abt IntrotoSS.pdf Draft Financial Projectsion – Revenue Forecast Spreadsheet Site Plan