that there is the need for a ski to serve two distinct functions. A ski should have a low coefficient of friction during gliding on snow and a high coefficient when a skier attempts to move forward. It has been suggested that the pulse electro-thermal brake (PETB) developed by Professor Victor Petrenko can be integrated into a ski to solve the problem and to replace the existing methods. The PETB causes strong adhesion to its electrode by rapidly melting and refreezing the snow at its interface. The feasibility of integrating the PETB was investigated by attempting to determine an algorithm for its proper use. Prototype skis and PETB control hardware were designed, fabricated, and tested. Control algorithms were created and tested. The PETB was successfully implemented when a force sensor beneath the boot of the skier was monitored. When a threshold value near 80 percent of the skier’s bodyweight was exceeded, the PETB was activated. It was concluded that the PETB can be integrated effectively into a cross country ski when activated with the proper algorithm.
the contribution of many different people. I would like to thank everyone who helped in some way, especially those that follow. The research group: Professor Victor Petrenko, Professor Charles Sullivan, Dr. Valeri Kozliouk, Dr. Lev Deresh, Dr. Michiya Higa, Cheng Chen, John Chen, Fedor Petrenko. The machine shop staff: Leonard Parker Sr., Peter Fontaine, Kevin Baron, Michael Ibey. The Instrument Room Staff: Phil Tacy, Rene Dauphnais, Roger Dauphnais. The staff at CRREL: John Gagnon, Leonard Zabilansky, Marie Darling. The proofreading team: Anna Fleishman. My mother and brother: Elise LaCivita-Corpe and Roman Martinez. And as a matter of course: Gabriel F. Martinez.
Contents iv List of Figures viii List of Tables xi Chapter 1 Introduction 1 1.1 Cross Country Skiing 1 1.2 The Kick and Glide Cycle 2 1.3 The State of the Art 4 1.4 Definition of the Problem 6 Chapter 2 Background 7 2.1 The Pulse Electro-Thermal Brake Method 7 2.1.1 Energy Distribution 8 2.1.2 Snow Refreezing Time 10 2.1.3 Inherent Snow Adhesion 11 2.1.4 Temperature and Energy 12 2.1.5 Normal Pressure 14 2.1.6 Velocity 14 2.2 Skiing Forces 15 2.2.1 The Skier’s Boot 16 2.2.2 Movement Uphill 18 2.3 Benefits of the PETB 19 2.3.1 Previous Work 20 2.3.2 Integration 20
Acquisition Function Module Data Sheet 109 G.2 Data Translation Measure Foundry Software Data Sheet 113 Appendix H PETB Power Electronics 117 H.1 PETB Power Electronics Wiring Diagram 118 Appendix I Full Test Results 119 Appendix J “Start” Brand Grip Tape 130 Works Cited 134 Figure References 136
Stride 1 Figure 1.2 Force Exerted by Skier versus Time 2 Figure 1.3 Major Forces Involved in the “Diagonal Stride” 3 Figure 1.4 Animal Hairs Attached to a Ski Provides Friction 4 Figure 1.5 “Fish-scales” on the Bottom of a Ski 5 Figure 1.6 Showing the Camber of a Ski 5 Chapter 2 Figure 2.1 Asperities at the Snow/Ski Interface 8 Figure 2.2 PETB Cross Section 8 Figure 2.3 Diffusion Lengths in Phenolic and Snow versus Pulse Width 9 Figure 2.4 Refreezing Time for Snow at the PETB Interface 11 Figure 2.5 PETB Friction Force versus Temperature and Energy 12 Figure 2.6 Percent Increase in Friction over Background Frictional Force per Energy Surface Density versus Temperature for Four PETB Configurations 13 Figure 2.7 Braking and Background Forces versus Normal Pressure 14 Figure 2.8 Forces During Gliding and Kicking 15 Figure 2.9 Boot Connection and Angle 16 Figure 2.10 Typical Ski Pressure Distribution During Gliding and Kicking 17 Figure 2.11 Skier Forces on a Hill 18
Ski 31 Figure 4.2 Accelerometer Setup on Ski 31 Figure 4.3 Piezo Microphone Setup on Ski 32 Figure 4.4 Load Cell Setup on Ski 33 Figure 4.5 Boot Actuator Device 33 Figure 4.6 Backpack Setup for Skiing 35 Chapter 5 Figure 5.1 The DTMF Software 37 Figure 5.2 Shuffling on Carpet (Force Only) Graph 38 Figure 5.3 The Crossbow Software 39 Figure 5.4 Shuffling on the Carpet (Accelerometer’s 2 Axes) 40 Figure 5.5 Shuffling on the Carpet (Condenser Microphone Only) 41 Figure 5.6 Shuffling on Carpet (Piezo Microphone Only) 42 Figure 5.7 Shuffling on Carpet (Load Cell and Microphone) 43 Figure 5.8 Full Strides on Carpet (Load Cell and Microphone) 44 Figure 5.9 Basement Snow Track in Use 45 Figure 5.10 Basement Snow Test Results 47 Figure 5.11 Snow Trail at CRREL 48 Figure 5.12 Diagram of Initial Binary Logic 49 Figure 5.13 Flat Run with Grip Tape at CRREL 50 Figure 5.14 Uphill Run with Grip Tape at CRREL 51 Figure 5.15 Downhill Run with Grip Tape at CRREL 51 Figure 5.16 Successful Control of the PETB at CRREL 57 Chapter 6 Figure 6.1 Typical Distribution of Pressure at the Base of a Cross Country Ski 66 Appendices Figure B.1 Mechanical Switch and its Parts 79 Figure D.1 Example FlexiForce Load Cell Activation Setup 91 Figure D.2 FlexiForce High Temperature Load Cell’s Resistances versus Temperature 96 Figure D.3 FlexiForce Regular Temperature Load Cell’s Resistances versus Temperature 97 Figure E.2 Piezo Microphone Amplification Wiring Diagram 101 Figure E.1 Condenser Microphone Amplification Wiring Diagram 103 Figure I.1 Full Graph from Figure 5.2 Shuffling on Carpet (Force Only) Graph 121 Figure I.2 Full Graph from Figure 5.4 Shuffling on the Carpet (Accelerometer’s 2 Axes) 121 Figure I.3 Full Graph from Figure 5.5 Shuffling on the Carpet (Condenser Microphone Only) 122 Figure I.4 Full Graph from Figure 5.6 Shuffling on Carpet (Piezo Microphone Only) 122 Figure I.5 Full Graph for Figure 5.7 Shuffling on Carpet (Load Cell and Microphone) 123 Figure I.6 Full Graph for Figure 5.8 Full Strides on Carpet (Load Cell and Microphone) 123 Figure I.7 Full Graph for Figure 5.10 Basement Snow Test Results 124 Figure I.8 Full Graph for Figure 5.13 Flat Run with Grip Tape at CRREL 124 Figure I.9 Full Graph for Figure 5.14 Uphill Run with Grip Tape at CRREL 125 Figure I.10 Full Graph for Figure 5.16 Successful Control of the PETB at CRREL 125 Figure I.11 Full Graph of Day 2 – Skiing on Flat Only 126 Figure I.12 Full Graph of Day 2 -- Skiing on Flat and Hill (1) 126 Figure I.13 Full Graph of Day 2 – Skiing of Flat and Hill (2) 127
on Flat and Hill (1) 127 Figure I.15 Full Graph of Day 3 – Skiing on Flat and Hill (2) 128 Figure I.16 Full Graph of Day 3 – Shuffling on Flat 128 Figure I.17 Full Graph of Day 4 – Skiing on Flat and Hill 129 Figure I.18 Full Graph of Day 6 – Skiing on Flat and Hill (1) 129
history, the cross country ski has evolved considerably due to advances in technology and technique. The classical technique used in cross country skiing is defined by specific movements repeated while skiing. The main movement that we have sought to affect is referred to as the “diagonal stride” [1]. The diagonal stride is commonly used to move over terrain that is either flat or inclined so as to necessitate some force to overcome gravity. Figure 1.1 The Diagonal Stride [A]
from one foot to the other in order to gain movement in a forward direction. The force of gravity works to propel the skier while he is moving down an incline. A “kick” is defined as the portion of the cycle in which the skier actively exerts force in order to propel himself forward. A “glide” is the portion of the cycle in which the skier uses the momentum from the kick to slide on the snow for a small distance. After the skier glides on one foot, he shifts his weight and starts the kick cycle again. A full cycle consists of one kick and one glide. The kick and glide cycles for each ski overlap. This means that while the left foot is gliding the right foot is kicking and vice versa. 1.2 The Kick and Glide Cycle To further illustrate the cycle, we can refer to data acquired at the University for Sport Science at Salzburg, which will be analyzed in detail later in the text (see Figure 1.2). Figure 1.2 Force Exerted by Skier versus Time [B]
the skier during a kick and glide cycle. The weight of the skier is 76 kg (745 N). During the glide portion of the cycle the skier exerts about half of his body weight on the ski and snow, the same as if he were standing still and evenly distributing his weight onto either foot. Just before the kick, there is a shifting of weight and a poling force, which reduces the net force to the ski. The kick from the skier then exerts nearly twice his body weight. It is apparent that the kick portion of the cycle is quite different from the glide, simply based on the amount of force exerted by the skier. Let us look generally at the major forces at play while a skier is using the diagonal stride (see Figure 1.3). Figure 1.3 Major Forces Involved in the “Diagonal Stride” [C] Gravity is unchangeable and its contribution will vary only with the incline of the surface upon which skiing is taking place. Likewise, air drag force can be slightly affected by the type of clothing worn [2] or the changing of position of the skier. During uphill movement a skier can not remain in a tucked position to reduce air drag force. The remaining forces (see Figure 1.3) are those that can be easily affected by technique and equipment. While the two segments of the kick and glide cycle have different physical characteristics regarding the interaction of the ski with the snow, both necessitate some innovation to maximize desired efficacy. In the gliding phase the skier is relying on
a ski that has very low background friction. During the kicking segment, the ski needs to have high static and kinetic friction so as to best utilize the force exerted to the snow. This dichotomy presents the major problem in designing a cross country ski that will kick and glide equally. 1.3 The State of the Art Many material innovations have helped to evolve the cross country ski in attempts to create a ski that is light and slides well on snow. Originally, cross country skis were crafted from solid pieces of wood [3]. The movement to a laminated structure, using layers of epoxy and wood, made a much more rigid and light ski that allowed skiers to be lighter and faster[3]. A similar, yet bolder, leap in technology came with the use of synthetic materials comprising both the main body and base of the ski. The very light and rigid polymer materials allowed for new designs that were impossible with wooden skis. Ski bases today are mainly made from polymers [3] which have relatively low coefficients of friction with snow. Attempts to increase friction on the snow were not without technological advancements. One of the first methods employed involved the use of animal skins affixed to the base of the ski [4]. Since the hairs on the skin folded in a uniform direction they could be used like a ratchet mechanism on the snow (see Figure 1.4). Figure 1.4 Animal Hairs Attached to a Ski Provides Friction
hairs bent in their natural manner and added relatively little to the background friction. When the skier pushed onto the ski and moved it in the reverse direction, the hairs were activated and the snow worked against them to produce very good kicking power. Today, a similar approach has been used by forming ridges (or “fish-scales”) in the polymer base of the ski (see Figure 1.5). Figure 1.5 “Fish-scales” on the Bottom of a Ski The use of synthetic materials aided in creating a ski that has well defined and configured mechanical properties. A major innovation was the design of a cambered ski [5] (see Figure 1.6). Figure 1.6 Showing the Camber of a Ski [D]
one can designate a portion in the middle of the ski that will not come into contact with the snow during the gliding phase. As seen in the kick and glide cycle data (see Figure 1.2), the gliding occurs with much lower applied forces to the ski. This allows for employment of very high friction materials during the kick cycle, since they should not come into contact with the snow except during kicking. The ski can not be too cambered, as this increases relative pressure at the tips of the ski during the glide phase and creates higher than desired friction [1]. The high friction materials used today for better kicking power require expertise in application [6] and thorough knowledge of snow conditions. A number of “kick waxes” are available to skiers, each with specific instructions about application depending on snow conditions, temperature, base material, etc. Also, the portion of the ski that is waxed and the wax’s thickness can contribute greatly to its efficacy [6]. 1.4 Definition of the Problem All of these mechanical and material advances in the construction of the cross country ski and surface manipulation allow for lower friction during the glide phase and higher friction in the kick phase. However, the user needs to have developed understanding and experience with application techniques in order to properly employ these innovations [6]. He must also consistently change the innovations’ application to match varying environmental conditions. The technologies that attempt to solve the adaptive problems (see Appendix J) do not provide friction any greater than the current methods. Therein lays the problem: How can one create a ski that glides very well yet allows the skier to implement higher than normal friction when needed in an adaptive and easy to use manner?
Professor Victor Petrenko’s research group has been working for several years with the modification of friction on ice and snow interfaces with various materials. The most applicable solution to the problem of the cross country ski’s need for increased friction comes in the form of the “pulse electro-thermal brake” (PETB) [7] for use on snow. In order to fully utilize the PETB, we must first understand how it works. It is known that no surface is exactly flat but is teeming with pores, pits, bumps, etc. When a ski base comes into contact with snow or ice, the surfaces do not lie flat on one another (see Figure 2.1). With an increase in normal force, the asperities between the snow and ski base will deform, increasing the real area of contact. However, the real area of contact will still be many orders of magnitude less than the apparent area of contact.
Distribution The PETB uses a very dense pulse of energy directed to the snow and base interface. The energy is delivered via a thin metallic electrode to rapidly melt and refreeze the snow in the form of a high current, short duration (time) pulse of electricity (see Figure 2.2). Figure 2.2 PETB Cross Section In Figure 2.2 and the experiments documented in this thesis, the electrode (titanium) has a support material (phenolic) that is dissimilar to the ski base. The PETB will distribute energy throughout its interface. This distribution can be further understood by investigating the energy’s diffusion length, Ld , into each material. t D L d (2.1) The diffusion length is a function of the diffusion coefficient, D, and the time that the energy will be present at the surface, t (the pulse width).
the material properties of the phenolic substrate and the snow. Snow has a range of properties depending on how compacted it is. The value used in calculation follows parenthetically the range given for snow. The thermal conductivities (λ) are 0.6 and 0.01 – 1.0 (1.0) W•m-1•K-1 for phenolic and snow respectively[14]. The densities (ρ) are 1.7•103 and 0.05 – 0.6 (0.6) •103 kg / m3, respectively [14]. The heat capacities (C ) are 1.3•103 and 2.0 . 103 J•kg-1•K-1, respectively. The heat diffusion coefficients may be calculated from the properties. C D (2.2) With the given properties, the diffusion lengths can be calculated (see Figure 2.3). 0 0.01 0.02 0.03 0.04 0.05 0.06 0.07 0.08 0.09 0.1 0 0.001 0.002 0.003 0.004 0.005 0.006 0.007 0.008 0.009 0.01 Time (s) Depth (mm) Snow Phenolic Figure 2.3 Diffusion Lengths in Phenolic and Snow versus Pulse Width
typical pulse width of 1 to 10 milliseconds, the energy will diffuse farther into the snow than the phenolic. Since the pulse is short and the thermal capacities of the two materials are relatively low the majority of heat is used in the heating element and to melt the snow (see Appendix A). 2.1.2 Snow Refreezing Time Another critical factor for use of the PETB is the time that it takes for the melted snow layer to refreeze to the surface of the electrode. If the refreezing time is longer than the ski will be in contact with the snow, the skier will not be able to benefit from any increase in friction. From Figure 1.2, it can be seen that the kick cycle occurs over a time period of nearly 200 milliseconds. The freezing time can be estimated using the following simplified equation (see Appendix A). 2 phenolic phenolic phenolic snow snow snow latent snow melt C C T q l t (2.3) Here lmelt is thickness of melted snow (5.0•10-6 m) [8], qlatent is the latent heat of snow melting (3.33•105 J•kg-1•K-1) [8], and ΔT is the temperature difference between the snow melting point and the environmental temperature. Equation 2.3 relies on the assumption that each instance of heating occurs in a region that has not previously been heated. Since a ski would be constantly picked up and/or slid to a new location during use, this assumption is reasonable. Figure 2.4 shows the estimated refreezing time for the snow at the PETB interface as a function of ΔT with the given material properties.
0.09 0.1 0 2 4 6 8 10 12 14 16 18 20 ∆T (C) Time (s) Figure 2.4 Refreezing Time for Snow at the PETB Interface From Figure 2.4, it can be seen that the PETB would not work well with environmental temperatures above -2 degrees Celsius, which could present a major issue in field use. 2.1.3 Inherent Snow Adhesion Another major problem with the PETB method on snow is the lack of adhesive strength within the snow in the normal direction (the direction that is perpendicular to the surface of the snow). Since the interface is under some normal pressure during the heating and refreezing, the real area of contact approaches the apparent area of contact in magnitude. All of the major forces that play a role in snow adhesion (hydrogen bonding, electrostatic attraction, and Van der Waal’s force [8]) depend on real area of contact. Since the PETB increases the real area of contact, the adhesion regime is no longer a matter of friction or sliding. The snow becomes essentially a part of the electrode and ski, and the force necessary to remove the snow becomes equivalent to the ultimate shear stress of the
is quite strong in the shear direction, a small normal force applied to the ski in the upward direction will serve to break the bonds in the snow rather than at the interface. 2.1.4 Temperature and Energy A number of factors contribute to the effectiveness of the PETB. A typical dependence of friction force created versus temperature and energy applied to electrode can be seen in Figure 2.5. 0 5 10 15 20 25 30 35 40 0 0.5 1 1.5 2 2.5 3 3.5 4 4.5 5 Energy (J) Braking / Background Force (N) -2.50C -50C -100C -150C -190C Figure 2.5 PETB Friction Force versus Temperature and Energy (25 μm titanium foil on 2.5 mm phenolic; 12.5 x 1.5 cm surface area; 0.193 ohm resistance; pulse of 1 ms from 3.6 mF capacity; 3.73 kPa normal pressure, natural snow) [E] From Figure 2.5 it becomes apparent that the PETB can be over- or under-powered, and should use different energy levels depending on the temperature of the snow that is being affected. By choosing an appropriate energy for each temperature that is near the point at which the slope of the braking force versus energy graph approaches zero, the friction can be
over background frictional force per energy surface density (Joules per square centimeter of electrode) for four different electrode and substrate configurations. 0.00 10.00 20.00 30.00 40.00 50.00 60.00 70.00 80.00 90.00 0 5 10 15 20 25 Temperature (-C) % Increase / (J / cm^2) Ti NiP PCB-4.8 PCB-0.8 Figure 2.6 Percent Increase in Friction over Background Frictional Force per Energy Surface Density versus Temperature for Four PETB Configurations. In Figure 2.6 NiP is a ceramic sample coated in nickel phosphorous electrolytic plating, Ti is 25 μm thick titanium foil on 3 mm phenolic, PCB-4.8 and PCB-0.8 are two different configurations of copper (17 μm and 34 μm respectively) on glass/epoxy (FR4) as used in typical printed circuit boards with resistances of 4.8 and 0.8 ohms respectively [9]. Figure 2.6 makes it clear that more energy is required at colder temperatures for equivalent braking force for each substrate. It also shows that the two PCB samples will be more efficient than the other two.
is the effect of normal pressure applied to the interface. 0 10 20 30 40 50 60 70 80 90 100 0.0 5.0 10.0 15.0 20.0 25.0 30.0 35.0 40.0 Normal Pressure (kPa) Background & Braking force (N) Background Force Braking Force Figure 2.7 Braking and Background Forces versus Normal Pressure (Printed circuit board with 17 μm thick copper; 31 cm2 working surface area; 0.79 ohm resistance; pulse of 300 μs from 3.6 mF capacity; -9.5 degrees Celsius ambient temperature; pressed man-made snow; 4.8 J and 117 V) [F] In Figure 2.7 we see that the braking force increases more rapidly than the background force as the normal pressure increases. From this we can confirm that a higher normal pressure will increase the effect of the PETB. 2.1.6 Velocity Some qualitative experiments have been conducted in order to test the PETB at velocity. All tests indicated that there is minimal or no effect when one of the materials at the electrode/snow interface is moving [8, 9]. The most likely source of the PETB’s failure at velocity is bouncing, or vibrations, in the testing apparatuses (or two substrates in contact)
with the PETB electrode surface [8]. Until tests are conducted with proper conditions, it should be assumed that a PETB electrode will only be effective at relatively low or zero velocity. 2.2 Skiing Forces Although it would be an extremely complicated task to measure and record all of the forces that occur at each moment throughout the kick and glide cycle, it is valuable to make a general survey of the forces at play. Figure 2.8 Forces During Gliding and Kicking [G] The analysis in Figure 2.8 [10] assumes that the skier is on flat terrain and only takes into account two directions (the diagonal stride is mostly planar motion and has very little motion in the third direction [10]). Although most of the quantities used in this example are estimates, the analysis does show, in general, what forces occur when the skier is skiing. The skier’s weight is estimated at 60 kilograms, thus the 600 N of gravitational force. During kicking the force exerted nearly doubles to 1000 N (an estimate). At a speed of 5 meters per second [10], the air drag force was estimated at 10 N [10]. The ski drag force is a function of the coefficient of friction and the normal force on the ski/snow interface, and is
sliding on the snow (wax has an estimated coefficient of kinetic friction of 0.1 [11]). Poling force is estimated as 25 percent of the skier’s weight [10], angled at 25 degrees from vertical [10] and is equivalent in each part of the cycle (the arm used to exert force switches with kicking and gliding). The change in angle of the reactive force is estimated at 5 degrees less than vertical in the glide portion [10], and 15 degrees past vertical during kicking [12]. The only forces that provide the skier with acceleration forward are the poling force created by arm movement and the reactive force generated during the kick cycle. During the glide cycle there is a net force backward from the skier; an overall deceleration from the resistive forces of snow/air drag and the nature of the reactive force of the ski. During the kick cycle, the change in angle of the reactive force coupled with its increase in magnitude allows for a net force in the skier’s forward direction. This force is limited by the frictional force created at the snow/ski interface, which is dependent on the coefficient of static friction of the wax used and the normal force. If the kick force exceeds the frictional force there will be slipping and loss of the skier’s effort (see Section 2.2.2). 2.2.1 The Skier’s Boot The change in angle of reactive force during the kick cycle occurs mainly as a function of the boot’s connection mechanism (see Figure 2.9). Figure 2.9 Boot Connection and Angle
toe and has a rigid heel that extends above the ankle. This design serves to limit the skier’s range of motion for applying force to the ski and snow. When the heel is down (during gliding and the beginning of the kick cycle) the skier’s weight is distributed throughout the entire base of the boot. As kicking occurs the heel is lifted from the ski and force is transferred to the ball of the foot. Since the fulcrum point for the boot is at the toe, the angle at which the reactive forces are transferred to the skier’s backward direction (see Figure 2.8) can easily be changed. The distribution of force in the normal and parallel directions (see Figure 2.8) changes with the angle of the boot and create reactive forces that propel the skier forward. This change of exertion to the ball of the foot also affects the pressure distribution to the snow through the ski. The cambered design of most cross country skis provides for uneven pressure distribution (see Figure 2.10). Figure 2.10 Typical Ski Pressure Distribution During Gliding and Kicking [H] As the force is increased and moved to the ball of the foot, the ski bends until making contact with the snow. The force changes from being concentrated in points in the front and back of the ski to the center, directly beneath the foot.
and the skier’s gravitational force will change with the angle of incline while skiing uphill. The general distribution of forces on a hill should not greatly affect the forces at play except to add to the amount of reactive force required to achieve equivalent acceleration on flat terrain. In the uphill situation there is a component of the skier’s weight that exerts force in the skier’s backward direction. There will inevitably be an increase in kicking force required to have the same acceleration on the hill as in the flat terrain. The angle of incline a skier will not be able to move up can be estimated using only the reactive forces due to exertion of force by the skier through the foot. Figure 2.11 Skier Forces on a Hill [G] In Figure 2.11 θ is the angle of incline. Fw is the weight of the skier and is equal to his mass times gravitational acceleration (mg). Fy and Fx are the components of the weight in the axes relative to the plane of the hill as defined. Ff is the frictional force available and is equal to the coefficient of friction (μ) times Fy . The skier will slip when Fx exceeds Ff . We can find the angle at which slipping will occur.
g m F F w x (2.4) ) cos( g m F F y f (2.5) ) ( tan ) sin( ) cos( 1 g m g m F F x f (2.6) Although this example is simplified, the general trend is that an increase in coefficient of friction will increase the angle of the hill that can be climbed. This means that at the same hill angle, a skier that has skis with a higher coefficient of friction during the kicking cycle will have to exert less effort to obtain the same acceleration up the hill than he would with skis having a lower coefficient. The relationship described above also means that on flat terrain the angle at which the skier can exert force before slipping will increase as a function of the coefficient of friction. This increase in maximum exertion angle may serve to change the sport radically in the sense that skiers will be able to alter their technique to get a much longer (in terms of angle) kick for each stride. 2.3 Benefits of the PETB Despite the presented difficulties of implementing the PETB, it has potential to positively affect cross country skiing. In terms of friction enhancement, the PETB has been shown to be up to 4 times as effective as the best waxes in current use [8] (see Table 2.1). μ (Background) μ (Modified) Wax 0.12 0.19 NiP 0.07 0.43 Ti 0.12 0.51 PCB - 0.8 0.17 0.93 PCB - 4.8 0.28 1.40 Table 2.1 Coefficient of Friction for Wax versus Four PETB Substrates (At varying temperatures for maximum effect) [F]
various substrates on snow. As the background friction decreases to normal wax levels (with future iterations of the technology) for the PCB samples, the increase over background friction will exceed the 4 times value mentioned above. 2.3.1 Previous Work Several skis with prototype PETBs were manufactured including mechanical force sensors (see Appendix B) prior to work toward this thesis. No quantitative data had been recorded to confirm that Figure 1.2 was a viable force versus time diagram so we had to assume it was accurate. Through a few iterations, a mechanical force sensor/switch was developed using a rubber spring actuated by direct contact with the boot of a skier (see Figure B.1). It allowed for the user to adjust the threshold at which contact would be made between the base and actuator rod via a threaded set screw in the center. It was not easy to modify or adjust, and it was quite heavy and large. Although this mechanical switch provided unreliable results and activated unintentionally and erratically, it helped to prove that the PETB can be used in a cross country ski. 2.3.2 Integration If the PETB is intelligently integrated into a ski, it can provide the skier with precise control. He will no longer have to learn and use complicated waxing techniques. The ski can be able to adapt to any condition instantly, making cross country skiing more approachable as a sport, and safer overall.
objective of this thesis is to develop an algorithm that defines how and when to activate the PETB so as to maximize its efficacy in a cross country ski. To this end, work shall comprise designing, building, testing, and analyzing experiments in order to make suggestions on how to implement an algorithm in a completed product. From the information offered in Chapters 1 and 2 as well as work done prior to this thesis, some simple presumptions and requirements were formed. These can be delineated by the PETB’s dependence on several factors (as follow). 3.1.1 Exerted Force It is assumed that analyzing force applied by the skier in the direction perpendicular to the plane of the snow will produce a graph similar to Figure 1.2. It can also be assumed that the PETB should be triggered at some point along that graph, when the force exerted
the body weight of the skier. Therefore, there should be some method to detect the force exerted by the skier. 3.1.2 Velocity It is assumed that the PETB will only work when its relative surface velocity is close to zero. Therefore, there should be some method to detect when the ski has zero velocity. 3.1.3 Reliability It is assumed that skiers will not perform perfectly at all times. Therefore, there should be some inherent logic or component to ensure proper activation of the PETB. 3.2 Goals These objectives should be met with a simple and elegant algorithm using components that allow for easy implementation and low cost in manufacturing. Although the PETB’s performance and energy requirements depend greatly on the snow temperature, it can be easily measured and therefore will not be considered as a part of this work.
Expectations Some data was found regarding the vertical component of the force exerted by the skier during the kick and glide cycle (see Figure 1.2). The methods for obtaining the data presented in the graph from the University of Sports Science in Salzburg are unclear and undocumented. However, the conditions under which the data was acquired are known to be of a professional racing skier of 76 kg body weight, skiing on a slope inclined 6 degrees (uphill) at an average speed of 4.8 m/s (see Appendix C). The data allows for the assumption that, during the glide cycle, the skier will exert force around half of his body weight and while kicking the skier will exert force in excess of his body weight. It was determined that some sort of force sensor should be placed under the ball of the foot in order to record the force exerted.
reliable timing for triggering the PETB, two ideas were introduced as options. Since the PETB must not work when in motion relative to its interface, we needed to be able to determine when the ski was not in motion relative to the snow. The first idea was to use a microphone attached directly to the body of the ski. The movement of the ski on the snow should provide vibration through the ski and enough sound to determine when the ski is not in motion [8]. And most likely there should be some filtering of ambient noise. The second idea was to use an accelerometer attached directly to the ski in order to determine when the ski had no acceleration. It was thought that perhaps by knowing the points with zero acceleration, one could either integrate to find velocity or assume a zero velocity point [8]. 4.1.3 Cycle Time Expectations The assumption can also be made that a professional skier would have a full cycle time (meaning time between reaching any point on the graph repeatedly by the same foot) of 2.0 seconds at most (see Figure 1.2). This is interpreted from the data since similar curves would be produced by either foot, and a skier alternates between feet regularly. A recreational skier would be moving at a much slower speed and be less quick about switching from kick to glide and foot to foot. This would increase the full cycle mainly through the lengthening of the time in the gliding phase. Also, Figure 1.2 shows the maximum force exerted occurring over a time period of nearly 200 milliseconds. It was determined that data acquisition should involve sensory components capable of recording in the kilohertz (kHz) range so as not to miss any major changes in motion or force and be capable of allowing for control of the PETB over the duration as noted above.
to find an appropriate force sensor, a search was conducted of manufacturers of miniature and sub-miniature load cells. Almost all of the load cells found had similar analog electronic configurations based on the use of a Wheatstone bridge type strain gauge. An excitation voltage of 5 – 15 volts (V) is required as input to the bridge, and some number of millivolts (mV) could be recorded for every volt of excitation at a peak load (e.g. 2 mV per V excitation at peak of 1,000 pounds (see Appendix D.1)). There were several other requirements of the force sensor (as follows). 4.2.1a Force Sensor Requirements The most common small load cells were of the “button” type (see D.1). These have a thin cylindrical shape with a small “button” protrusion as a loading point. The load cell needed to fit in the area beneath the boot and binding (see Figure 2.9). Therefore, it needed to have an outside diameter less than 25 millimeters and height less than 10 millimeters. Since we would be recording the force exerted by a skier who weighed approximately 715 newtons and could exert up to twice his body weight, we needed to have a load cell that could measure at least 1500 newtons. Also, the load cell should have fast enough response to accommodate quick changes in force (occurring around 1 millisecond, at least). Since the ski would be tested on snow in cold environments, we needed a load cell that could operate in temperatures down to or below -20 degrees Celsius. It was also taken into consideration that the load cell should be easy to use and reliable. The cost of the load cell was not a major factor in that the only purpose at this point in the production process was to measure and implement test algorithms, and not for mass production.
that most fit the requirements was the Model 13 Subminiature Load Cell made by Honeywell/Sensotec (see Appendix D.1 and Figure 4.4). Unfortunately, there was a mix-up during communications with the manufacturer and it was not until after the initial testing that it was discovered that we received the 1.1 kilonewton load cell (see Section 6.3.3). It was determined that the best location for the load cell would be under the ball of the foot (see Section 2.2.1). Some device would have to be designed and manufactured in order to properly actuate the load cell while the user was skiing. 4.2.2 The Microphone In order to find an appropriate microphone, an investigation was conducted of several types of microphones that were cheap and available for testing. Several requirements for a microphone to work properly were developed (as follows). 4.2.2a Microphone Requirements The microphone should be sensitive enough to pick up low level noise from the ski moving on snow. It was determined that effectiveness in this arena would be met by initial qualitative testing since it was unknown what response to expect. Microphones with large ranges of response and sensitivity would be best suited for initial testing. The microphone should be reliable in that it is a durable electronic component. Since the microphone would be in harsh winter conditions, it should not be so fragile as to break with minimal physical abuse and should not be greatly affected by humidity. It should be easily integrated either onto or into the ski or ski binding so that it can record sounds transmitted through the ski.
be activated, amplified, filtered, and recorded as needed. It also should be able to operate in environments with temperature at or below -20 degrees Celsius. 4.2.2b Microphone Selection and Placement Two types of microphone that satisfied the above requirements were selected from the supply that was most readily available: a piezoelectric type, and a unidirectional condenser microphone (see Appendix E). It was determined that the front of the ski would be an ideal location for the microphone, as the tip of the ski constantly comes into and out of contact with the snow through the kicking and gliding cycles [8]. 4.2.3 Accelerometer In order find an appropriate accelerometer, a search was made of what we had in stock and available for testing. Several requirements for an accelerometer to work properly were developed (as follows). 4.2.3a Accelerometer Requirements It was determined that acceleration should be measured on two axes (the horizontal motion of the ski forward and backward, and movement perpendicular to the ground – see Figure 4.2). The accelerometer should be sensitive enough to pick up the changes in motion of the ski inherent in the typical kick and glide cycle. It was determined that effectiveness in this arena would be met by testing since the response to expect was unknown. Also, the accelerometer should be able to operate in environments with temperature at or below -20 degrees Celsius.
major requirements for this component, because it was unknown whether or not any valuable information could come from an accelerometer. 4.2.3b Accelerometer Selection and Placement It was discovered that the ADXL202EB-232 accelerometer evaluation board (see Appendix F) made by Analog Devices was available from the Thayer School of Engineering’s instrument room for use, and would satisfy the requirements. It was also determined that it should not matter very much where on the ski the accelerometer was placed. Calibration of the accelerometer (setting the relative zeros) should create a viable starting point from which to measure. 4.2.4 Data Acquisition In order find an appropriate data acquisition package that included software and hardware, an investigation was made into several different packages that we had available at the Thayer School of Engineering. Several requirements for an appropriate data acquisition package were developed (as follows). 4.2.4a Data Acquisition Requirements The hardware component of the package should be able to monitor at least two analog channels (microphone and force sensor) with sampling rates in the kHz range and produce at least three different analog or digital signals for driving other hardware components.
and have software that allows for monitoring of various analog signals while making calculations and giving feedback through the hardware component’s output channels. 4.2.4b Data Acquisition Selection It was discovered that the Data Translation data acquisition package (see Appendix G) which included the DT9806 acquisition function module (DTAFM) and DT Measure Foundry software program (DTMF) was available for use from the Thayer School of Engineering’s Fluids Lab and would satisfy the requirements. 4.3 Mechanical Setup For the tests on carpet (see Section 5.1) and on the basement snow track (see Section 5.2), a ski with its original base intact was used. For all other testing a ski that was manufactured for the original mechanical switch (see Appendix B) was used. The ski had a PETB installed that consisted of four electrodes (see Figure 4.1). The electrodes had a cross section similar to that of Figure 2.2. The metallic element was titanium foil (25 microns thick). Figure 4.1 Titanium Foil PETB and the Ski
small rectangular package with the two monitored axes on a plane parallel to its printed circuit board. It was necessary to create a mounting that would hold the accelerometer in the proper upright position (see Figure 4.2). The package needed to be waterproof so that testing on snow posed no potential threat to the integrity of the PCB or its components. A suitable container was fashioned from a spare plastic project box. Figure 4.2 Accelerometer Setup on Ski 4.3.2 The Microphone Each microphone was, in turn, taped on the ski directly in front of the binding (see Figure 4.3). It was thought to be important that the microphone’s more sensitive side should be in direct contact with the ski surface in order to obtain the best results [8]. Supplementary electronic components (amplifier, filter, etc.) would be located with the power electronics for the PETB (not on the ski).
Force Sensor It was determined, through qualitative testing of the load cell and suggestions from the manufacturer, that the best way to actuate the load cell was indirectly. It was determined that the best way to do so would be to use a medium between the moving part (which would be on the bottom of the boot) and the load cell itself. Figure 4.4 Load Cell Setup on Ski The cell needed to be loaded in a uniform and consistent manner in order to ensure good results. A system was devised using thin hardened steel as a medium that kept the load cell
force from the boot in a manner that seemed to fulfill the requirements (see Figure 4.4). The skis that were available for use in testing (and known to work from previous field testing) were fitted for use with the mechanical switch (see Appendix B). Therefore, a small stand was needed to bring the force gauge up to the level of the binding, and some protrusion from the bottom of the boot was necessary to make contact with the load cell. It was determined that a cylindrical plug (see Figure 4.5) would be the best shape in order to roll down the steel plate with the motion of the foot during the skiing cycle. Figure 4.5 Boot Actuator Device 4.3.4 The Data Acquisition Package The data acquisition module was set up to monitor the load cell and a microphone simultaneously and to trigger a pulse at an appropriate time. Each microphone had a different amplification and filtering setup provided by Dr. Valeri Kozliouk (see Appendices E.2 and E.4). The condenser microphone was driven with the same analog output as the load cell, and the piezoelectric needed no driving voltage. The accelerometer evaluation board came with its own data acquisition software (Crossbow X-Analyze, see Appendix F) and was connected to a laptop computer via the serial port. Initial tests of the software and accelerometer showed it to be in working condition.
should be created that would hold a laptop computer, the data acquisition package, and any necessary power electronics for the PETBs on the skis so that a skier would be able to move freely while testing. Figure 4.6 Backpack Setup for Skiing
that the best method to ascertain whether or not each electronic component added to the ski functioned properly was to test each one individually on some surface other than snow. Several flooring surfaces in the Thayer School of Engineering were tested qualitatively (by putting on skis and boots and attempting to ski around the building). It was determined that the carpeted floors most mimicked skiing on snow in terms of providing a bit of glide and friction during kicking (with no wax or other friction enhancement needed). Skiing on the carpet provided a method by which we would not have to rely on the PETB’s interaction with snow as a source for friction during the kick cycle. This eliminated the most likely source of inconsistency, allowing for thorough analyses of the load cell, accelerometer, and both microphones.
load cell provided a very clear signal when a sampling rate of 50 kHz and a buffer of 20 milliseconds were used. The buffer was set to display, record, and use in calculating and comparing only the average of the monitored signal over the designated time period. The load cell was excited with a 5.0 volt analog signal (Analog Channel 0 out) from the DTAFM and recorded through the Channel 00 analog input (see Appendices E.2, E.4, and G.1) . Figure 5.1 The DTMF Software The load cell set up (including mounted cell and boot on the ski) was calibrated using the weight of a skier standing on one foot. The skier for these carpet tests weighed approximately 660 newtons. It was determined that the load cell’s response was about one millivolt for every 350 newtons of force exerted.
see Figure 5.2) and then at half speed skiing (gliding and kicking) on carpet (see Figure 5.8). Figure 5.2 Shuffling on Carpet (Force Only) Graph Figure 5.2 shows three shuffled steps on the carpet as recorded (see Figure I.1 for full results). Response (and correspondingly Force) is shown in mV (y-axis) versus seconds (s) of time (x-axis). The force was recorded over a period of time long enough to capture several steps. The time on the x-axis reflects that period. The results from the tests provided data to warrant further use of the load cell. Step 1 Step 2 Step 3
with the operation of the accelerometer and its controlling/recording software. It was determined that the manufacturer’s default settings provided clear and consistent data (see Appendix F). The software was very easy to use and allowed for setting both recorded axes to zero at any point desired. Figure 5.3 The Crossbow Software The accelerometer package was calibrated by resetting the reference points (zero levels) when the ski lay flat on the carpet (with the skier’s weight on the ski to provide the force to make it flat) and was not moving. Data was then recorded while the skier shuffled along the carpet (see Figure 5.4).
5.5 6 6.5 7 7.5 8 8.5 9 9.5 Time (s) Acceleration (g) Y-Axis X-Axis Figure 5.4 Shuffling on the Carpet (Accelerometer’s 2 Axes) The x-axis, as recorded, refers to the axis perpendicular to the plane of the ground. The y- axis refers to the axis parallel to the forward motion of the ski (see Figures 4.2 and I.2 for full results). Results from the test of the accelerometer on carpet determined that it would not be feasible to use it to provide logic for the PETB pulsing algorithm (see Section 6.2.2) and would not be further tested nor used. 5.1.3 The Microphones The microphones (both piezo element and condenser) were set up with the DTMF software package using the same sampling rate and buffer as the load cell (see Section 5.1.1). First, the condenser microphone was placed on the ski and the ski was rubbed back and forth Step 1 Step 2
be recorded. Since there was evidence of a signal, a test was conducted as the skier shuffled on the carpet. Figure 5.5 Shuffling on the Carpet (Condenser Microphone Only) Figure 5.5 shows the recorded signal from the condenser microphone for three shuffled steps on carpet (see Figure I.3 for full graph). The response was measured in voltage (mV) versus time (s). The same rubbing on the carpet procedure was conducted with the piezo element microphone. It showed evidence of a signal and was also recorded as a skier shuffled on carpet. Step 1 Step 2 Step 3
5.6 shows the recorded signal from the piezo microphone for three shuffled steps on carpet (see Figure I.4 for full graph). The response was measured in voltage (V) versus time (s). The results of the tests of both types of microphones showed that the piezo microphone provided a more consistent and reproducible signal. 5.1.4 The Load Cell and Microphone Together The last testing on carpet determined how the load cell and microphone’s data would synchronize. The piezo microphone and the load cell were each set up with the DTMF software package using the same sampling rate and buffer as previously described for the load cell itself (see Section 5.1.1). The skier shuffled on the carpet as both signals were monitored. Step 1 Step 2 Step 3
In Figure 5.7 (and all subsequent graphs) the blue signal is the load cell’s recorded signal (in mV) and the red signal is from the microphone (in V), both versus time (s). Two shuffled steps are shown (see Figure I.5 for full results). Noise could be seen in the shuffling test. It was found that, during initial testing, some of the wiring had been mishandled. Some adjustment was necessary to eliminate the noise during the next tests which involved a bigger stride and gliding. Step 1 Step 2
Microphone) Figure 5.8 shows two full skiing cycles on carpet (see Figure I.6 for full results). The microphone and load cell working simultaneously provided reliable and consistent data. It was determined that the two would work together on snow for live control of the PETB. 5.2 Basement snow track tests Before attempting to control the PETB on snow, the load cell and microphone were tested independently and together (in both cases mounted on the ski) on a snow surface. A wooden track that was long enough to accommodate one stride and wide enough for one ski was previously manufactured for friction coefficient testing by Professor Victor Petrenko’s research group (see Figure 5.9). Step 1 Step 2
determined that skiing one stride in the wooden track using a common wax for friction would provide a method by which we would not have to rely on the PETB’s interaction with snow as a source for friction during the kick cycle. As with the carpet, this eliminated the most likely source of inconsistency. This allowed for initial analyses of the load cell and microphone on snow. 5.2.1 The Microphone Although the microphone had shown positive response on carpet, it was unknown how it would react on snow. Several qualitative tests were conducted by rubbing the ski back and forth on the snow in the wooden track to gauge whether or not the microphone
strong response during sliding, and a steadily low response when stationary. In an effort to make the signal more clear, the response time constant was increased to 30 milliseconds (from the original 15 milliseconds – see Appendix E.4). It was determined that the microphone could be used to detect motion on snow. 5.2.2 The Load Cell The load cell was also tested qualitatively by a skier jumping up and down and mimicking the kick cycle while on the snow. The load cell showed evidence of working and it was determined that it would function properly on snow. 5.2.3 The Load Cell and Microphone Together The wooden track was a bit awkward to use since it only allowed for one ski and the skier’s opposite foot had to be placed on a pedestal beside the track (see Figure 5.9) in order to properly distribute weight to the ski. Also, the length of the track prohibited testing several full kick and glide cycles. After trying to glide just a bit before kicking on the ski, it was determined that we could make a reasonable approximation of one kick cycle using the track. A common wax was applied to the base of the ski according to the manufacturer’s specifications (see Appendix J). The “Start” brand grip tape is a wax like film with adhesive on one side and sticky wax on the other. It is pressed onto the underside of the ski where wax would normally be placed. The “Start” brand tape was used as a benchmark because it was known to be an leading technology in the industry [13]. The DTAFM and DTFM software package were connected to the load cell and microphone and configured as for the carpet tests (see Section 5.1.1). The skier made several attempts at a kick and glide cycle.
one kick on the basement snow track (see Figure I.7 for full results). Since the microphone gave clear indication that there was no motion as the force began to increase, it was determined that the microphone and load cell could be used to trigger the PETB reliably in real skiing conditions. 5.3 Testing at CRREL In an effort to test control of the PETB on a working ski, it was necessary to actually ski (meaning moving on snow with several kick and glide cycles) with all of the components working in place. In order to ski in an environment with reliable snow conditions and temperature, some cold room space was rented for testing at the Cold Regions Research and Engineering Laboratory (a United States Army Corps of Engineers facility) in Hanover, NH. What is referred to as “the flume” room is a cold room approximately 15 meters wide by 50 meters long which contained a large ice flow testing apparatus. The room had a walk-space Microphone Load Cell
by 50 meters long. Baseboards of plywood and plastic sheeting were laid down along the walk-space. A ramp was constructed near the center of the walkway with a 10 degree incline. Snow was made and packed to form a trail. A track was made in the snow to mimic those set for cross country ski racing (see Figure 5.11). Figure 5.11 Snow Trail at CRREL [I] The “flume” was long enough for the skier to move through several kick and glide cycles, allowing for testing up and down the incline. 5.3.1 The Basic Idea for an Algorithm Before attempting to control the PETB on snow, it was thought necessary to develop an initial algorithm for switching on the pulse. It was determined that both the load cell and microphone could be used to provide binary logic for switching.
chain of inequalities that would change a binary output to the power electronics that controlled the PETB (see Figure 5.12). The limitations of the software’s interface and logic made it was necessary to use this chain with variable thresholds. Figure 5.12 Diagram of Initial Binary Logic With the logic from Figure 5.12 in place, the DTMF software would monitor both the load cell and the microphone simultaneously. When the load cell’s signal x was below the threshold x’ (meaning that the force exerted by the skier was below the set threshold) the threshold for the microphone’s logic y’ would be set to a value so low (y2 ’ ) that the microphone’s signal could never fall below it. When the load cell’s signal x was above the threshold x’ (meaning that the force exerted by the skier exceeded the set threshold) the threshold for the microphone’s logic y’ would be set to a value that it was likely to be below (y1 ’) if there was no motion. If both conditions were satisfied, a binary value z would be set to 1 (corresponding to a high voltage), to indicate that a pulse should be turned on. When either one or neither was satisfied, z would be defaulted to 0 (or some low voltage). The power electronics would be connected to the DTAFM’s binary output and used as a switch for activating the PETB. This
be needed when the ski was not moving. 5.3.2 Day 1 Testing (Grip Tape) It was determined that the first tests to be done on the ski trail should be without the use of the PETB. Rather, the “Start” grip tape was used in order to have a benchmark against which to compare the performance of the component controlled PETB ski. Tests were conducted on the flat terrain of the trail by shuffling and kick and glide skiing with ambient temperature of -20 degrees Celsius on compacted man made snow. Figure 5.13 Flat Run with Grip Tape at CRREL Figure 5.13 shows the force and microphone data as recorded on separate axes (see Figure I.8 for full Results). The next tests were conducted on the incline up and down. Step 1 Step 2 Step 3 Step 4
Figure 5.14 shows three cycles up the ramp (see Figure I.9 for full results). The force characteristics up the ramp are similar to those on the flats. Figure 5.15 Downhill Run with Grip Tape at CRREL Step 1 Step 2 Step 3 Downhill Gliding Transition to Flat
The force signal showed bumps similar to gliding. 5.3.3 Day 2-5 Tests Since there was a lot of noise in the microphone signal, and testing of the initial logic failed to produce a pulse of the PETB, it was decided that the microphone and load cell logic as described above (Figure 5.12) should not be used in real skiing. The microphone control logic was cut from the DTMF program, and the load cell’s buffer was increased to 40 milliseconds in an effort to compensate. The software was set up such that it would still monitor the load cell and the microphone, but would only react to the load cell’s signal. When the averaged buffer of that signal became greater in magnitude than a set threshold, the software would turn on the binary output as discussed above. When the averaged buffer of that signal became less than the set threshold, the software would change the binary value to 0, meaning no pulse. Since this simplified algorithm produced the desired results, it was concluded that the microphone was not necessary for proper control. Also, the ambient temperature in the cold room was raised to -10 degrees Celsius . 5.3.3a Test Settings Overview Many tests were run using the load cell’s signal to switch on the PETB (see Appendix I). The skier wore the DTMF-controlled ski on the left foot. On the right foot, the skier used either a mechanically enhanced ski (with plastic “scales” (see Figure 1.6)), or a ski that was outfitted with the original mechanical switch (see Appendix B). These two options provided qualitative and simultaneous feedback of the relative performance of the DTMF controlled ski. All tests (except where otherwise noted) consisted of movement first on the flat terrain, then up the incline, ending at the top of the ramp.
the DTMF software and DTAFM hardware to control the PETB ski were somewhat successful. The threshold for switching on the PETB was set qualitatively. The threshold was set at some arbitrary level and the skier would press his weight onto the controlled ski. If that threshold seemed too high or low, the level would be reset on the controlling computer to compensate until the skier was satisfied with the switching level. The three major tests that were recorded using the above method for calibration can be found in Appendix I (see Figures I.11 – 13). The computer controlled ski seemed to perform equal to either counterpart (counterpart as discussed in Section 5.3.3a) on the flat terrain, but failed in all attempts up the incline (i.e., it did not provide sufficient traction to maintain steady movement up the incline). The electronics used to power the PETB were such that they allowed several energy dissipation levels. In an attempt to isolate the PETB’s failure on the incline, several energy levels were tried in unrecorded attempts to move continuously up the incline. All attempts failed to make it up the incline, and had no change in results on the flat. 5.3.3b.1 Downhill Results One very positive and unexpected result came to light during this set of tests performed. Several of the above mentioned tests were performed with the skier wearing both skis outfitted with the PETB (one controlled by the DTMF software, the other by the original mechanical switch). When the skier glided down the incline, it was noticed via the bright LEDs (installed to indicate switching on of the PETB (see Figure 4.4)) that the ski with the mechanical switch pulsed several times and very erratically on the way down. The DTMF controlled ski did not pulse at all.
2 group of tests showed that there were some abnormalities in the results (see Section 6.3.3). It was determined that a more comprehensive and quantitative calibration sequence should be developed in order to achieve better results. The calibration sequence decided upon consisted of the skier first lifting the controlled ski off of the ground to get a zero weight level. The skier then stood on the ball of his foot to get a full body weight reading. The threshold was then calculated from the calibration data and set via the laptop computer that was affixed in the backpack (see Figure 4.6). The skier then skied and the data was recorded. The next set of tests used the calibration method, as discussed above, was much more successful than those from Day 2 (see Appendix I for full results). The threshold for switching on the PETB was set around 100 percent of the skier’s body weight (see Table 5.1). Although the PETB ski did perform better on the flats than in the previous set of tests, it still failed to provide continuous movement up the incline. 5.3.3c.1 Manual Testing In order to see how much snow was sticking to the electrode (see Section 2.1.3) and if that was affecting movement up the incline, control of the PETB was transferred from the DTMF software to manual switches that pulsed when the skier pressed a button. When the skier put his weight on the ski, pressed the button (pulse was confirmed by flashing of the LED on the ski (see Figure 4.4)), and lifted his foot perpendicular to the plane of the snow surface, there was significant build-up on the electrodes. When the skier put his weight on the ski, pressed the button, slid his foot back and forth on the snow, and then lifted his foot perpendicular to the plane of the snow surface, there was no significant build- up on the electrodes.
traction could be gained on the incline using the manual switching technique. The skier, using the railing to the side of the ramp, put his weight on to either foot (he was wearing both skis fitted with PETBs controlled by manual switches) and pressed the button to signal a pulse. The skier then lifted his foot perpendicular to the surface of the snow, stepped further up the incline and pressed the button. The skier was able to make his way up the ramp easily so it was determined that snow adhering to the electrode was not the cause of failure on the incline. 5.3.3d Day 4 Tests Another set of tests was conducted in which the threshold was lowered further from those mentioned above. The threshold was set to around 70 percent of the skier’s body weight (see Appendix I for full results). The controlled PETB ski seemed to perform much better than during any of the previous attempts on the flat terrain. A few steps worked on the incline (although there was no continuously working traction provided up the incline). The threshold was tested at some lower levels (40-60 percent of body weight). The lower level tests were not completed nor recorded as the lower levels caused pulsing during gliding. 5.3.4 Day 6 Tests It was determined that the stiffness of the ski may have been the cause for the ski’s failure on the incline. The stiffness of the controlled ski was reduced by making two thin cuts on either side of the boot perpendicular to the length of the ski. It was quite easy to notice a difference in the stiffness just by pushing with one’s hand on the ski: it took much less force to press the ski flat against a solid surface. The first recorded test of the ski with reduced stiffness was very successful. The threshold was set near the original tests (130 percent of the skier’s body weight). The skier was able to make it up the incline with just a few slipped steps. Next, the threshold was set
he was able to move continuously up the incline with no slipping. Figure 5.16 Successful Control of the PETB at CRREL Figure 5.16 has the same axes as Figure 5.2 and shows a step before the hill, a glide into the hill (the transition to moving up) then two steps on the hill (see Figure I.10 for full results). The test was repeated several times without recording (at the same threshold of 80 percent) in order to confirm successful climbing up the incline. Every run was successful and provided strong traction up the incline. Step 1 Step 2 Step 3
results has been collated into a table as follows (see Table 5.1). True True Glide Kick Threshold Max Force Time Time Description Figure f/u (BW) (BW) avg (ms) avg (ms) Salzburg Data 1.2 u x 2.0 360 220 Shuffling on Flat with Grip Tape I.8 f x 1.7 449 326 Skiing on Flat and Hill with Grip Tape I.9 f x 1.8 396 317 Skiing on Flat and Hill with Grip Tape I.9 u x 1.7 178 390 Downhill with Grip Tape 5.15 d x 0.8 x x Day 2 -- Skiing on Flat Only I.11 f 1.20 1.7 712 392 Day 2 -- Skiing on Flat and Hill (1) I.12 f 1.50 2.3 387 360 Day 2 -- Skiing on Flat and Hill (1) I.12 u 1.50 1.8 162 758 Day 2 -- Skiing on Flat and Hill (2) I.13 f 1.45 2.4 397 357 Day 2 -- Skiing on Flat and Hill (2) I.13 u 1.45 1.7 209 695 Day 3 -- Skiing on Flat and Hill (1) I.14 f 0.95 1.7 808 356 Day 3 -- Skiing on Flat and Hill (1) I.14 u 0.95 1.2 x x Day 3 -- Skiing on Flat and Hill (2) I.15 f 1.10 1.4 716 482 Day 3 -- Skiing on Flat and Hill (2) I.15 u 1.10 1.1 x x Day 3 -- Shuffling on Flat I.16 f 0.85 1.6 x x Day 4 -- Skiing on Flat and Hill I.17 f 0.72 1.7 638 432 Day 4 -- Skiing on Flat and Hill I.17 u 0.72 1.2 x x Day 6 -- Skiing on Flat and Hill (1) I.18 f 1.30 1.5 705 470 Day 6 -- Skiing on Flat and Hill (1) I.18 u 1.30 1.3 227 935 Day 6 -- Skiing on Flat and Hill (2) I.10 f 0.81 1.9 550 281 Day 6 -- Skiing on Flat and Hill (2) I.10 u 0.81 1.9 139 384 Table 5.1 Collated Ski Test Data In Table 5.1 (see Table I.1 for full table), the tests have been separated into two portions: those skied on the flat terrain (f) and those on the incline (u). Maximum force applied was taken as the average of the recorded peaks. Body weight was either recorded, or calculated from the original calibration. The switching level was recorded during testing. Kick and glide times were averaged over two or three typical cycles (depending on how many were available). Some results were not summarized here as the data was either inconclusive or did not provide enough cycles to make an average. “Salzburg Data” refers to the data presented in Figure 1.2.
tests leading up to the successful implementation of the PETB control algorithm have been detailed in the previous section, it is necessary to discuss further several key points and decisions that directed testing. 6.2 Carpet Tests For the original testing on carpet, several sensors were placed on the ski. After developing some ability with the DTFM software, it was necessary to research, acquire, and modify sensors for data acquisition. The carpet tests were necessary to streamline the system as much as possible in order to save time and effort.
performed in an effort to determine which sensors would work well within the system and parameters available. The shuffling on carpet test as seen in Figure 5.2 shows a repeated signal similar to that of the known data for kicking and gliding. It was decided that the load cell could be used in the on-snow tests. It provided a regular and clear signal of the force that was exerted upon the ski by the skier. 6.2.2 The Accelerometer It was originally thought that the use of an accelerometer would be worth investigating. Although they are quite expensive, accelerometers have very small packages and can be completely sealed for waterproofing in a final product. It was also predicted that the data received from the accelerometer would be difficult to interpret. The testing on the carpet of the accelerometer (see Figure 5.4) showed two very complicated signals. It would have required quite a bit of analysis to properly interpret the signals. This information proved to not be useful and in an effort to keep the system as simple and inexpensive as possible, it was decided that the accelerometer should not be investigated further. 6.2.3 The Microphones From the many varieties of microphones available, the two chosen to test were the easiest to implement. Either microphone would require some amplification circuitry, so that was not a factor in deciding which one to use. However, the condenser microphone required power from the DTAFM and would require power in the final design. The piezo microphone needed no direct power source (see Appendix E.4). Although the power requirement added to the decision against the condenser microphone, the choice between the microphones was made mostly upon the testing results as presented in section 5.1.3. The results show a much
during sliding on the carpet and snow with the piezo microphone. There was some trouble getting the piezo microphone and the load cell to work simultaneously with the DTAFM. There seemed to be some bleeding of the microphone signal into the load cell signal. It was determined that this was most likely occurring because they shared a ground (see Appendix G.1) and the voltage from the piezo element was more than two orders of magnitude larger than that of the load cell. With some modification of the internal gains used by the DTMF software, the noise was kept to a minimum. It was necessary to have a clear signal so that any noise created by the ski sliding on the snow could be detected. As shown in Figure 5.8 and 5.10, it was determined that the piezo microphone and load cell could be used simultaneously on snow to detect the force exerted by a skier and whether or not the ski was in motion. 6.3 Testing at CRREL The on-snow tests conducted at CRREL led to proof that the PETB could work very well. Elements to contain large quantities of snow had to be fabricated and put in place, and snow had to be made. The technicians at CRREL made snow over a period of two days to provide sufficient cover and mass so that there was a base of at least 6 inches of snow throughout the length of the trail. In typical cross country ski racing (and in recreational preset trails), a track is fabricated by a “track setter.” A track setter is a sled that travels behind a snowmobile or other pulling tractor, compacts snow, and sets tracks in which each individual ski travels. In order to mimic such conditions, large back country skis were used to compress the snow and direct the track since they had surface width similar to a track setter.
the ski using the “Start” brand grip tape for traction showed that the sensors could function in a real skiing situation. Since the skis worked quite well on the flat and the incline, we had a benchmark against which to test the PETB and its control. The taped skis showed similar characteristics up the hill and on the flat terrain in that the maximum force exerted by the skier was nearly equal in both regions (see Table I.1). An interesting difference in the cycle between the flat and incline was that of the change in time allocated to the kick and glide portions of the cycle. The kicking time increased on the incline, and the gliding time decreased. There seemed to be some spikes in the force signal that occurred irregularly after pulses were activated. It was originally thought that these spikes were confirmation of the pulse. Several tests were performed in order to verify this theory. In a stationary position, the PETB was activated by exerting force on the load cell via the boot (just as in skiing), and data was recorded. The test was conducted with several different buffer times (20 – 80 ms) and various different threshold values (50 – 120 percent of body weight). The spikes appeared irregularly (not with every pulse indicated by the LED) and at irregular intervals (a different time after the threshold was surpassed). It was concluded that the spikes could not be relied upon for any accurate data positioning. 6.3.2 Days 2-5 Tests Overview It was unclear whether or not false pulsing would be eliminated by cutting the microphone from the pulse control algorithm. It was known that the power electronics had a minimum time of 500 milliseconds between pulses. This time was needed to charge the capacitors that dissipated the pulse of energy to the PETB electrodes. Since the kick cycle had proven to be, in its entirety, less than 500 milliseconds (see Table 5.1) and a threshold was exceeded somewhere in the first half of the cycle, there was only one pulse per kick.
useful in proving that an algorithm that did not use the microphone could work properly. As the skier glides downhill his heels lay flat on the ski. Although this distributes weight evenly throughout the boot (see Section 4.3.3), we could not use a force sensor in the heel of the boot as a simple on/off sensor. The force exerted by the skier continues to rise for a period of time beyond having his heel off of the ski (see Figure 1.2); the heel picks up from the ski just as the dip in force occurs between gliding and kicking. If a sensor in the heel were used, there would be no force exerted on it as soon as the heel lifted from the ski. The moment that the PETB needs to be turned on is some time after the heel is lifted. It is therefore necessary to measure the force exerted under the ball of the foot. As seen in Figure 5.15, with the skier gliding down hill using the “Start” grip tape, the force applied to the load cell during gliding down hill only rises above 80 percent of the skier’s body weight for very brief moments. With the buffer set to average the load cell’s signal over a designated time period, any bump that produced force in excess of the threshold would have to exist for a time longer than that time period. Several settings for the buffer (10 ms – 80 ms) were tried. Those below 40 milliseconds permitted false pulsing in gliding. Those above 40 ms did not properly activate the PETB when skiing. Thus, false pulsing on the downhill gliding had been eliminated with the buffer set to 40 milliseconds. Similar bumps in exerted force may occur during cornering and other downhill maneuvers. Further field testing with a final product is necessary to ensure that false pulsing does not occur with these bumps. Some adjustment to the buffer time may be requisite in order to prevent false pulsing. Since the PETB does not work well at velocity (see Section 2.1.6), false pulsing in downhill situations would not be a concern in terms of performance. The main concern would be the loss of power from batteries. In a final product, the duration over which the batteries would last would most likely be a critical selling point.
of tests resulted in may problems. One obvious issue was the drifting of the baseline of the load cell. It was originally thought that the cause may be some variation of its internal strain gauge due to the cold ambient temperature. Upon consulting with the manufacturer of the load cell, it was discovered that we had received the wrong range cell. Rather than the 2.2 kilonewton model that had been discussed during prior phone conversations, we received the 1.1 kilonewton model. The manufacturer insisted that temperature would not affect the cell, as there was a temperature compensation circuit attached to the cell, and that the drifting in baseline came from some overloading of the cell. They assured us that the load cell would still be accurate relative to itself (meaning that it would still respond with 1 millivolt for every 350 newtons of force) and the baseline would just drift every time that the cell was excited with a driving voltage. They also insisted that the load cell had a response past 1.1 kilonewtons, and could still be used. It was determined that we should follow the manufacturer’s recommendations and continue testing with the load cell in hand. In order to normalize each test, the calibration sequence as described in section 5.3.3c.1 was developed. Another problem with the results from the Day 2 group of tests was that the maximum force exerted was higher than any previous results (see Table 5.1), while the friction felt by the skier was less than with the “Start” grip tape (meaning that he slipped often and did not move forward as easily). It was determined that the load cell was functioning and that its use should continue. It was thought that there may have been a short circuit somewhere in the system, or that some other minor electrical mistake caused problems. The sensors were removed from the ski and cleaned. The electronics were cleaned thoroughly. The entire system was put back together and sealed (waterproofed) for the next set of tests.
components of the ski cleaned, reassembled, and sealed the maximum force exerted by the skier was closer to what was expected based on the original tests with grip tape and the data seen in Figure 1.2. Even though the threshold was lowered and significant friction was felt by the skier on the flat terrain, the ski did not function well on the incline. Pulsing was observed by the skier via the bright LED that was on the ski (see Figure 4.1). Since the abnormalities in the sensors as discussed previously were eliminated, it became clear that the reason for the ski’s failure on the incline was most likely not a function of the algorithm. Therefore, it was determined that testing for an ideal threshold should continue, but mechanical issues should be explored as sources for the failure. The first mechanical issue to be investigated was that of “icing” (see Section 2.1.3). Icing refers to the build-up of ice and snow particles on the PETB electrode surface. Icing was thought to be the main problem in field tests conducted with the original mechanically switched PETB ski. If the ski is lifted directly from the surface, a mass of snow may still be attached to the electrode. It was thought that this mass would prohibit the electrode from making contact when placed on a fresh patch of snow and thereby cause failure of the PETB. During testing, it was noticed by the skier (and later confirmed by the testing (see Table I.1) that gliding time was significantly diminished, if not eliminated. He felt that he was stepping his feet as one would on stairs rather than gliding as he did on the flat terrain. It was thought that lifting the foot rather than gliding, therefore causing icing to occur, may have been the source of the failure. The tests using the manual switching of the PETB (see Section 5.3.3c.1) confirmed that icing did occur with perpendicular movement of the foot, and was wiped off by gliding. However, the tests also showed that icing did not prohibit movement up the incline when moving very slowly.
source of failure on the incline may have been that the threshold was too high. A test was run with 72 percent body weight (see Table I.1) which worked well on the flat. There were a few good steps on the incline, yet the ski failed to move continuously up. Since this lower threshold seemed to work better on the incline (although quite erratically), it was determined that lower thresholds should be tested. The threshold was set at several levels below 70 percent of the skier’s body weight. All attempts at moving up the incline failed and the PETB pulsed (as noticed via the bright LED and on the laptop’s screen) during gliding. As discussed above, this would be unacceptable in a final product, as it would cause a significantly shorter battery life. Although tests with lower thresholds were unsuccessful, it was useful to know the range in which the threshold could be set to properly trigger a pulse. The width of this range would determine the accuracy necessary for all of the components in the final product. For flat terrain, the upper limit was tested in the Day 3 tests (around 110 percent (see Table I.1)). The lowest threshold that provided friction on the flat terrain without pulsing during gliding was just below 70 percent of body weight. 6.3.6 Day 6 Tests The next mechanical issue to be investigated was the flex of the ski (or stiffness). The flex of the controlled PETB ski was preset by the manufacturer at an unknown number of kilograms. The flex is measured by bringing two identical skis into contact with one another at their bases. The force required to make contact is referred to as the flex. The pressure in the center of the ski will rise sharply when the ski becomes flat (see Figure 6.1). The change in magnitude of force exerted by the skier to the pressure distributed through the base of the ski can be seen in the following figure.
of a Cross Country Ski [A] Figure 6.1 shows that the pressure in the center of the ski is not in direct proportion to the force applied at its surface. In this case, the center of the ski has no pressure (and thus no contact) until the force exceeds 750 newtons (around the body weight of our skier). At 1000 newtons, the center portion of the ski experiences less than 10 kPa. The pressure distribution throughout the ski used for testing was unknown, but it was thought that it would be similar to that seen in Figure 6.1. It was thought that the pressure distribution throughout the base of the ski would stay the same by lowering the flex. The only difference would be that the ski would become flat with much less force, thereby increasing the pressure on the PETB electrodes. The ski with a lower flex was first tested with the threshold set arbitrarily high. Since the ski made it up most of the incline with the higher threshold, it was determined that the ski should be tested through the range of thresholds to determine the best setting. The last test at 80 percent of body weight worked perfectly. All subsequent unrecorded tests were in the range of 70 to 80 percent of body weight. That was determined to be the ideal
the threshold should be set should be determined by the skier during field use and demands further investigation with a completed product. 6.4 Data Summary The collated data (see Table I.1) gives quantitative proof of the success of the controlled PETB ski. The tests run with the grip tape showed a maximum force exerted on the hill and flat nearly equal (the hill had 94 percent of the force on the flat). This means that the skier was able to get kicking friction on the hill nearly equal to the flat. This was a crucial benchmark against which our ski would have to perform. For all of the tests that were qualitative failures (Day 2 through Day 4 groups of tests), it can be seen that the maximum force achieved during the hill was much less than during the flat. 70 to 80 percent of the force exerted on the flat was observed on the incline. For the final successful tests, the force exerted on the hill was equal to the force exerted on the flat.
thesis has proven that the PETB can be controlled properly when (1) the force exerted by the skier under the ball of the foot is measured, (2) the signal from the sensor used is averaged over a preset length of time (a buffer), (3) the signal is compared to a preset threshold value, and (4) there is a method that allows for only one pulse per kick cycle. To those ends, recommendations shall be made for future iterations of the electronic cross country ski.
cell would be quite suitable for use in a commercially produced ski. It was tested to be quite accurate and reliable in cold temperatures when actuated properly (see Appendix D.2.2). It is simply a resistor that varies its resistance in inverse proportion to the load applied to it. Its thin profile would allow it to be easily placed in the space between the binding and ski without much supporting framework. It would not need complicated complimentary electronics and is quite inexpensive relative to the load cell used in the experiments for this thesis. (2) In order to prevent false pulsing of the PETB during the gliding experienced in the kick and glide cycle as well as in downhill movement, it is recommended that a buffer system be used when comparing the monitored force sensor signal to the threshold value. The signal from the force sensor should be averaged over a designated time period such as 40 milliseconds. That average value should be compared to the set threshold value. When the averaged value exceeds the threshold value, whatever logic is in place to switch on the PETB should be triggered. Doing so will not allow any quick spikes in force during gliding, or bumps encountered in downhill movement to trigger the PETB, and thus save energy. Further testing of the time duration of the buffer should be conducted in a final product to ensure proper control of the PETB. It should also be taken into consideration that a skier may want the ability to alter this buffer as a means for more precise control of the switching algorithm. (3) Before a skier begins skiing with the controlled PETB ski, there should be some calibration routine that allows for the controlling electronics to realize his body weight. Then the threshold value can be set relative to the body weight. Some allowance for the skier to set the threshold in the range from 70 to 80 percent of his body weight should exist for better control of the PETB. Further testing should be conducted as to the best setting, which may depend of various conditions such as snow temperature, snow density, user fitness, etc.
only one triggered pulse per kick cycle. Since the signal from the force sensor will remain above the threshold for some time after it has first been exceeded, it is possible that there may be more than one pulse triggered. In the experiments toward this thesis, the required time to charge the capacitors (500 milliseconds) prevented a secondary pulse from being triggered: the power electronics were incapable of delivering a pulse before the signal from the force sensor fell below the threshold value. If, in future iterations, the power electronics do not have a similar time constraint, it will be necessary to ensure that only one pulse per kick cycle occurs in order to save energy and maintain adhesion to the snow. A simple binary logic algorithm could be used to solve this potential problem. A binary value should be initially set to zero. The PETB should only be triggered when two conditions exist as true: the threshold value has been exceeded, and the binary value is zero. When the PETB is triggered, the binary value is set to one. Once the signal from the force sensor falls below the threshold value, the binary value would then be reset to zero. This simple algorithm would prevent multiple pulses for each kick cycle. 7.2 Temperature Monitoring Although changing the energy dissipated through the PETB in relation to the snow temperature was not part of this thesis work, it will be necessary to do so for a properly working future product. A sensor should be mounted in the base of the ski so as to monitor the temperature of the snow’s surface. The energy sent to the PETB should be modulated based on the historical evidence of the frictional force versus energy dissipated as discussed in Chapter 2 of this text.
pulse deicing (braking) the heat diffusion lengths are typically much shorter than thickness of ice and a substrate, we consider infinitely thick layers of the materials: We will also split the problem into two parts: 1) Heating the ice/heater interface from T(0) to Tm =0C 2) Melting interfacial ice. In this case, let us assume that the interface temperature is maintained Constant =Tm Qualitative patterns of temperature distribution: 1) Before melting 2) During ice melting Interestingly, this is also a problem of "constant interfacial temperature" time-dependent heat exchange. But with different initial conditions. substrate material melted layer ice -d x 0 metal heater, t T T
a solution of problem no.1. After the heating power is "off", the melted layer refreezes. Released latent heat of ice melting plays a role of a heater. ! Then, the freezing time can be found from a well-known solution for a surface maintained at a constant temperature. But initial conditions are quite different. Solving Problem #1 We will first consider a simpler problem with a metal heater and ice layer only. The heater electric power is W. t is time d is heater thickness i is ice density i C is ice heat capacity h is density of the heater material h C is specific heat capacity of the heater material t x T T , (0) 0 -d x T 0 substrate melted layer ice d x metal heater T
x T T D x T (1) where i i i C D (2) Boundary condition t t T C d W x T Q h h i , 0 (3) Initial condition: 0 0 , T x T (4) Let us first consider a case of infinitely thin heating element: d=0. If W1 is a power flux into ice and W2 is a flux into substrate, then in ice [1]: D i Di i L x ierfc L W t x T 2 2 , (5) where LDi is a diffusion length of heat in ice: i i i Di C t L (6) where i is ice thermal conductivity, i is ice density, and i C is specific heat capacity of ice. If we introduce an equivalent thickness of heated layer, eq L , as: dx T t x T T T Leq 0 0 , 0 ( (7) Then: i i i Di eq C t L L 2 1 2 (8) To heat the interface by 0 T T T m degrees using constant power W: 2 1 W W W (9) would take time t:
i i C C W T t (10) where s , s , and s C are substrate density thermal conductivity and specific heat capacity respectively. Total energy requirement, Q, it takes to heat the interface to ice melting point is: 2 2 4 s s s i i i C C W T t W Q (11) Notice, that in eqns. (10) and (11) W and Q are given per unit area. One can also obtain the result of eqn. (11) by applying the energy conservation law: s eq i s i eq i i L C L C T t W Q . . (12) where i i i i eq C t L 2 . (13) and s s s s eq C t L 2 . (14) are equivalent lengths of heat diffusion in ice and the substrate correspondingly. The total energy requirement, Q, can then be found by solving eqn. (12) for pulse duration, t, and by multiplying the t by the power W. The result obtained in that way will, of course, be the same as in eqn. 11. When finite heat capacity of the heater-film and latent heat of melted thin layer of interfacial ice must be included in the energy conservation law, eqn. (12) becomes: q d T C d t C C T t W i i h h h s s s i i i 2 (15)
and h C are correspondently the heater film density and specific heat capacity, i d is thickness of melted layer of interfacial ice, and q is latent heat of ice melting. Equation (15) assumes that temperature varies with time and a-coordinate in accord with eqn. (5) (constant heating power applied to an interface). This assumption is not totally accurate for the fact that during the heating from 0 T to the ice melting point the heat flux to ice and substrate slowly decreases. Moreover, on reaching the melting point, the interfacial temperature gets tied to m T , thus changing the "constant-interfacial-power" problem to "constant- interfacial-temperature" problem. In the later case, an equivalent heat diffusion length in ice is: i i i eq C t L 2 1 . (16) which is in 273 . 1 22 times larger than in equations (13-14). This difference can be used to estimate maximum error of used approximation. Because the "diffused" heat is just a part of the total heat flux, the maximum error is always less than 27%, typically less than 10%, which provides sufficient accuracy for most of practical applications. For eqn. 15 a solution is: c b b Q 4 2 2 (17) where: q d T d C C W C C T b i i h h h s s s i i i 2 (18)
heat continues to diffuse from the interface. This heat flux is taken from the melted layer unless it disappears. Assuming heat diffusion lengths of eqns. 13-14 and applying the energy conservation law, we can easily arrive at the following result for the interface re-freezing time, tr " s s s I i i L s s s I i i L r C C t Q C C Q t 4 4 2 2 (19) where: q d Q i i L (20) and t is heating pulse duration: w Q t (21)
directly on the ski beneath the ball of the foot. It was actuated by the boot. A steel plate had been affixed to the underside of the boot so as not be destroyed by repeated stepping. Force exerted by the skier was transmitted through the boot to the top of the stainless steel plunger, which was constrained to move only on its central axis. The plunger was one electrical contact. The other was the plate. When the screw in the center of the plunger came into contact with the bottom plate (when the force exerted was large enough to cause that action), the resistance through the two contacts became quite low (mechanical contact). This was the “on” position that would trigger the power electronics to pulse the PETB. When the force exerted was below the set threshold (set by the central screw), there was no contact. The switch was then in the “off” position. The switch package was sealed to prevent any water leakage that might have caused unnecessary short circuiting.
from the University of Sport Science at Salzburg. The original text is in German, and the italicized text is a rough translation to English made via an online translation service (http://babelfish.altavista.com/).
data sheets as follows, the FlexiForce load cell has a laminated structure. It is made up of two layers of polymer that sandwich two layers of silver. As the load to the cell increases, the area of contact of the two silver patches increases. The resistance is, therefore, inversely proportional to the load applied. In talks with the manufacturer, it was conveyed that the load cell needs to be activated within the black ring that encircles the patches of silver (colored as beige on the cell). However, the stress to the polymer should not exceed 10,000 PSI. A “puck,” or small activation disc should be used to apply load to the cell that has a diameter such that it is large enough to distribute pressure under the 10,000 PSI limit, yet small enough to be within the black circle (diameter less than 9.5 millimeters. Such a setup can be seen in Figure D.1. Figure D.1 Example FlexiForce Load Cell Activation Setup
temperature types of FlexiForce load cells were obtained. It was suggested by the manufacturer that the high temperature version of the cell would operate more reliably at the cold temperatures in which we anticipated use (0 to -20 Celsius). The resistance of the load cell was tested versus load applied at room temperature and at various cold temperatures. FlexiForce High Temperature Load Cell Resistance versus Load at Room and Cold Temperatures 6 7 8 9 10 11 12 13 14 100 110 120 130 140 150 160 170 180 190 200 Load (lbs) Resistance (kOhms) -18C Room Temperature and -7C Figure D.2 FlexiForce High Temperature Load Cell’s Resistances versus Temperature
Room and Cold Temperatures 30 35 40 45 50 55 60 100 110 120 130 140 150 160 170 180 190 200 Load (lbs) Resistance (kOhms) Room Temperature, -7C, and -18C Figure D.3 FlexiForce Regular Temperature Load Cell’s Resistances versus Temperature As apparent in Figures D.2 and D.3, there was a shift in resistance at lower temperatures with the high temperature sensor. The resistance remained reliable with the regular temperature sensor. Hysteresis was not considered an important factor for the load cell. The force exerted by the skier needs to be accurately measured only as it rises (see 7.5).
results presented in Chapter 5 are magnifications of larger tests. Enclosed herein are the full results of each referenced test. A table of the collated results can be seen in Table 5.1 (brief) and Table I.1 (full).
Country Skiing (DRAFT),” in The Handbook of Sports Medicine and Science: Cross Country Skiing, edited by Heikki Rusko. Oxford, Blackwell Publishing, 2002, pg7. [2] Smith, pg 3. [3] Hall, William, Cross Country Skiing Right. San Francisco, Harper and Row Publishers, 1985, pg 26-7. [4] Hall, pg 18. [5] Hall, pg 20. [6] Hall, pg 53-63. [7] Petrenko, Victor F., “Systems and methods for modifying an ice-to-object interface.” PCT/US03/04170. 10 February 2003. (see Appendix A) [8] Petrenko, Victor F., Private communication. [9] Chen, Cheng, Private communication. [10] Smith, pg 4. [11] Smith, pg 8. [12] Smith (Interpreted from), pg 4. [13] Chen, John, Private Communication.
in the text were manufactured specifically for it. [A] Smith, Gerald A., “Biomechanics of Cross Country Skiing (DRAFT),” in The Handbook of Sports Medicine and Science: Cross Country Skiing, edited by Heikki Rusko. Oxford, Blackwell Publishing, 2002, pg7. [B] Unknown source, University of Sport Science at Salzburg (see Appendix C). [C] Smith, pg 3. [D] Smith (Adapted), pg 7. [E] Chen, Cheng, Private communication. [F] Chen, Adapted from private communication. [G] Smith, Adapted from pg 4. [H] Smith, Adapted from pg 26. [I] Adapted from U.S. Army: J. Gagnon (left); U.S. Army, B. Lyndes (right)
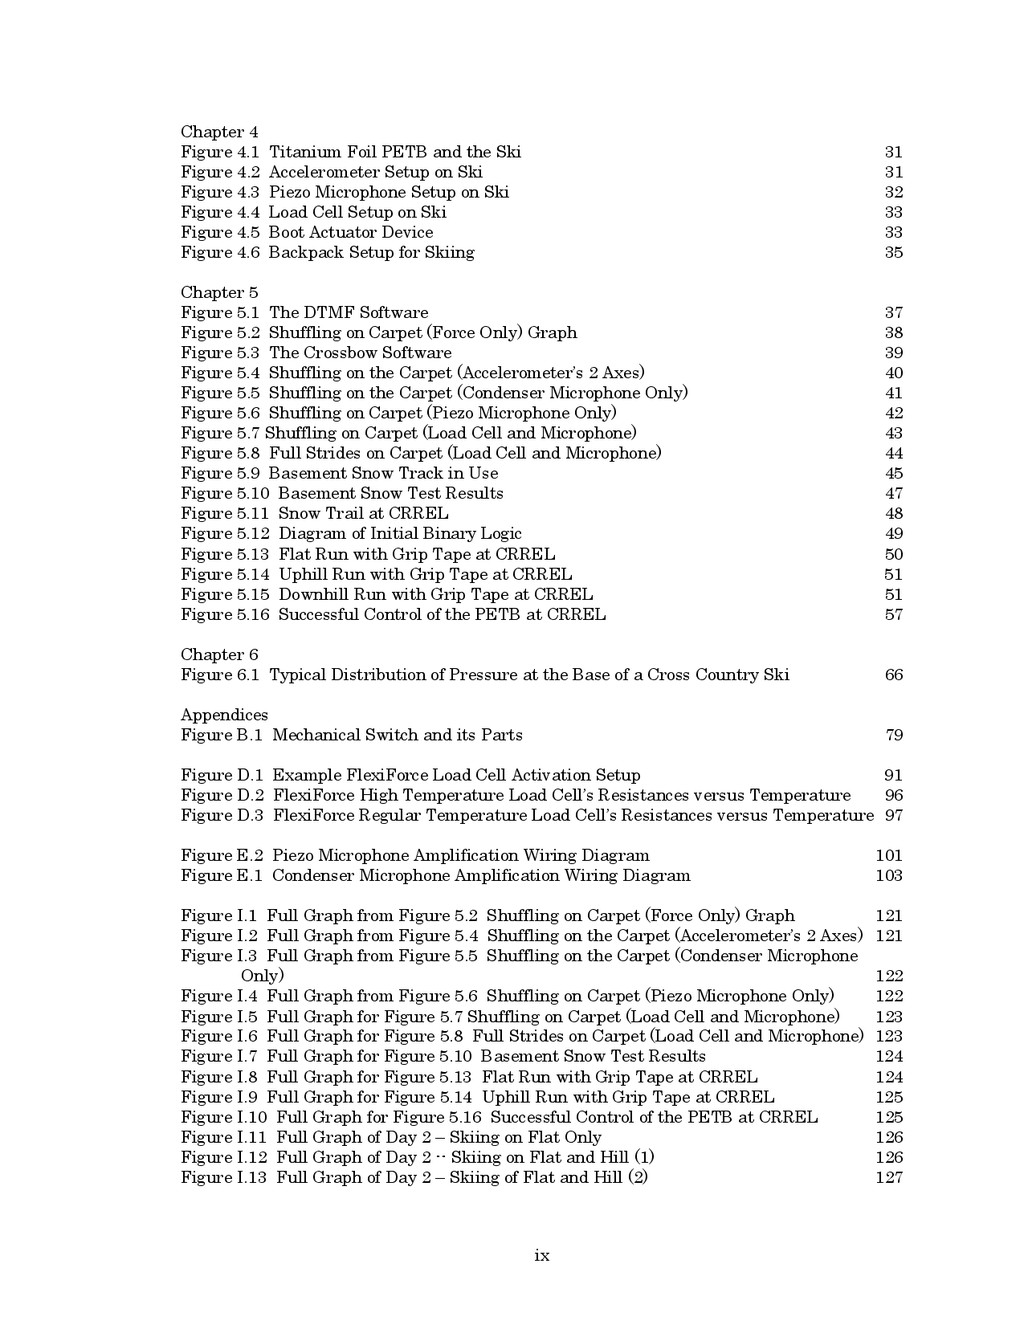
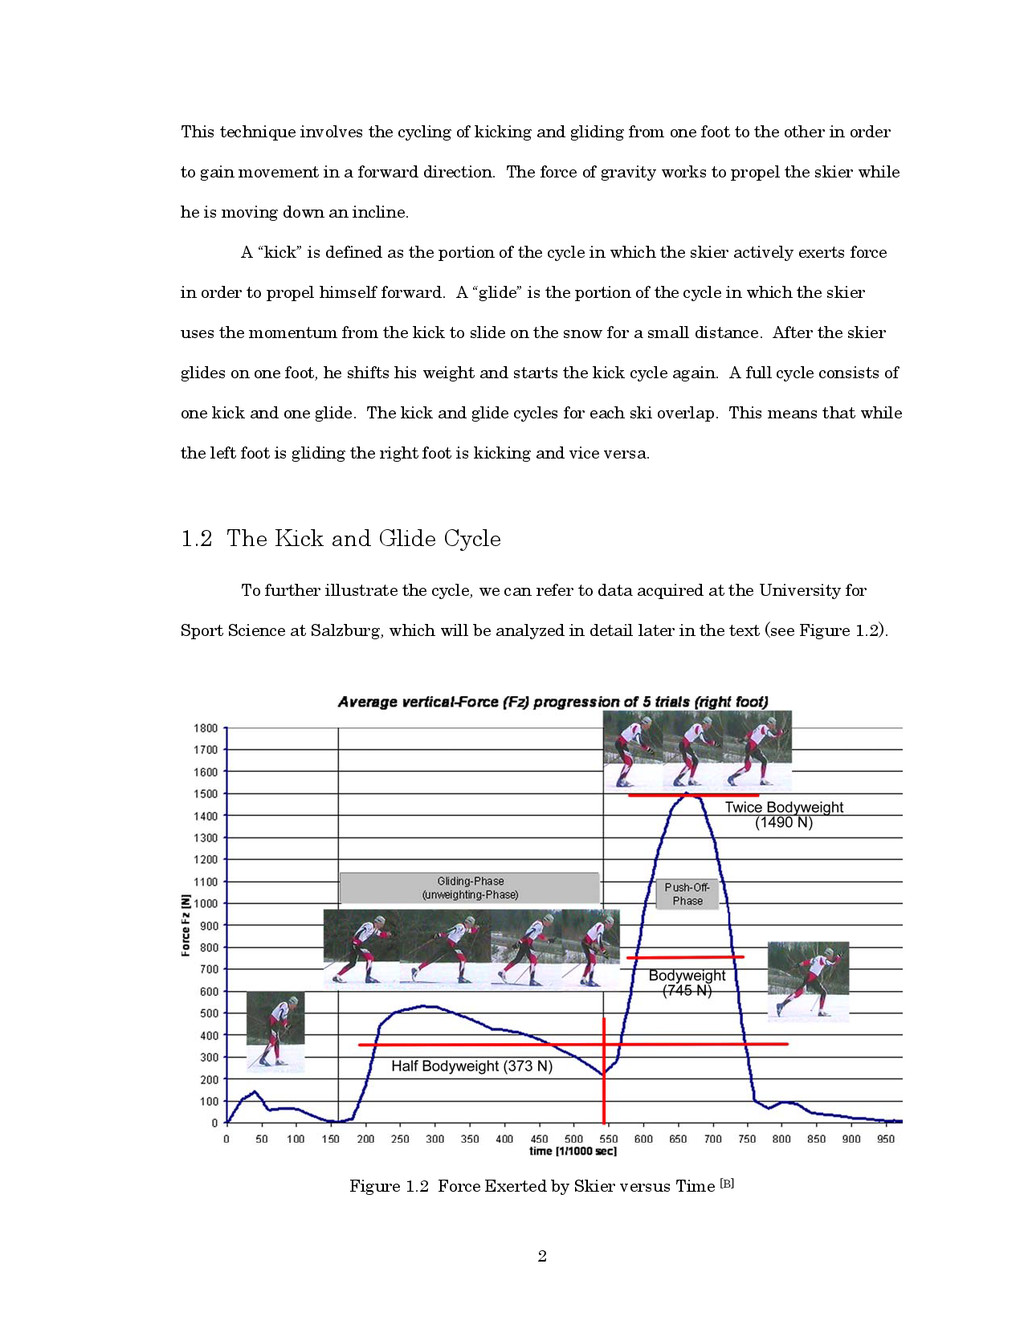
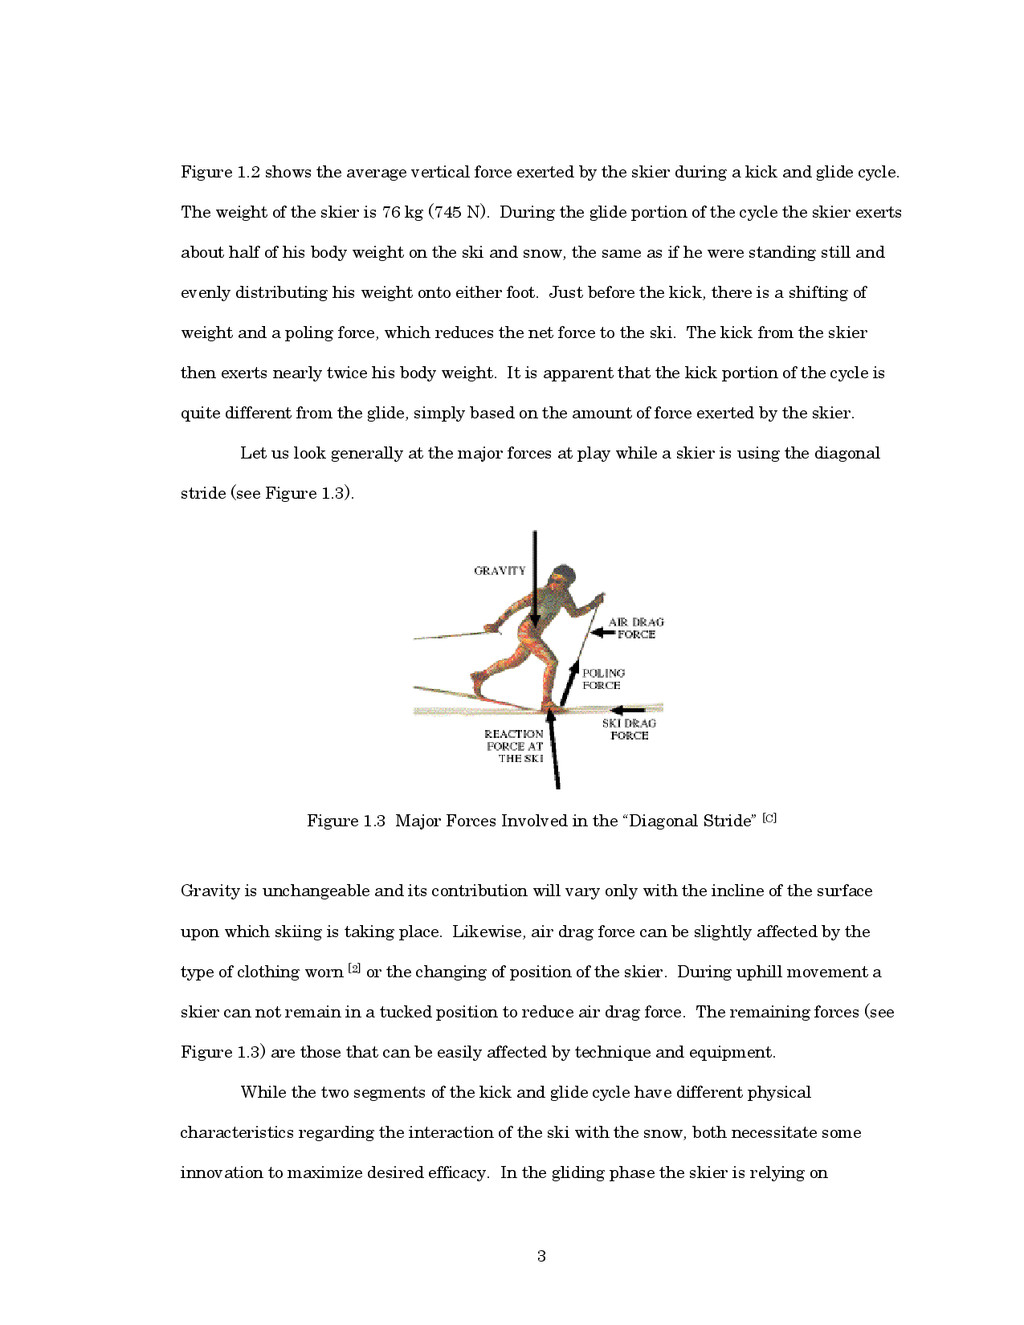
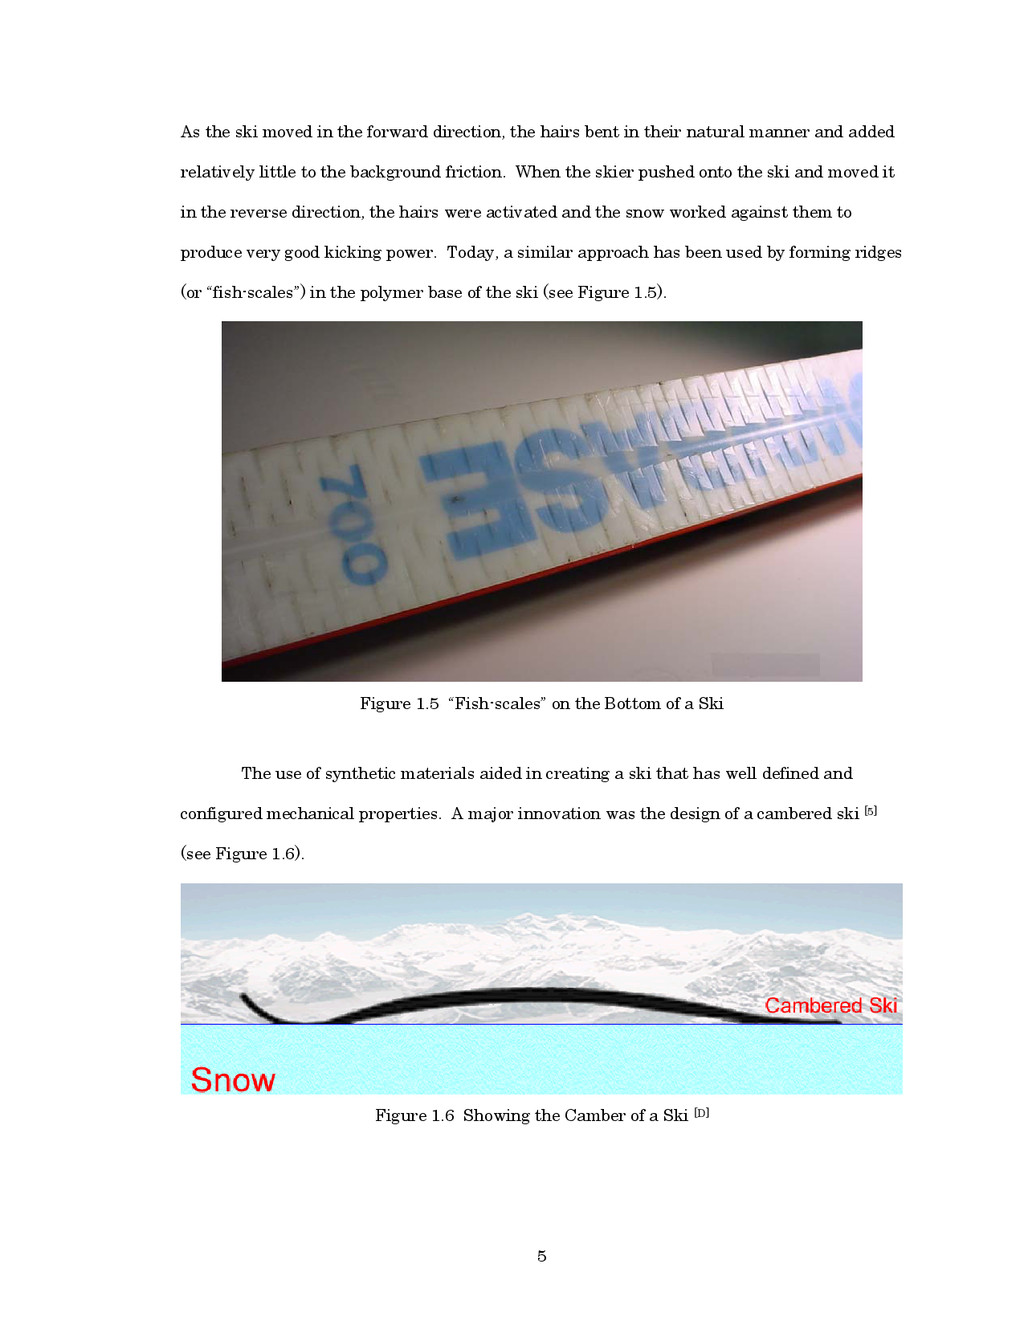
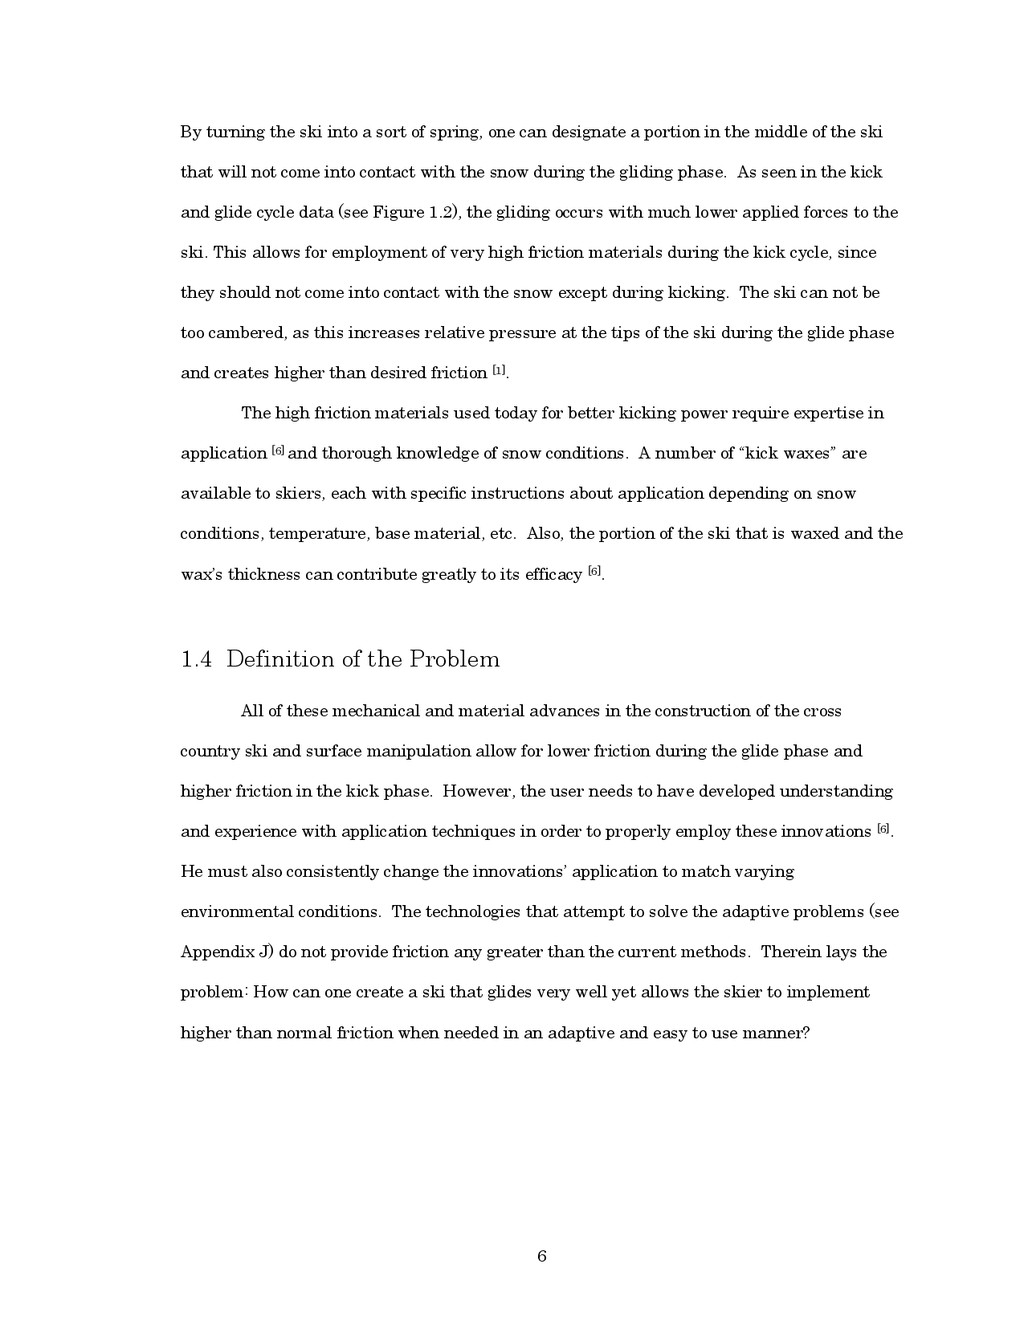
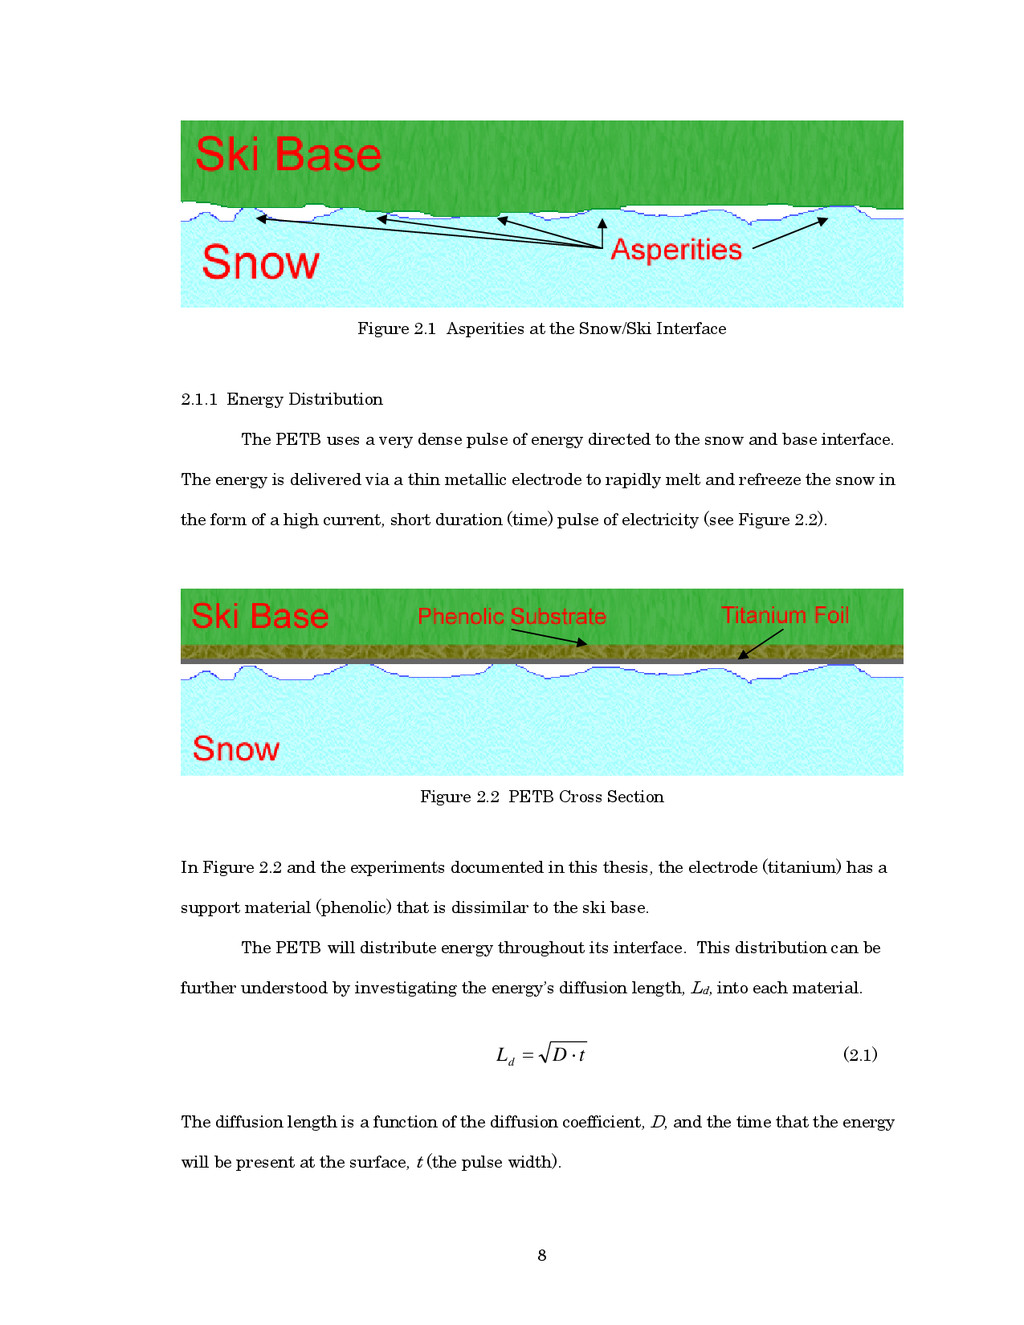
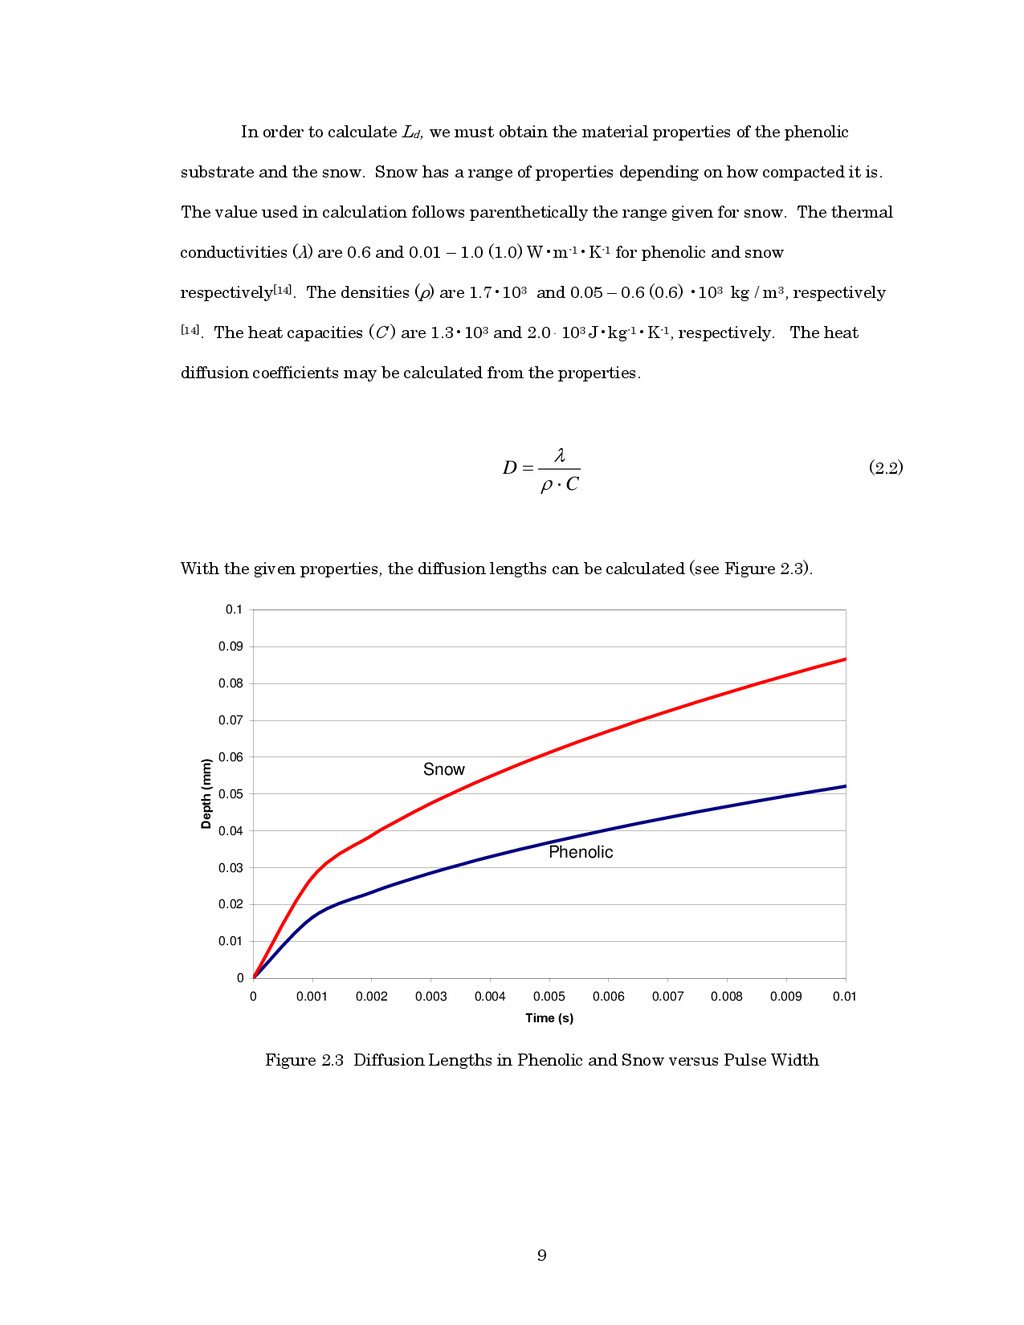
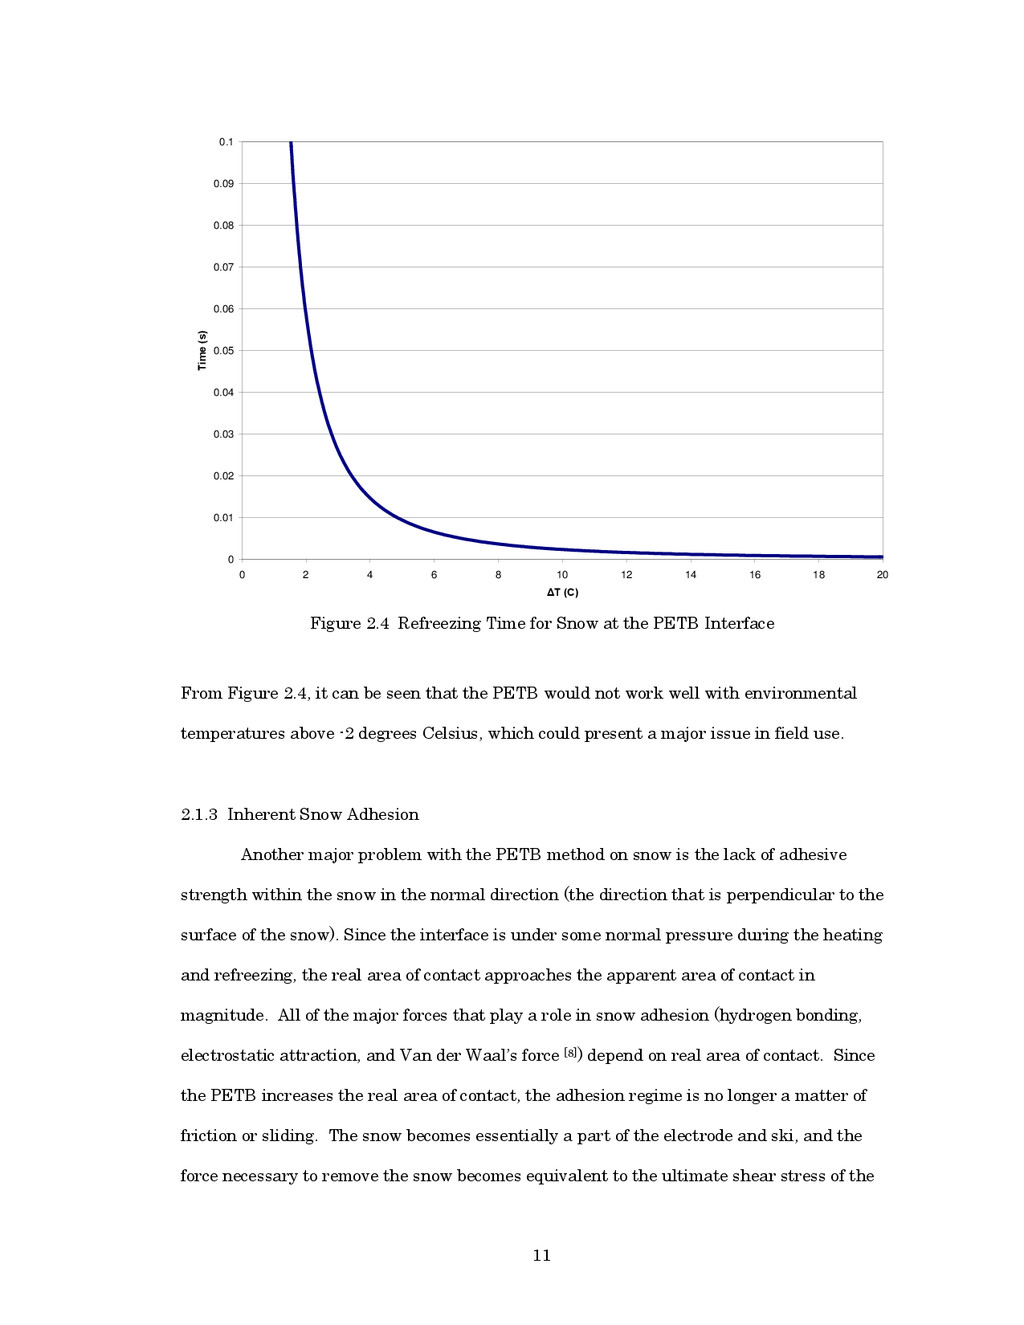
![12 snow itself [8]. Although the bonding to the electrode](https://files.speakerdeck.com/presentations/3f2ee4309668013157027e3205d19d29/slide_22.jpg)
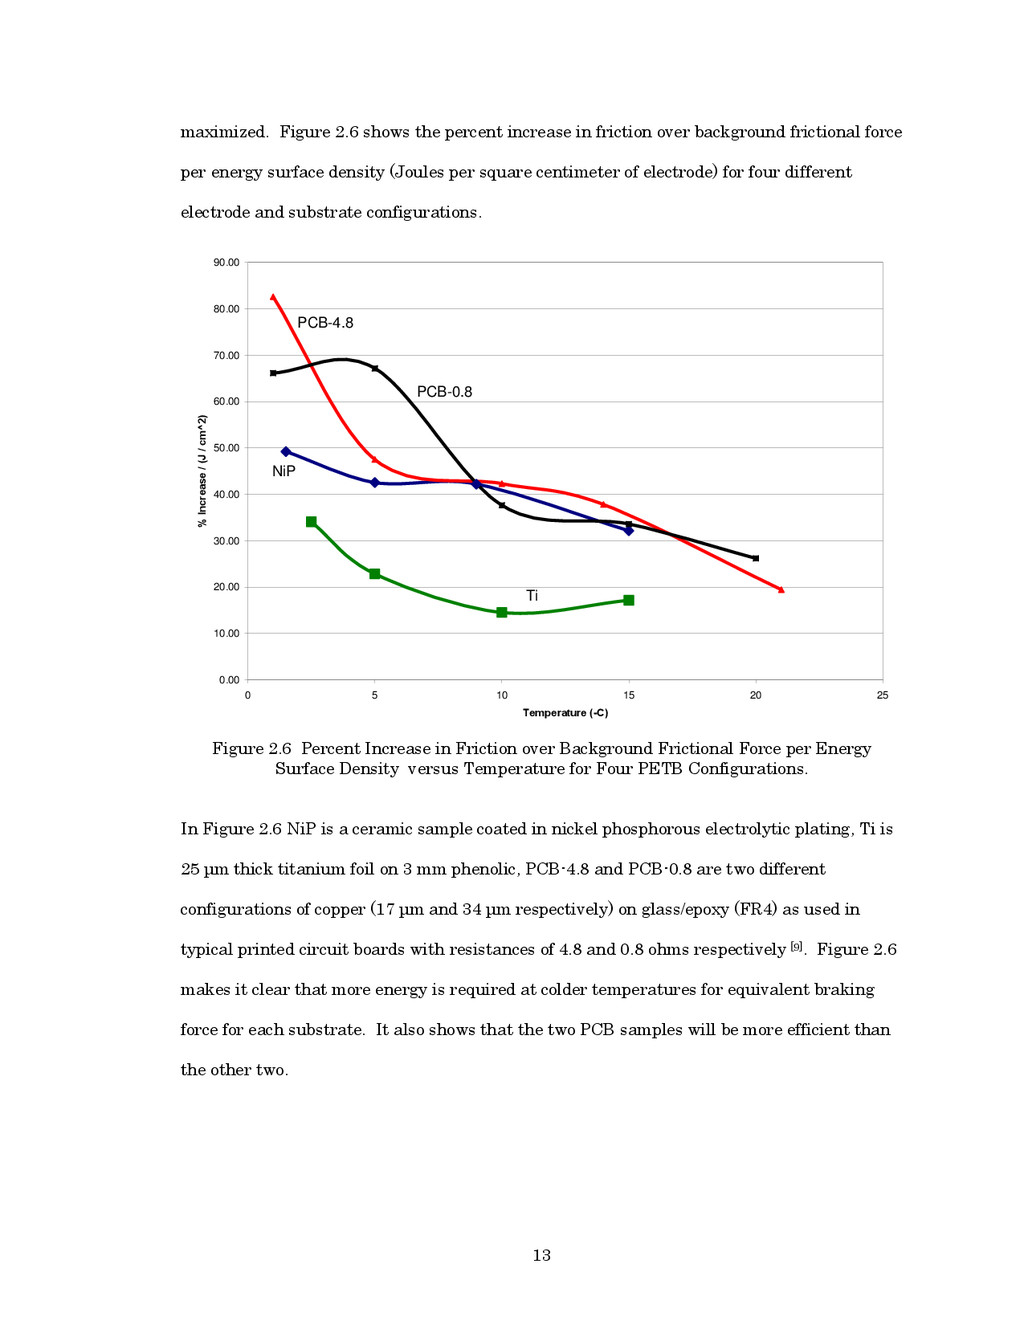
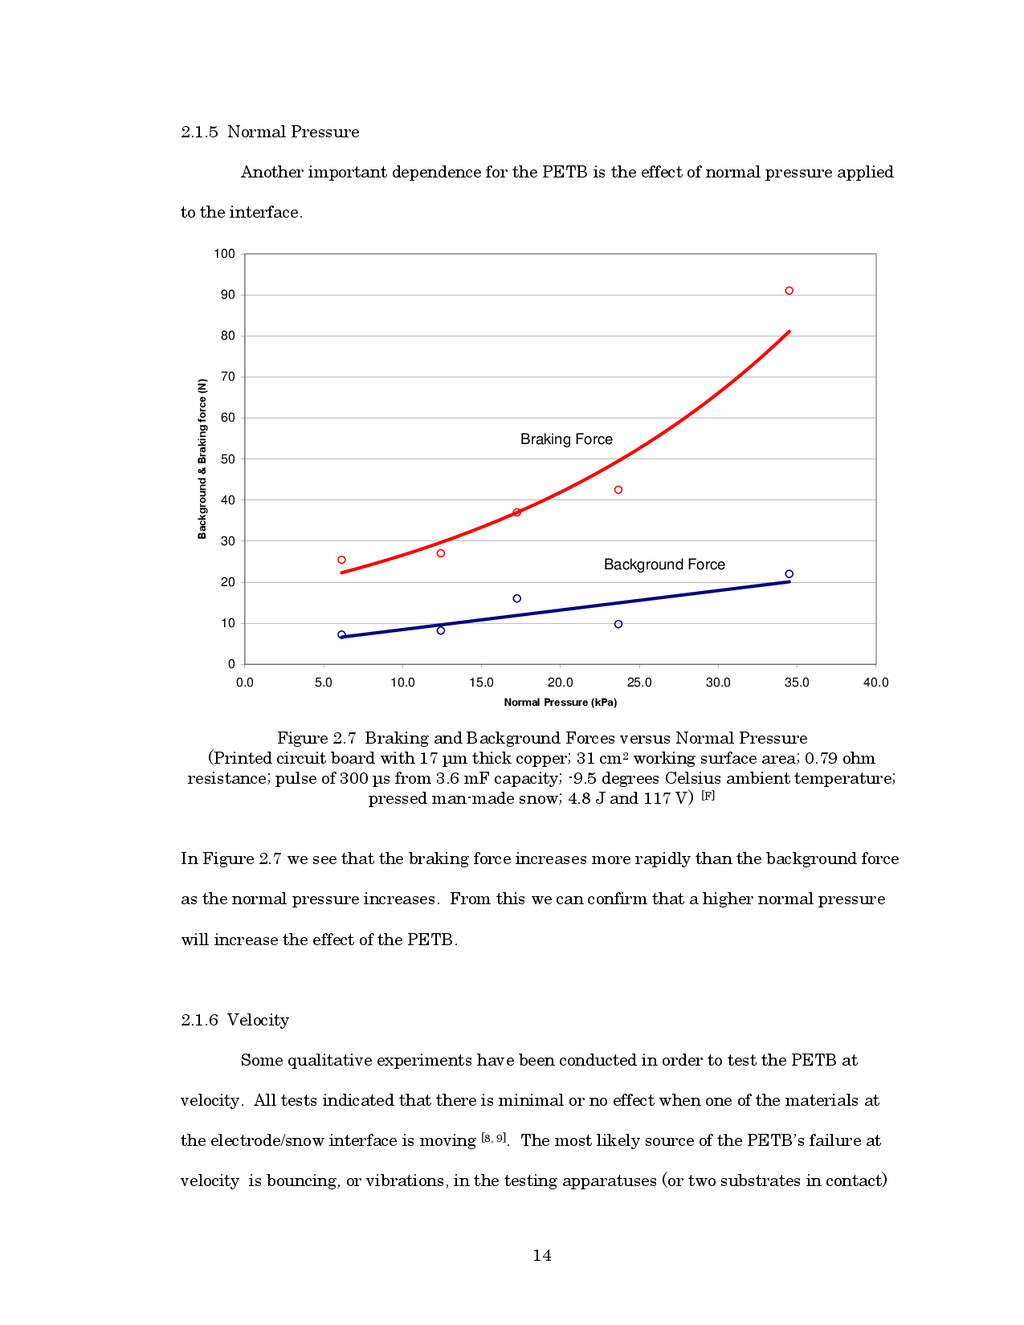
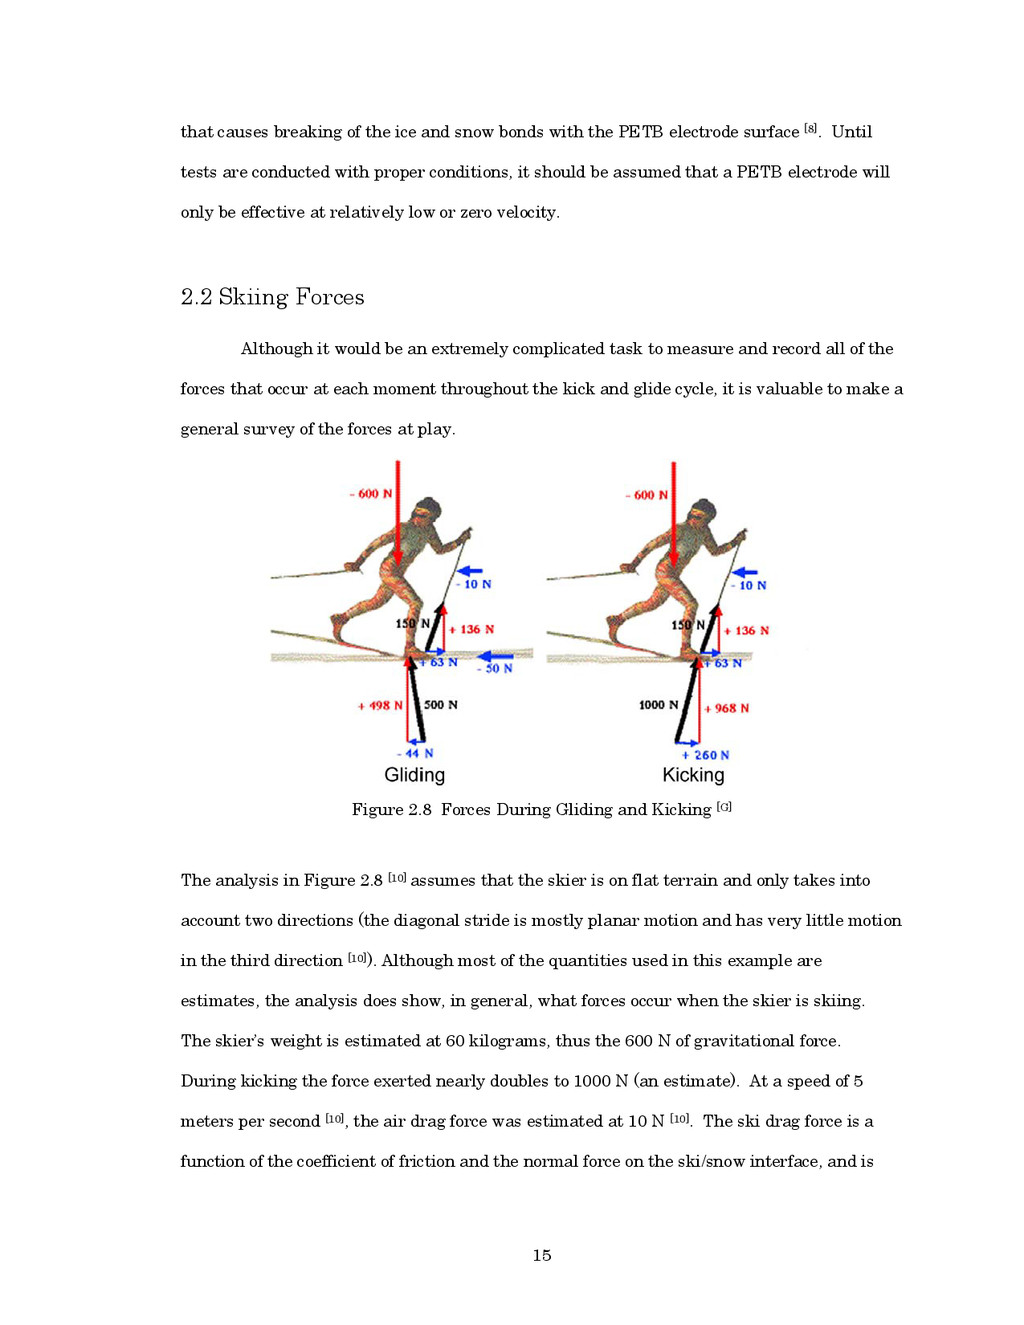
![16 estimated at 50 N [10] while the ski is](https://files.speakerdeck.com/presentations/3f2ee4309668013157027e3205d19d29/slide_26.jpg)
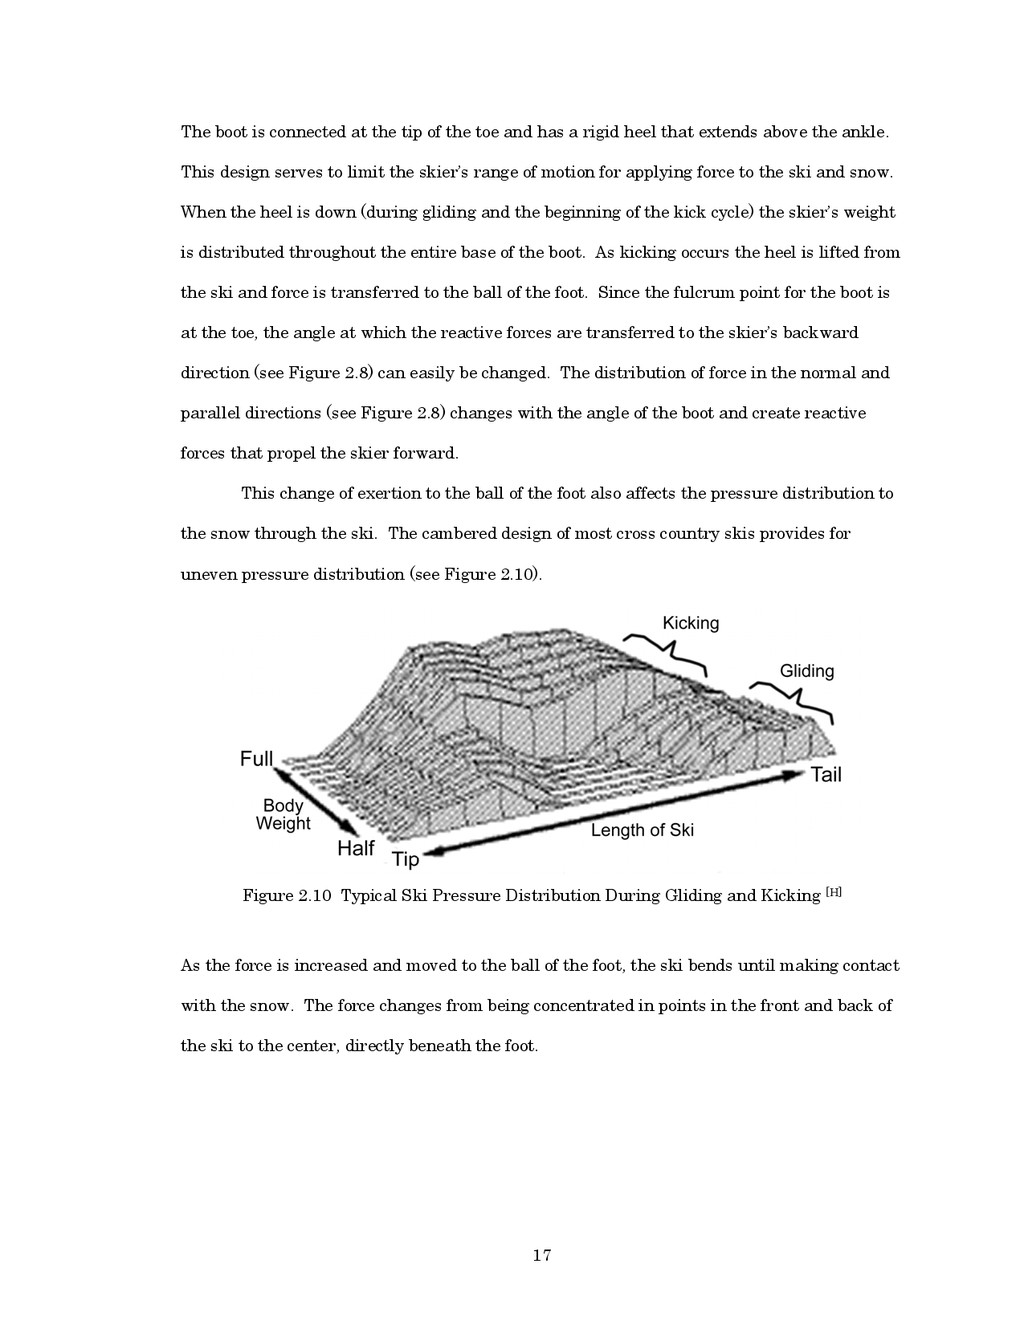
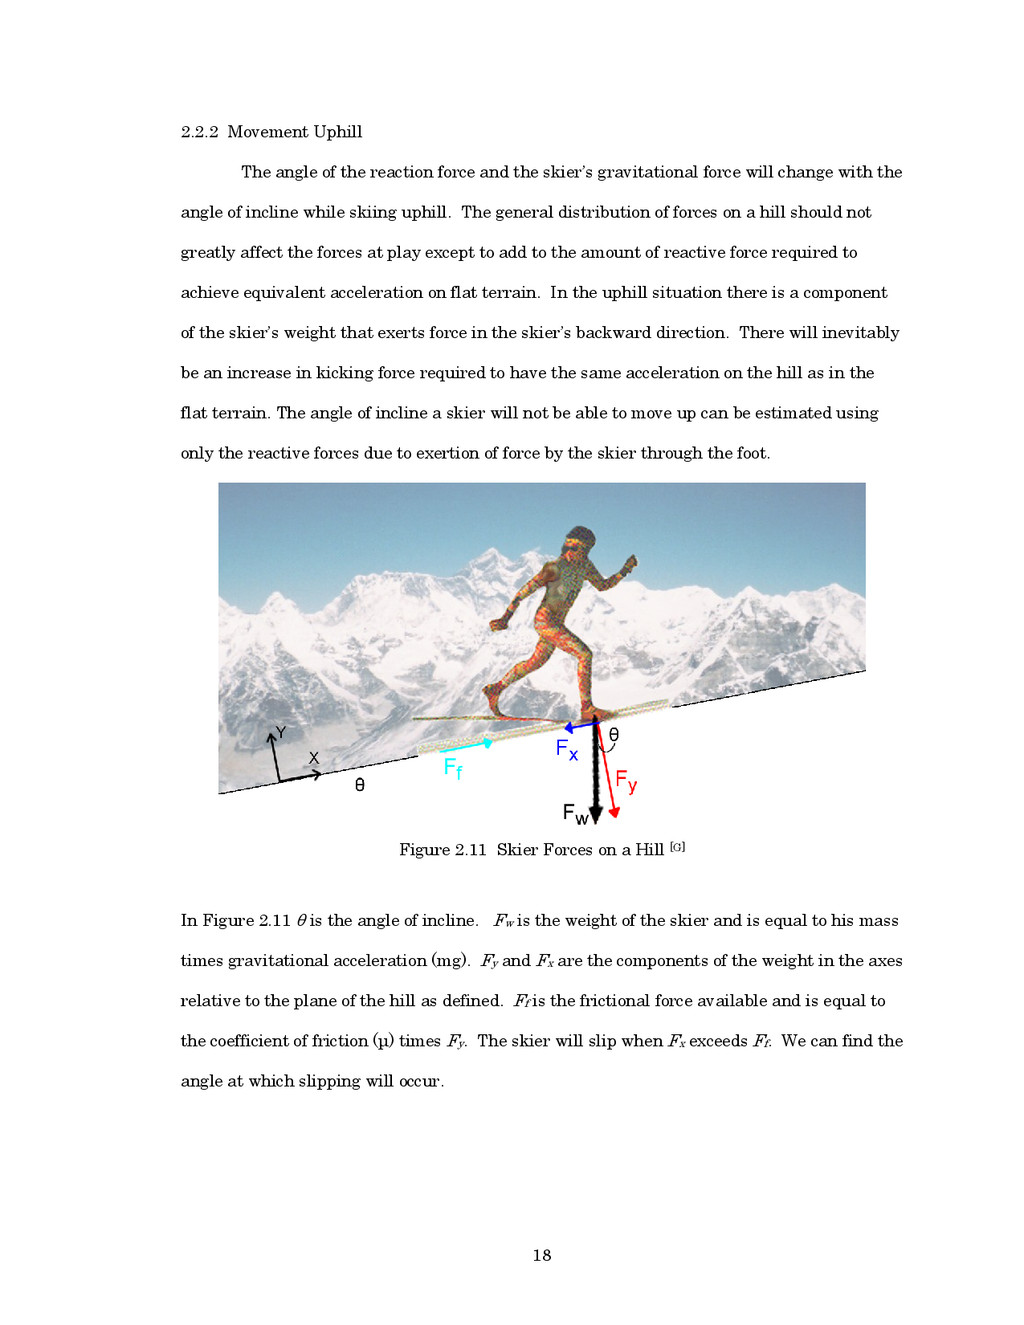
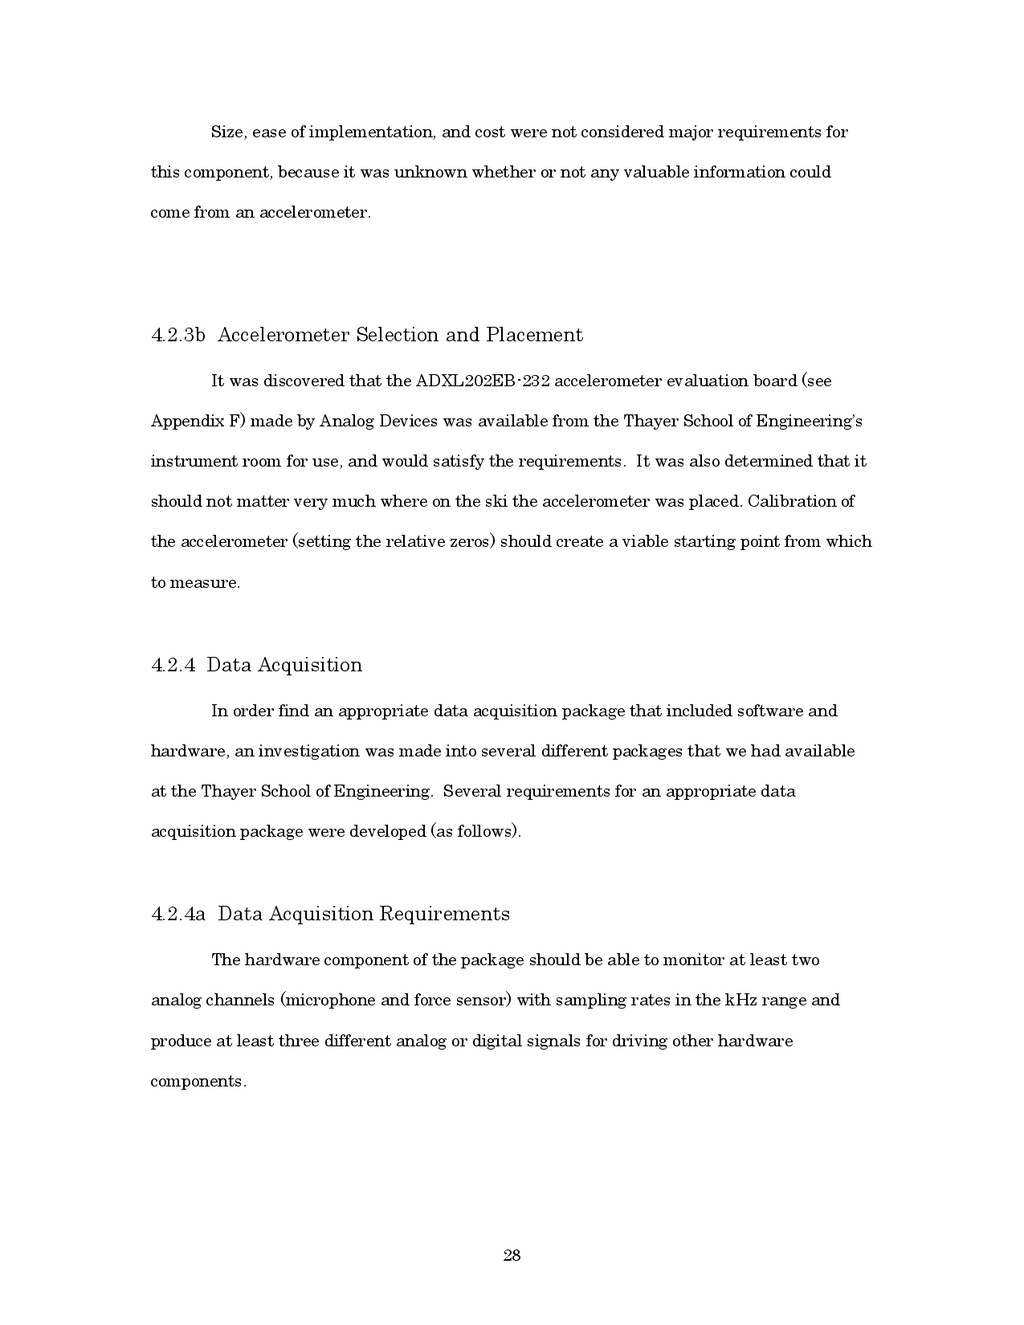
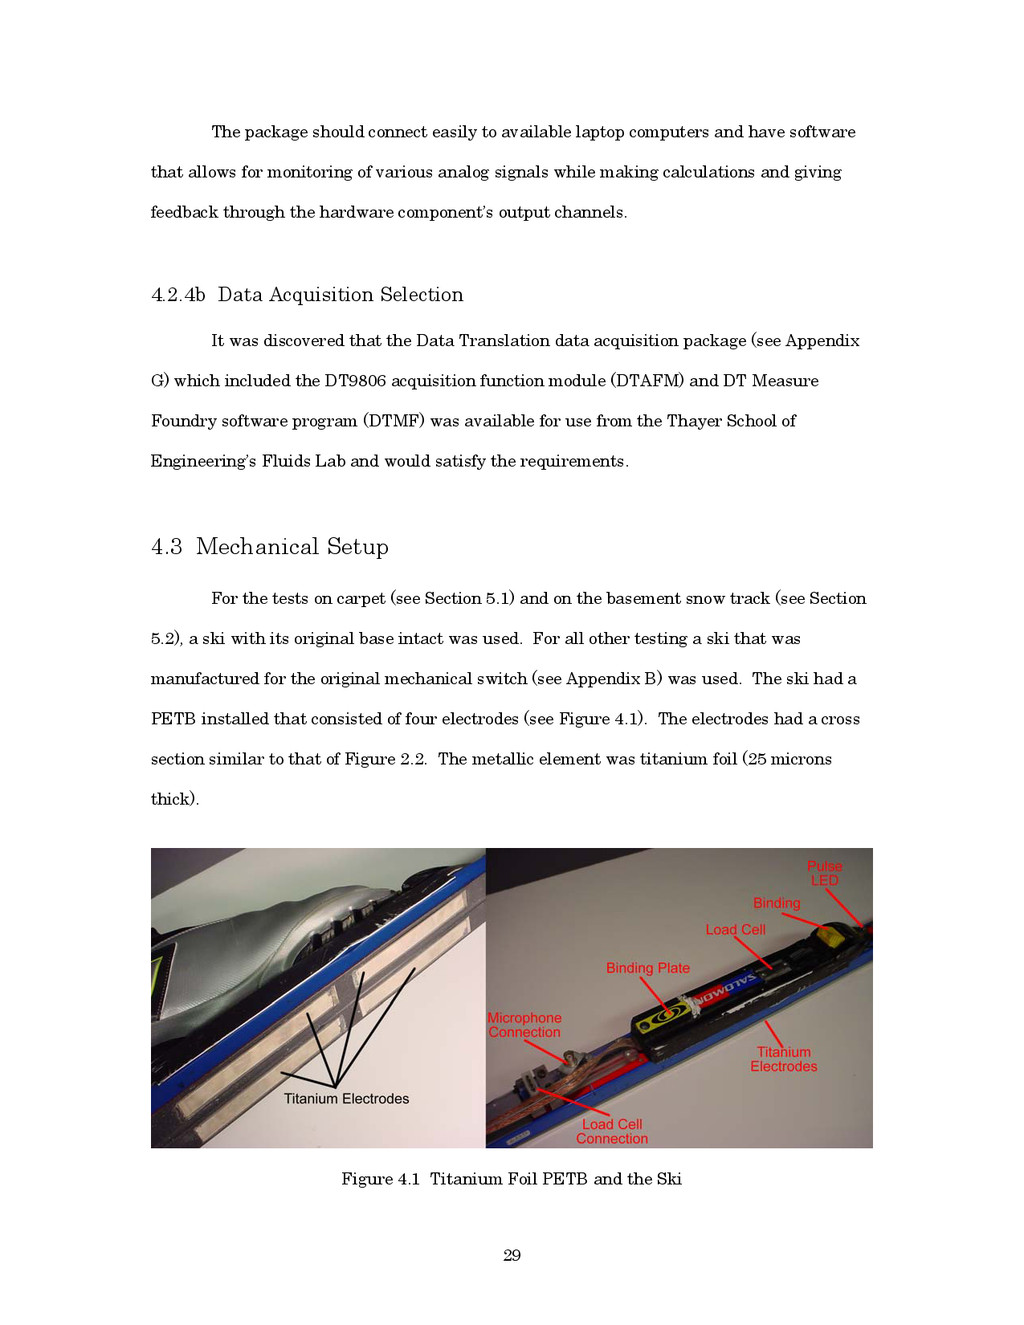
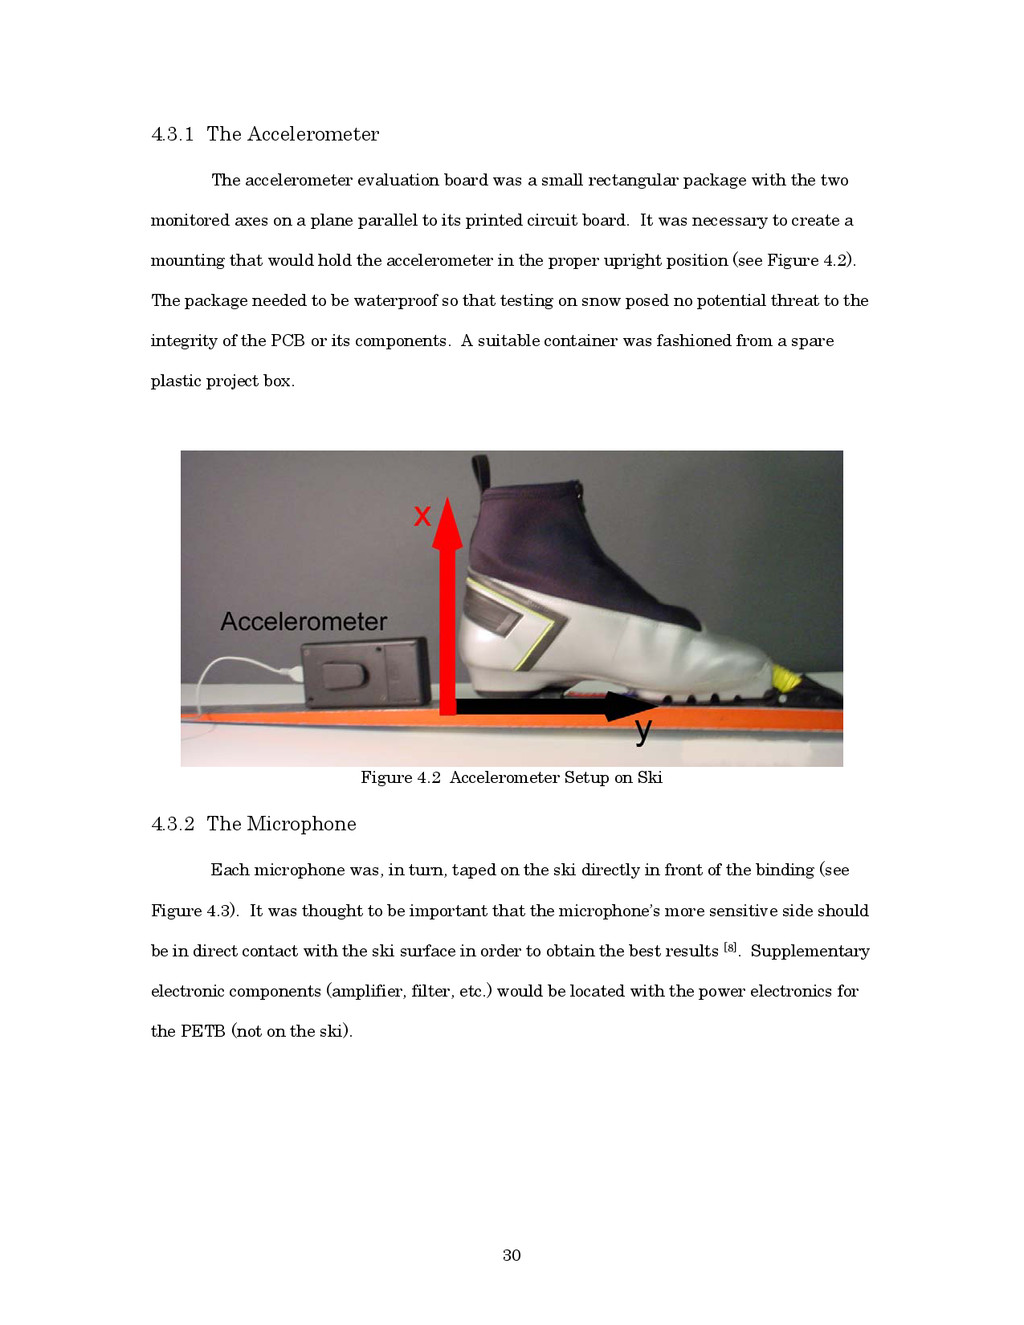
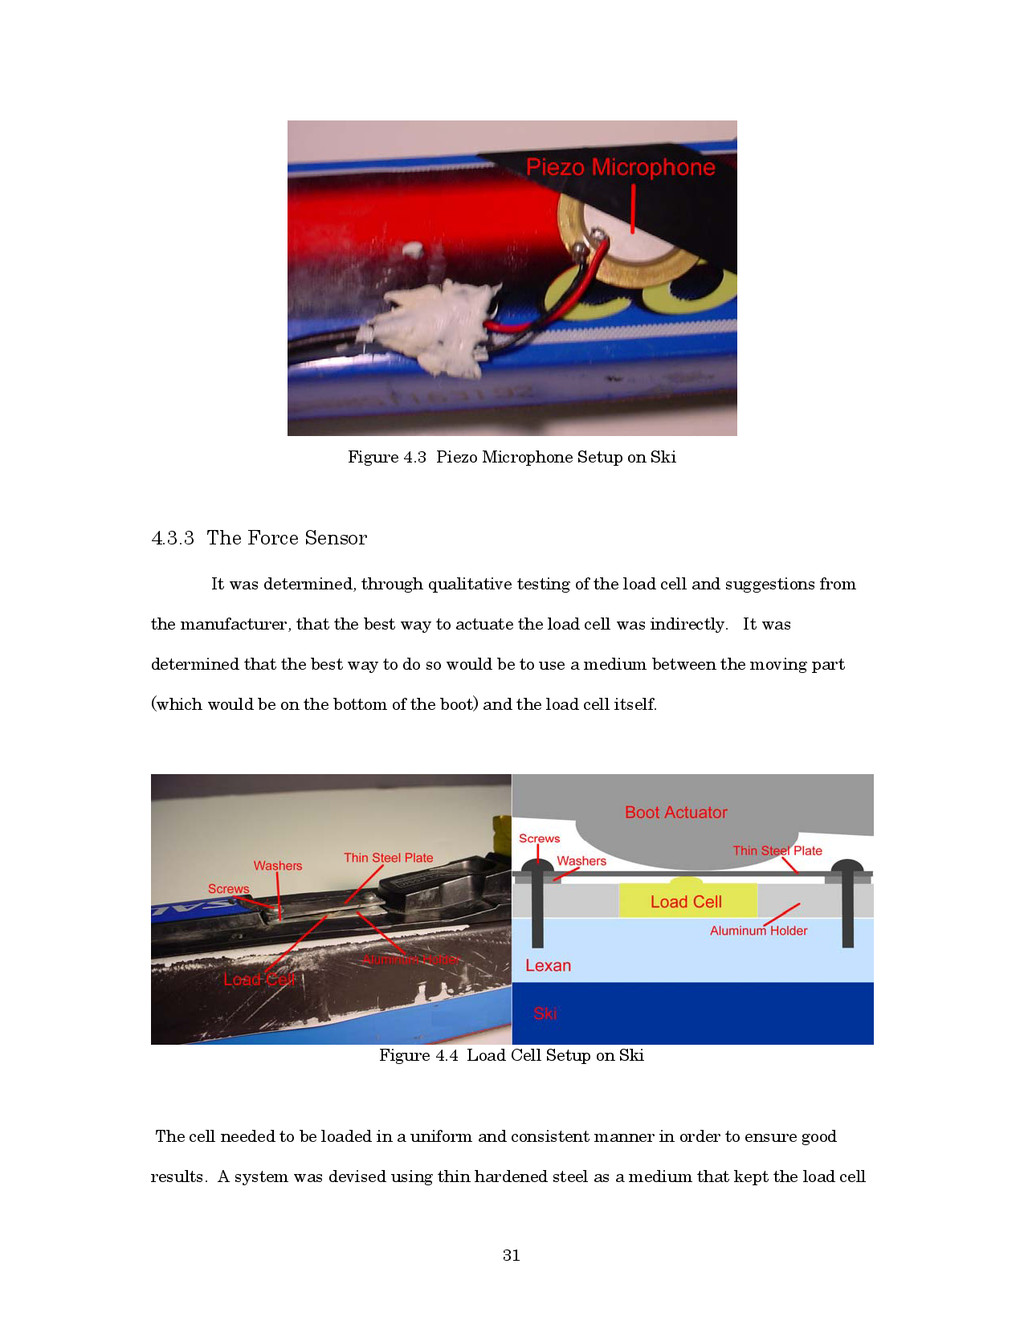
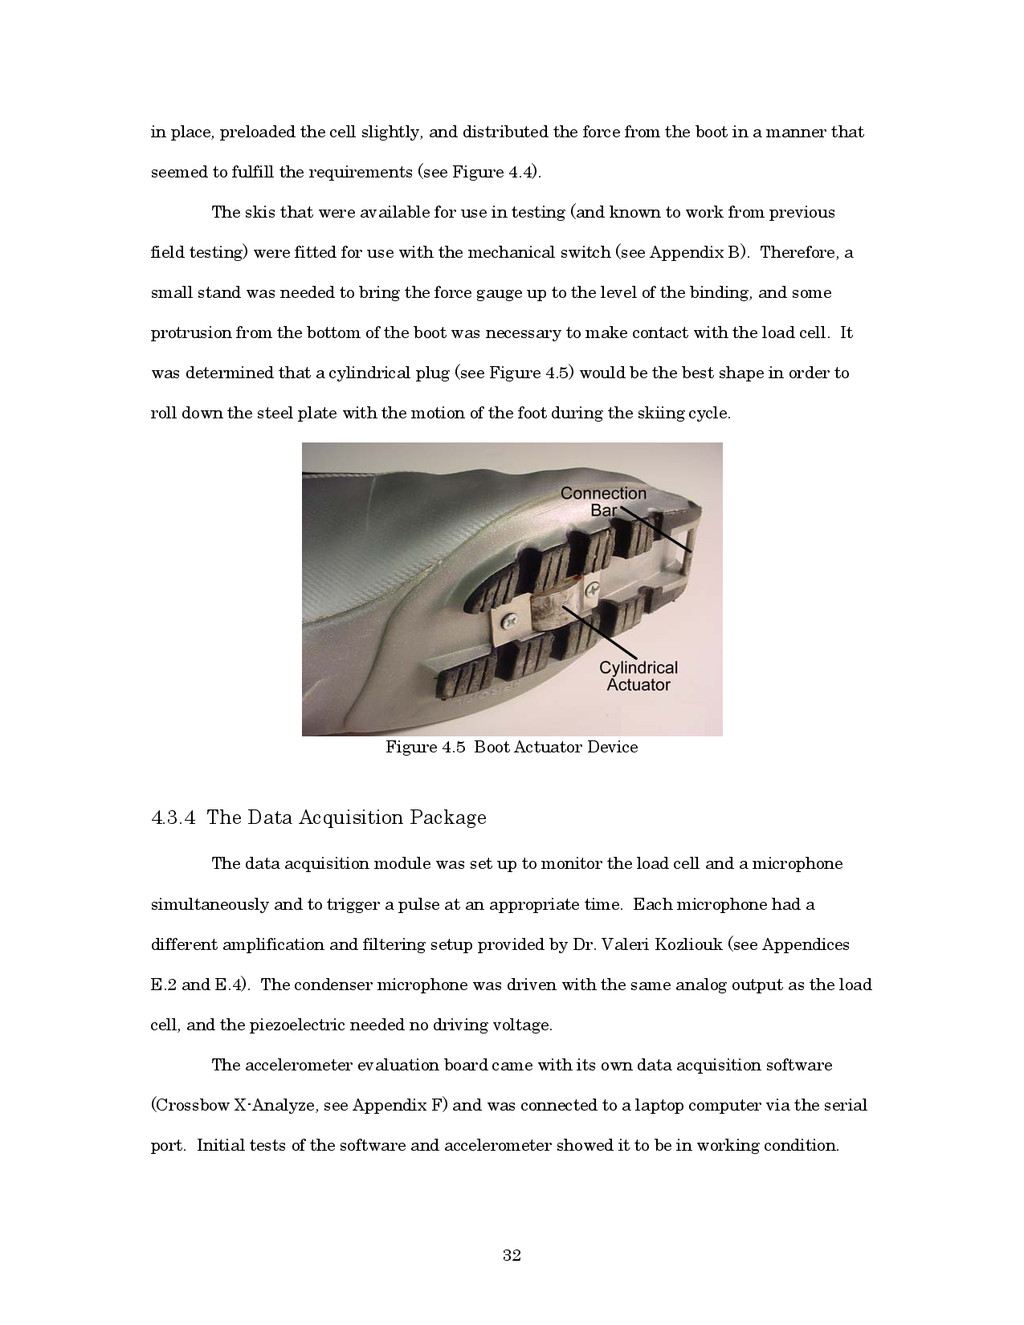
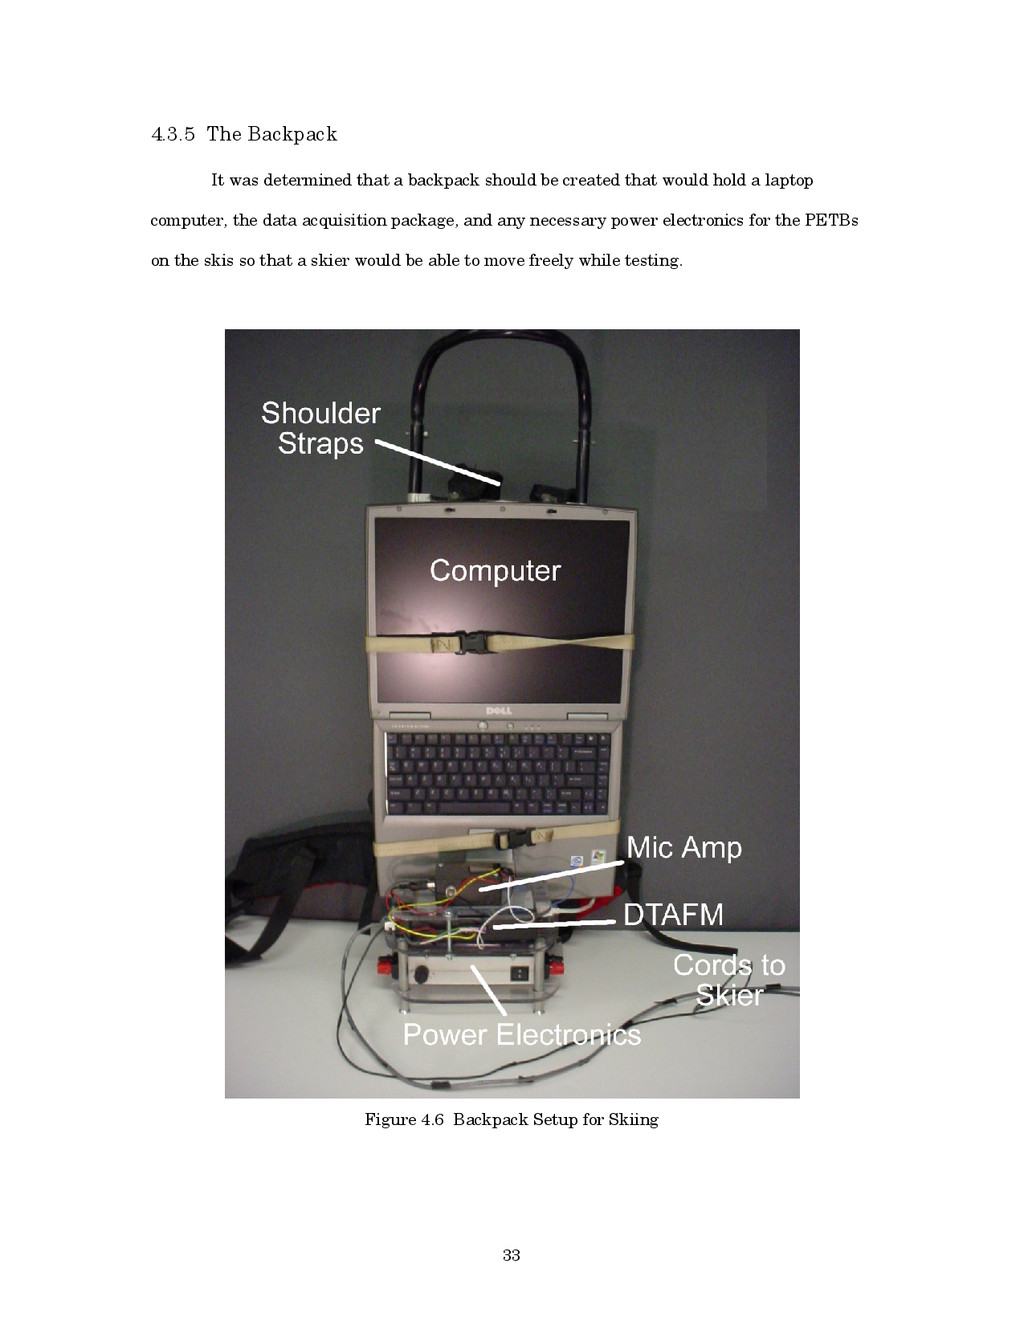
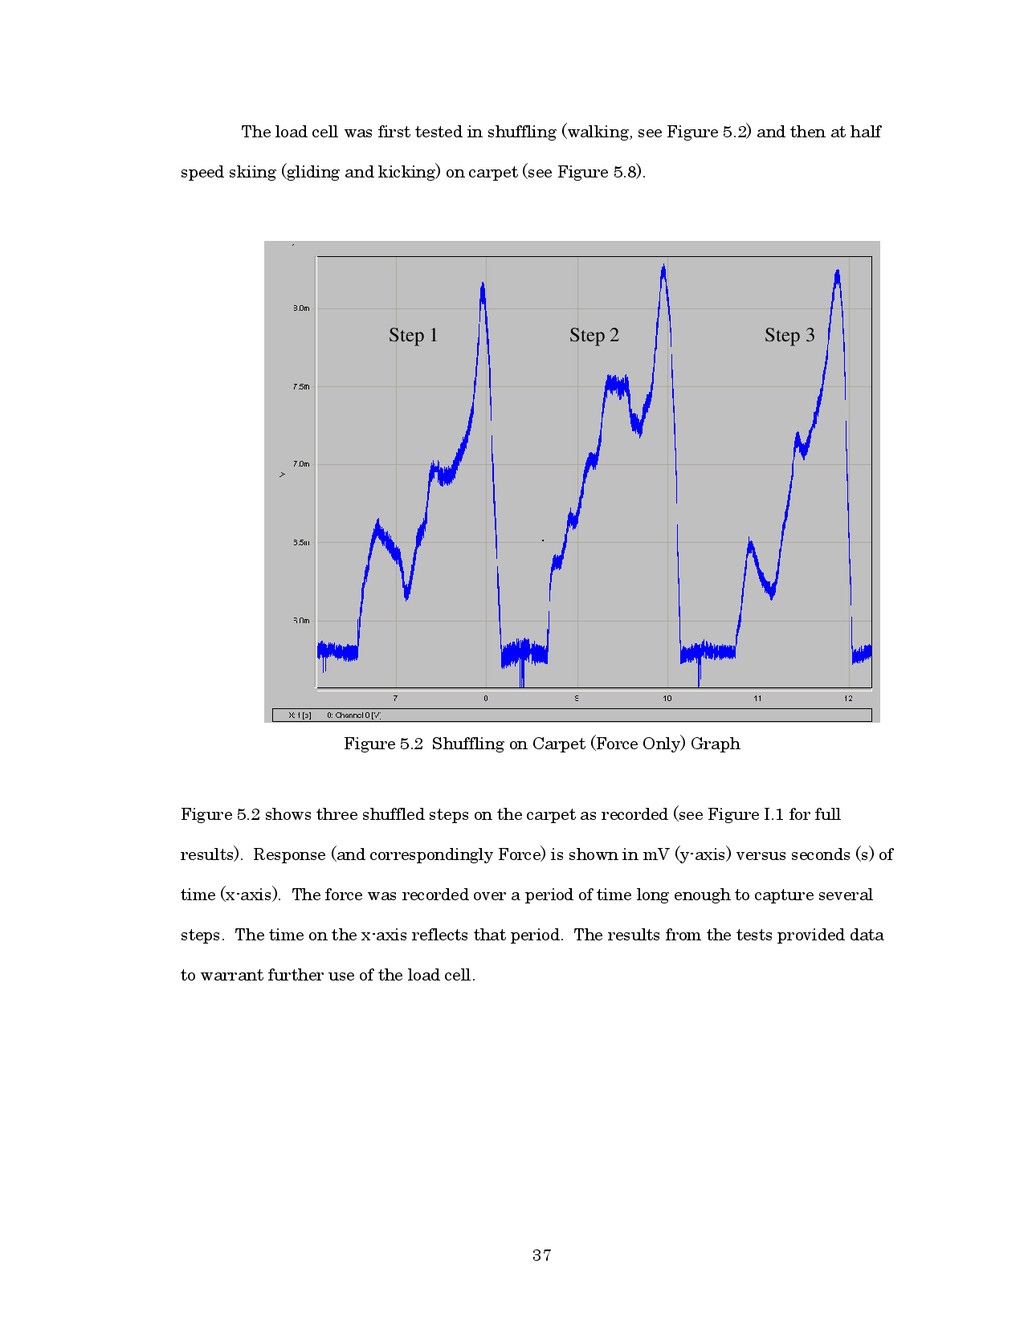
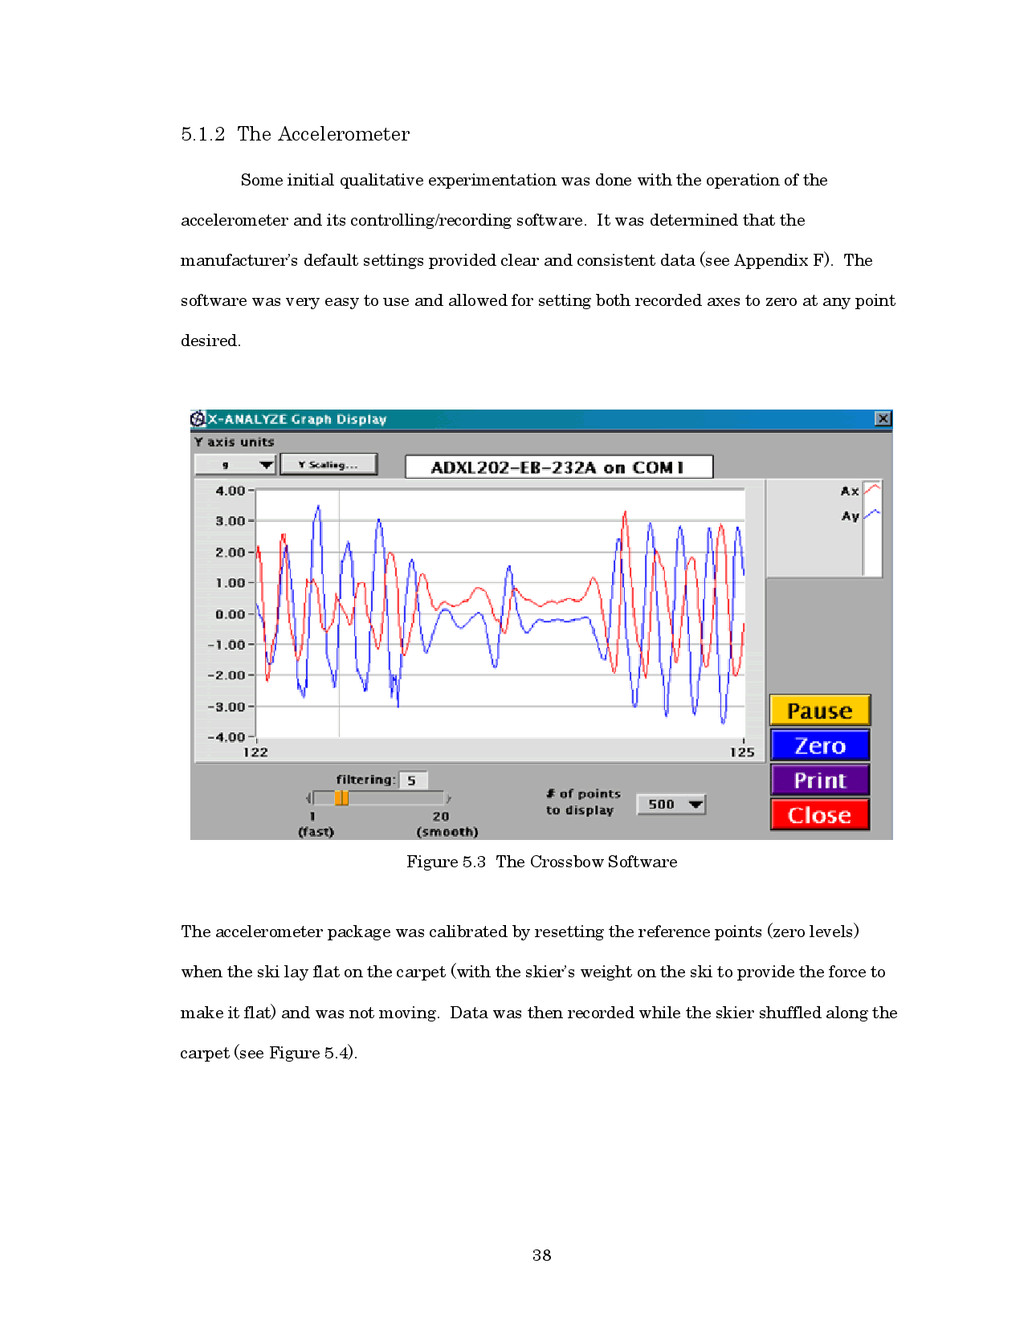
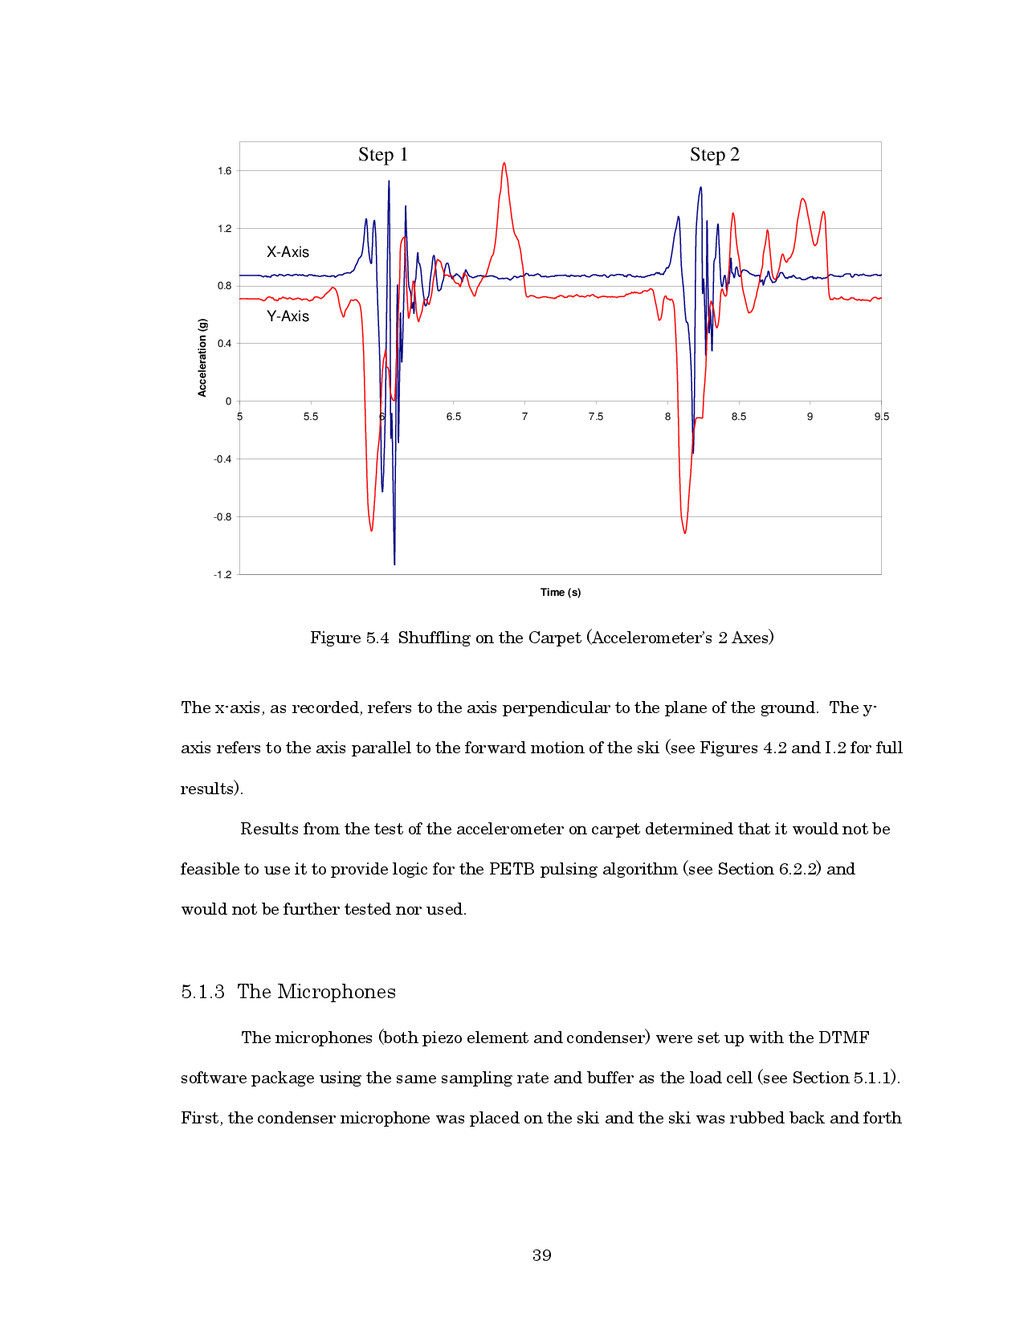
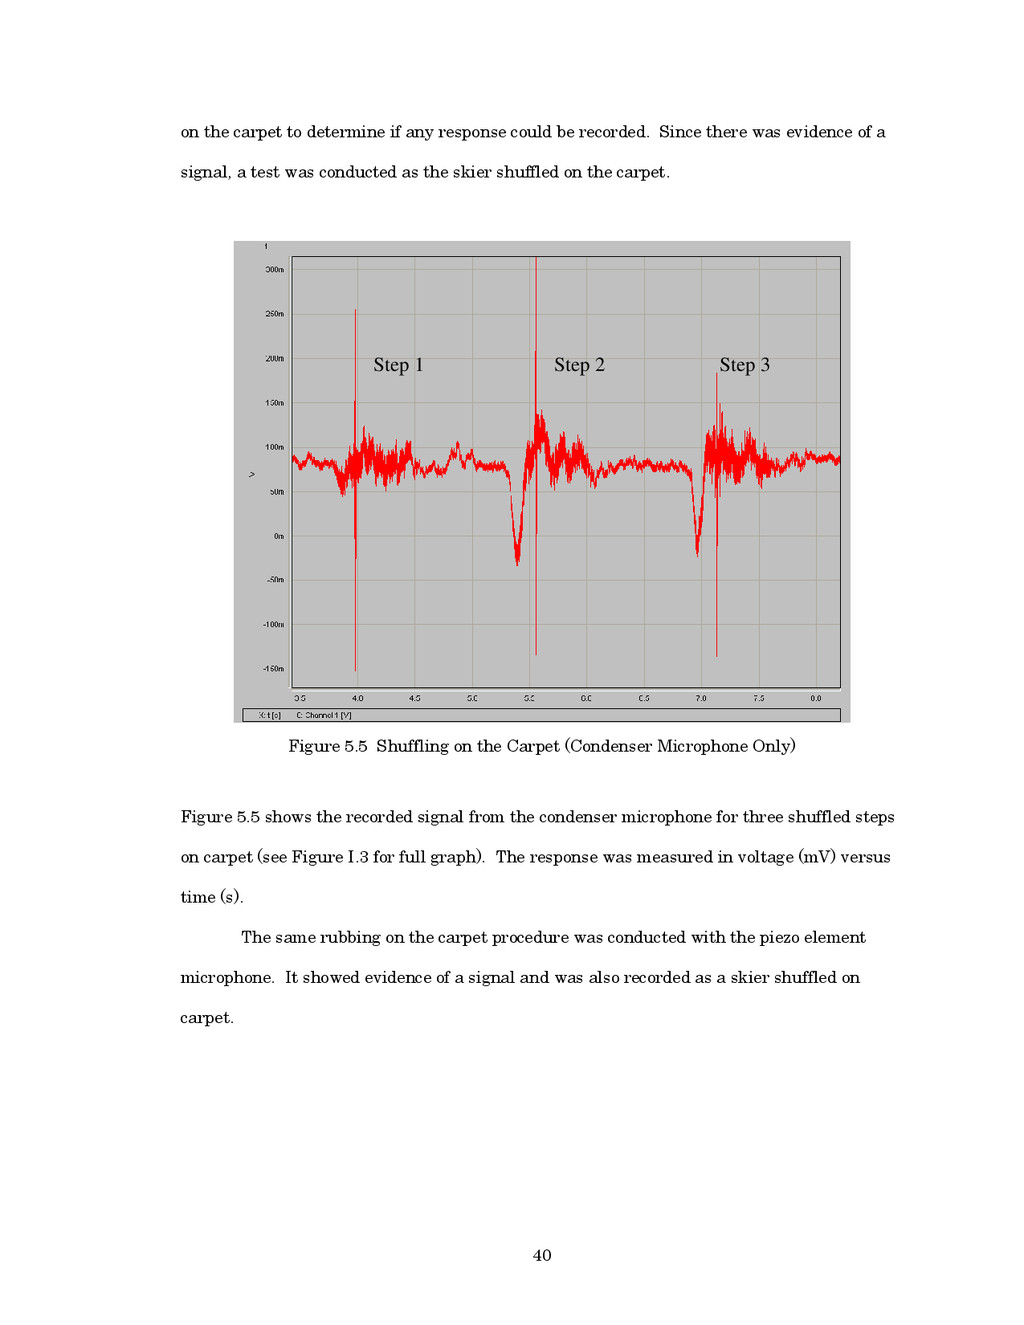
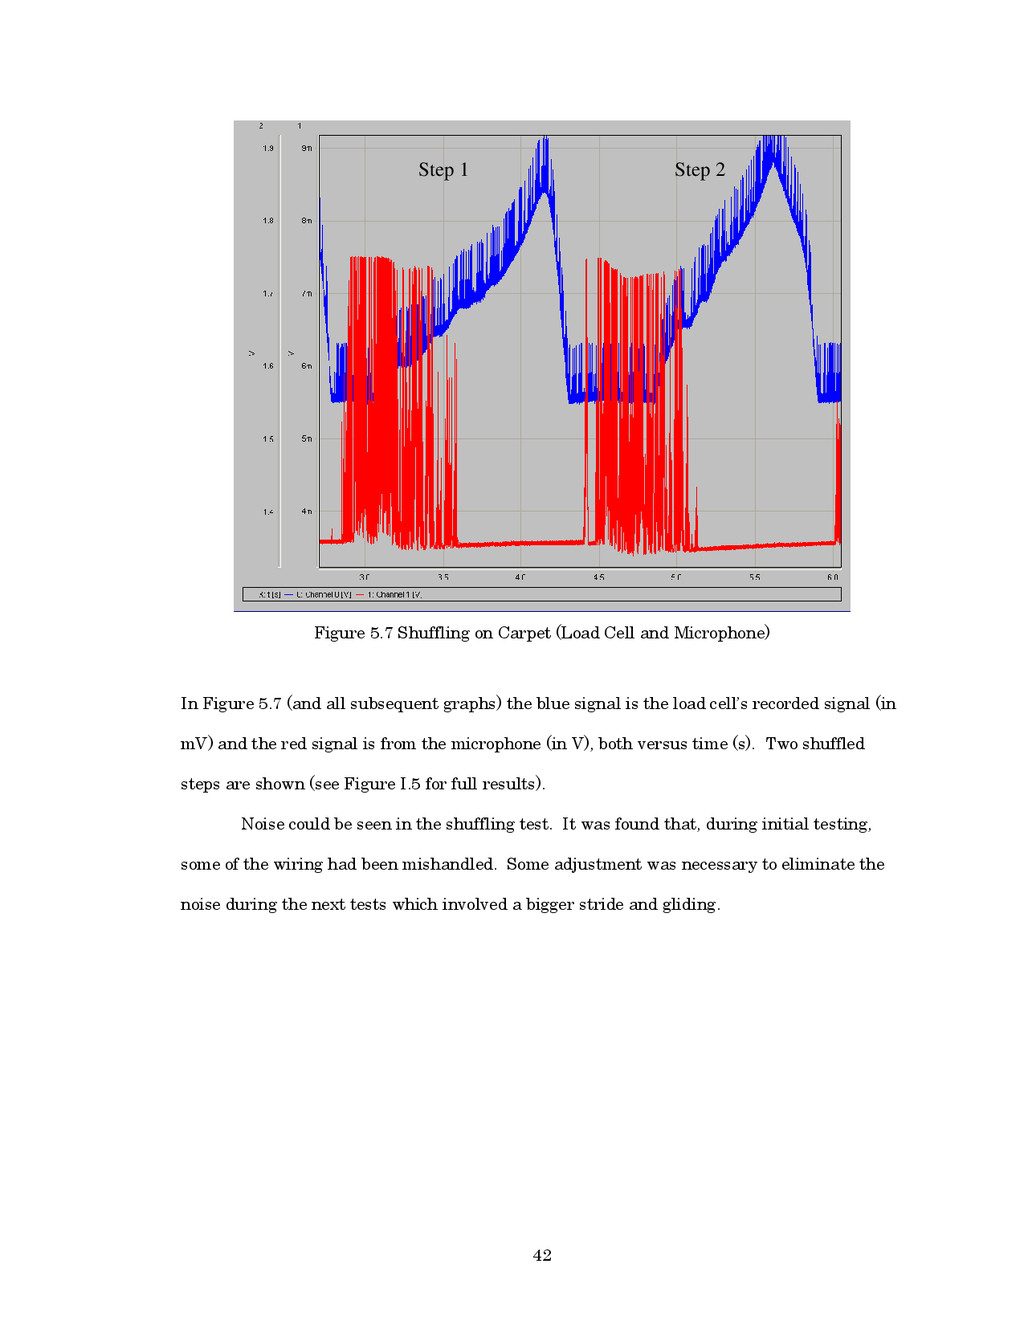
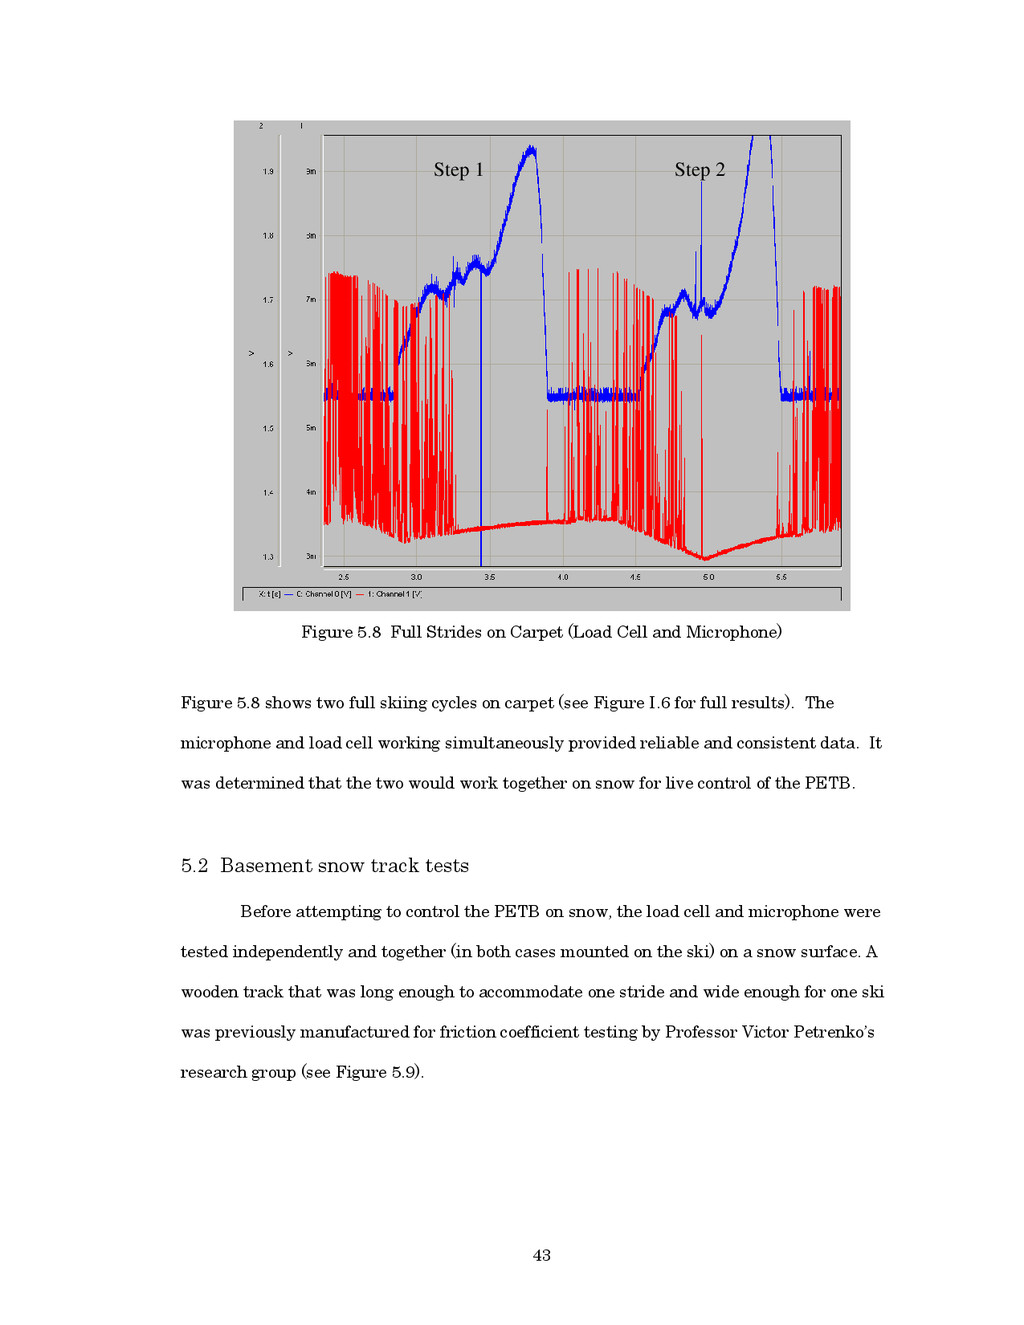
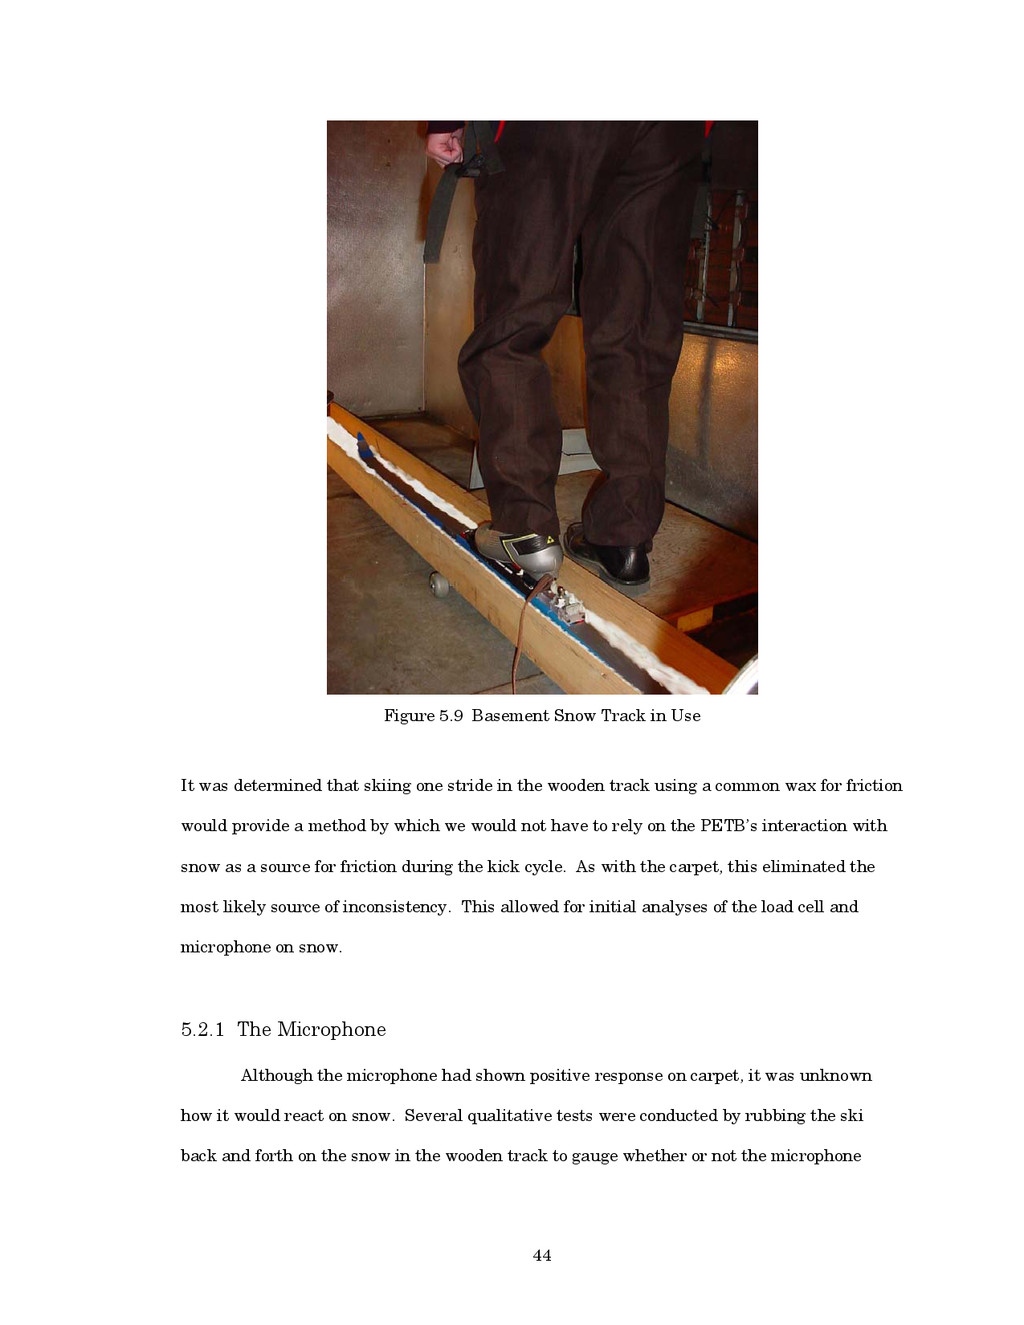
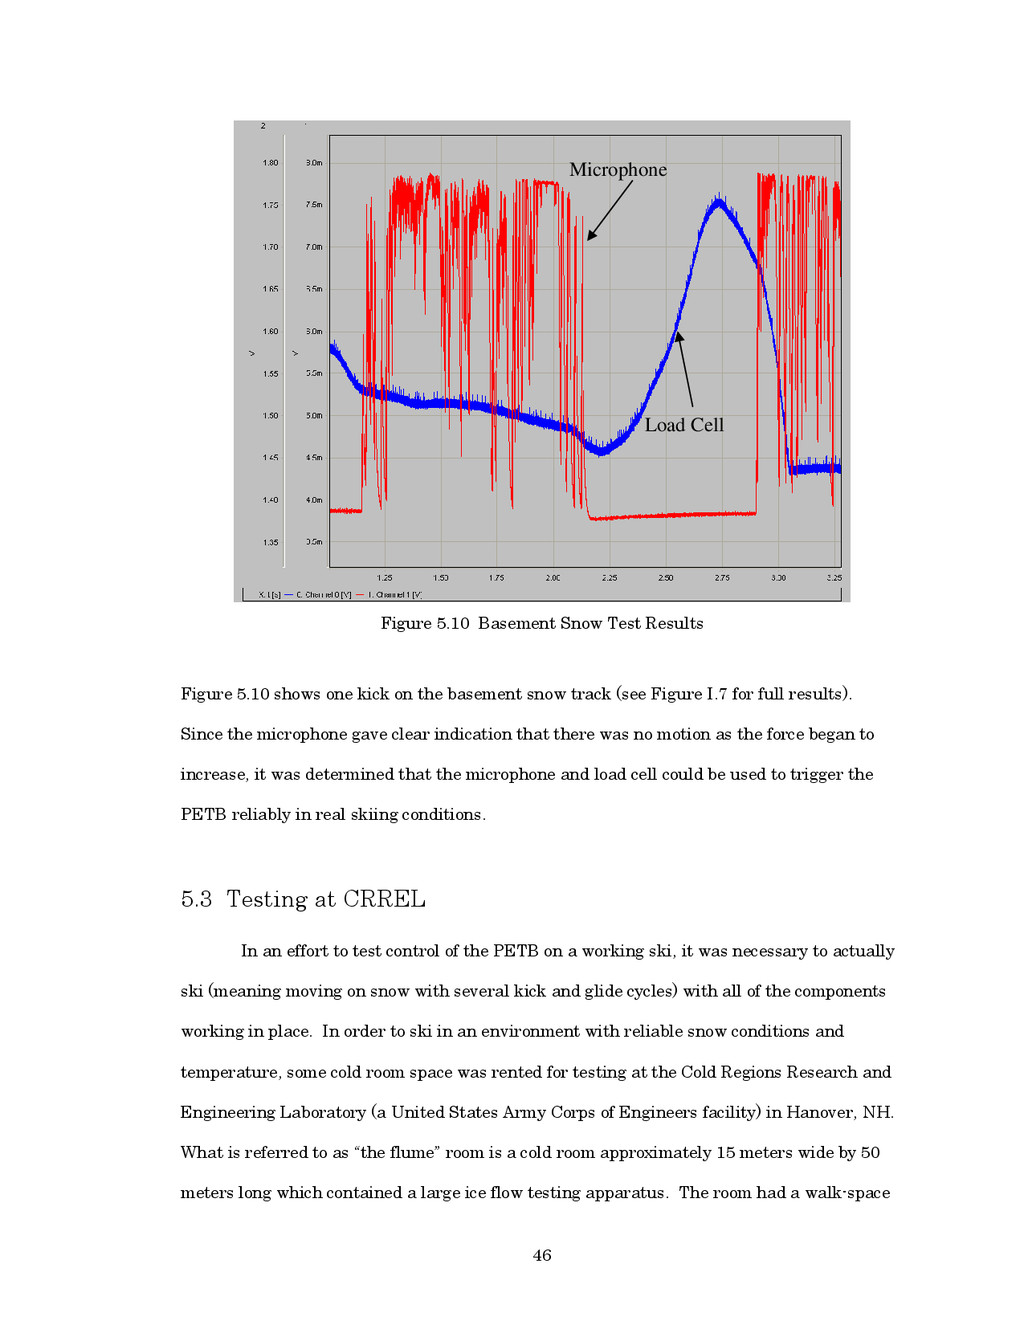
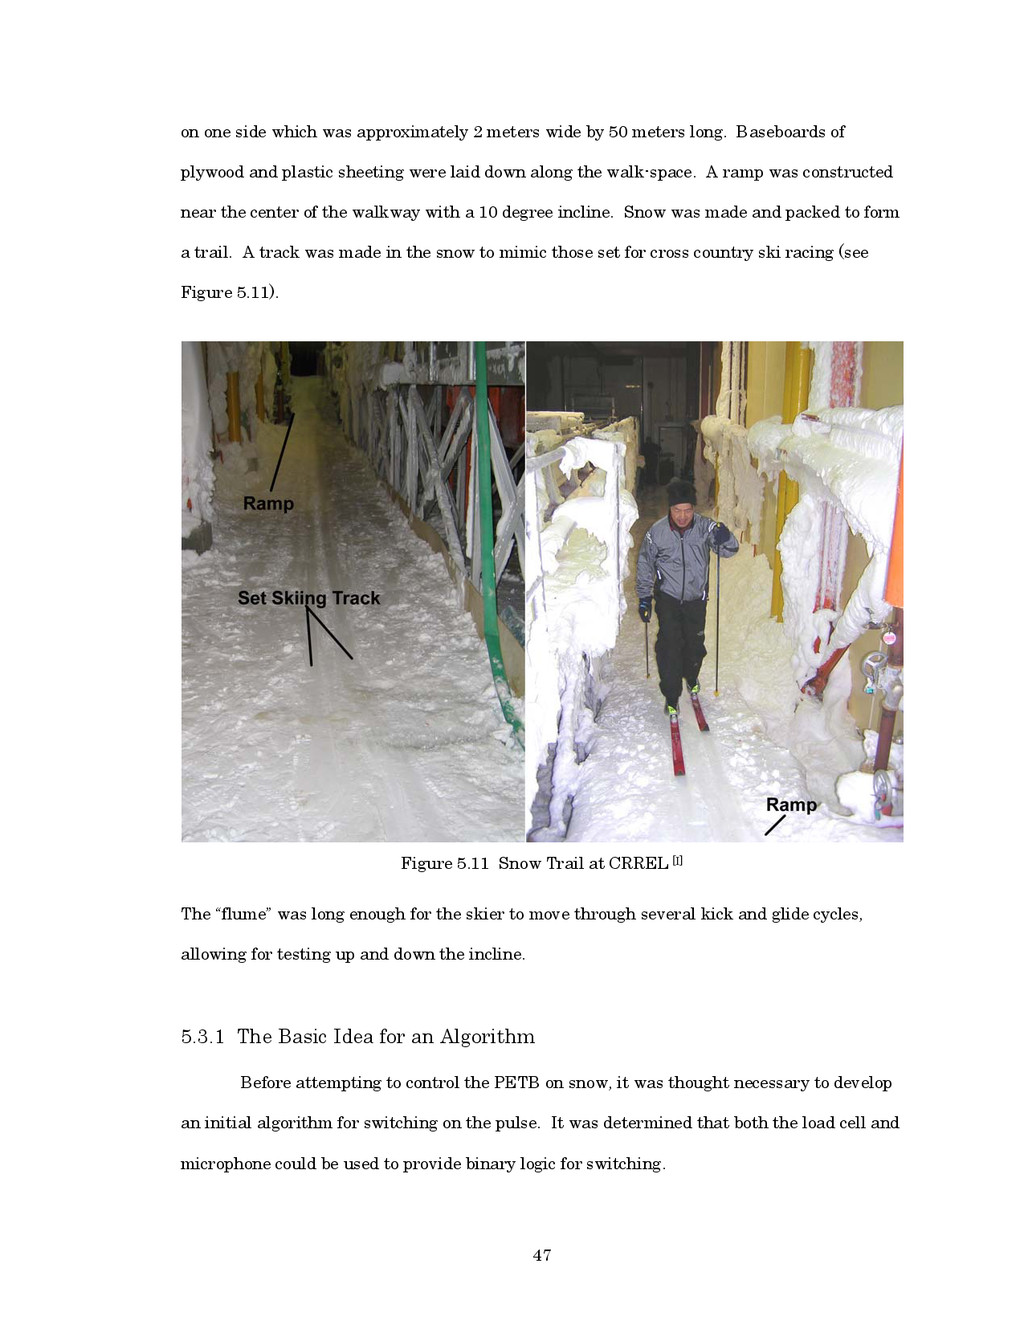
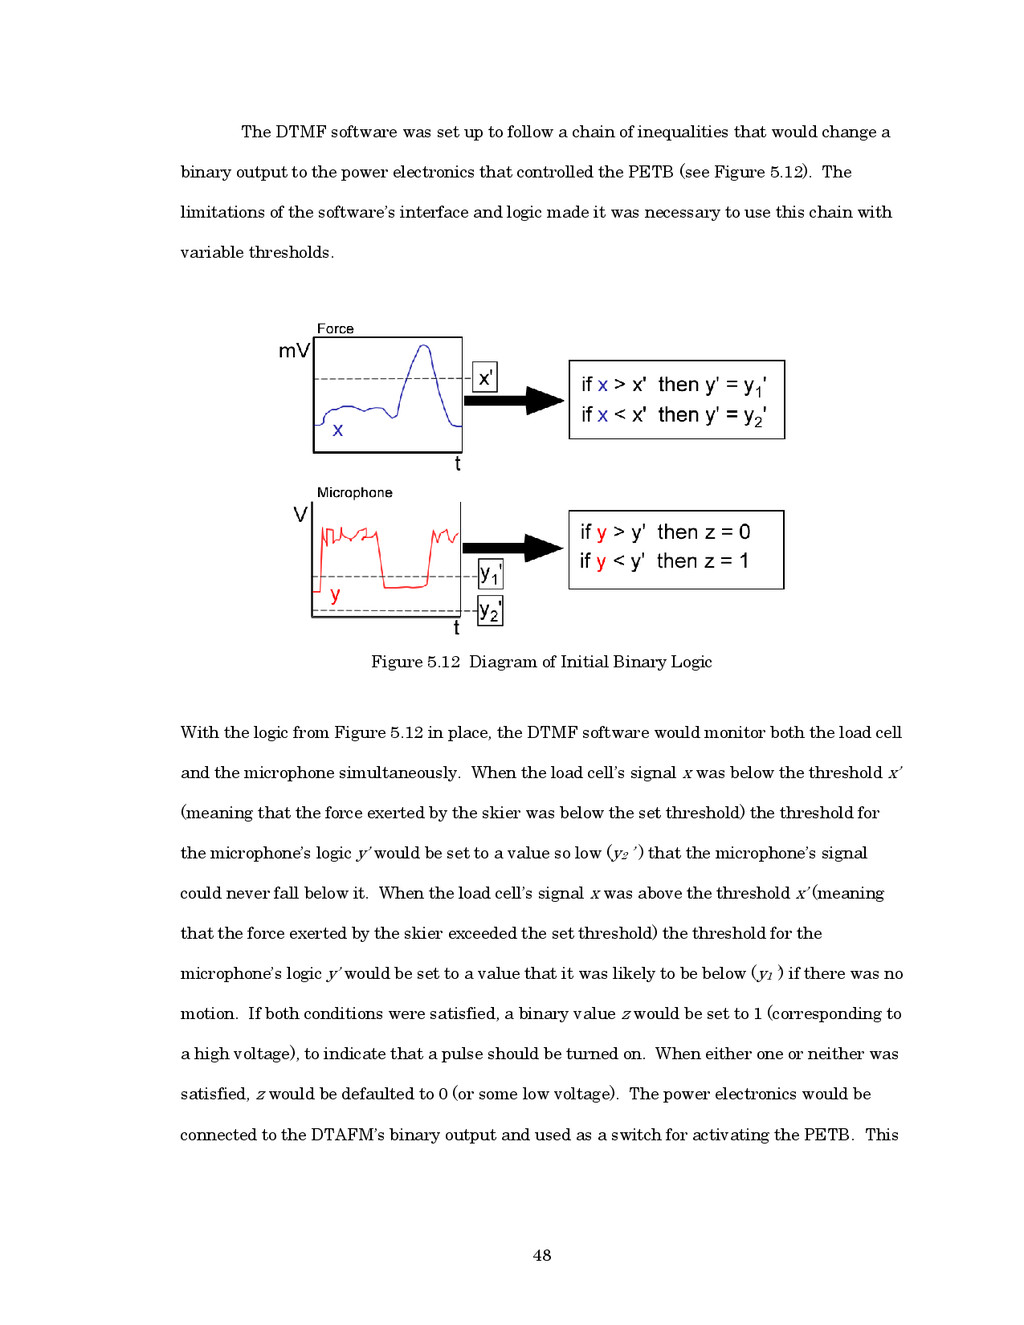
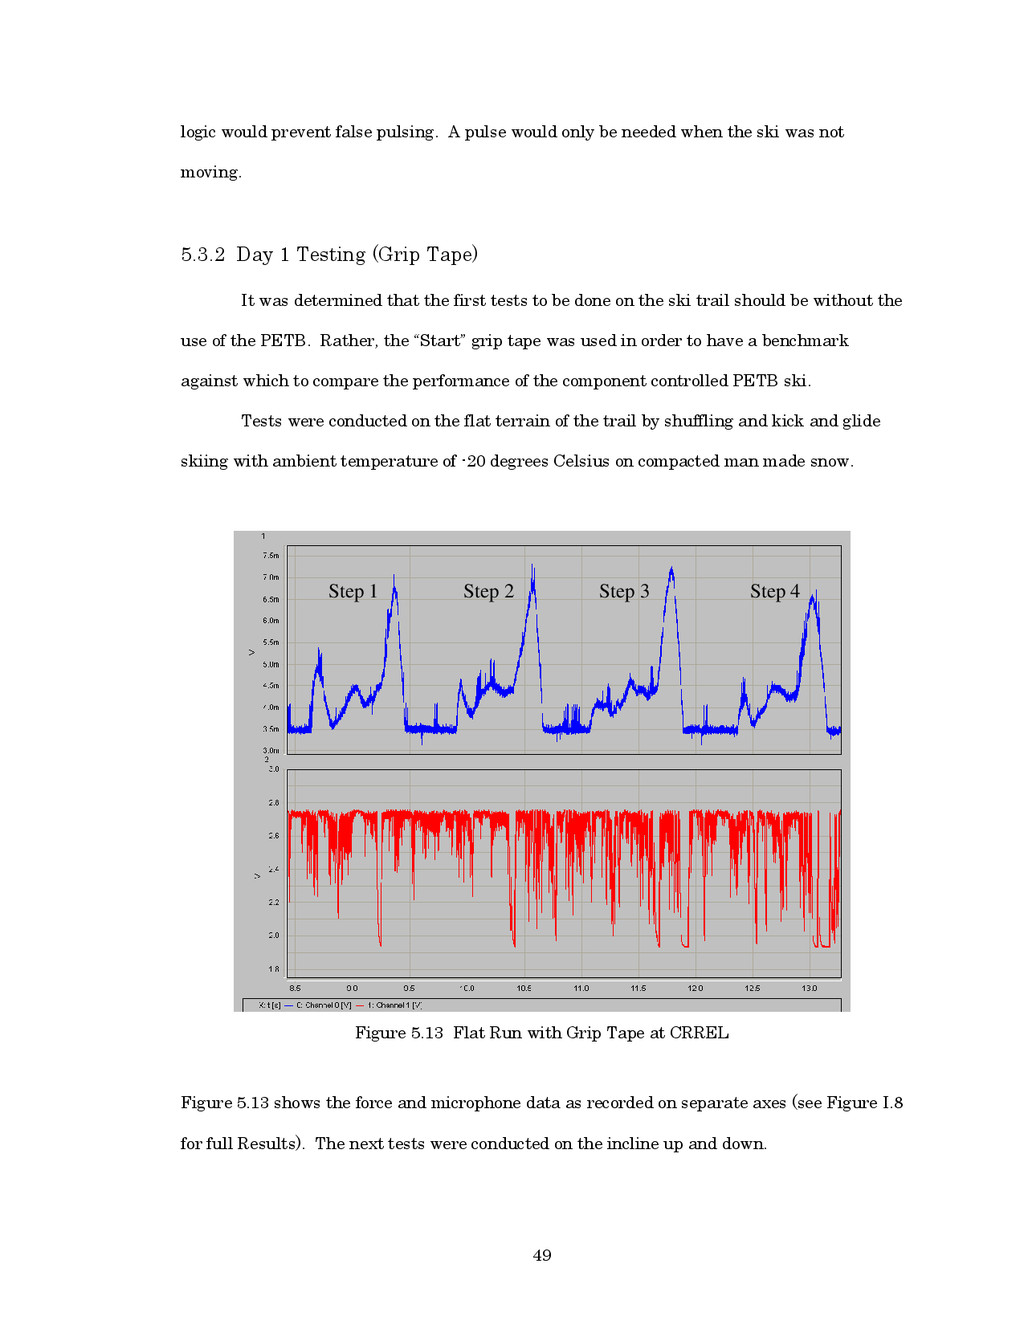
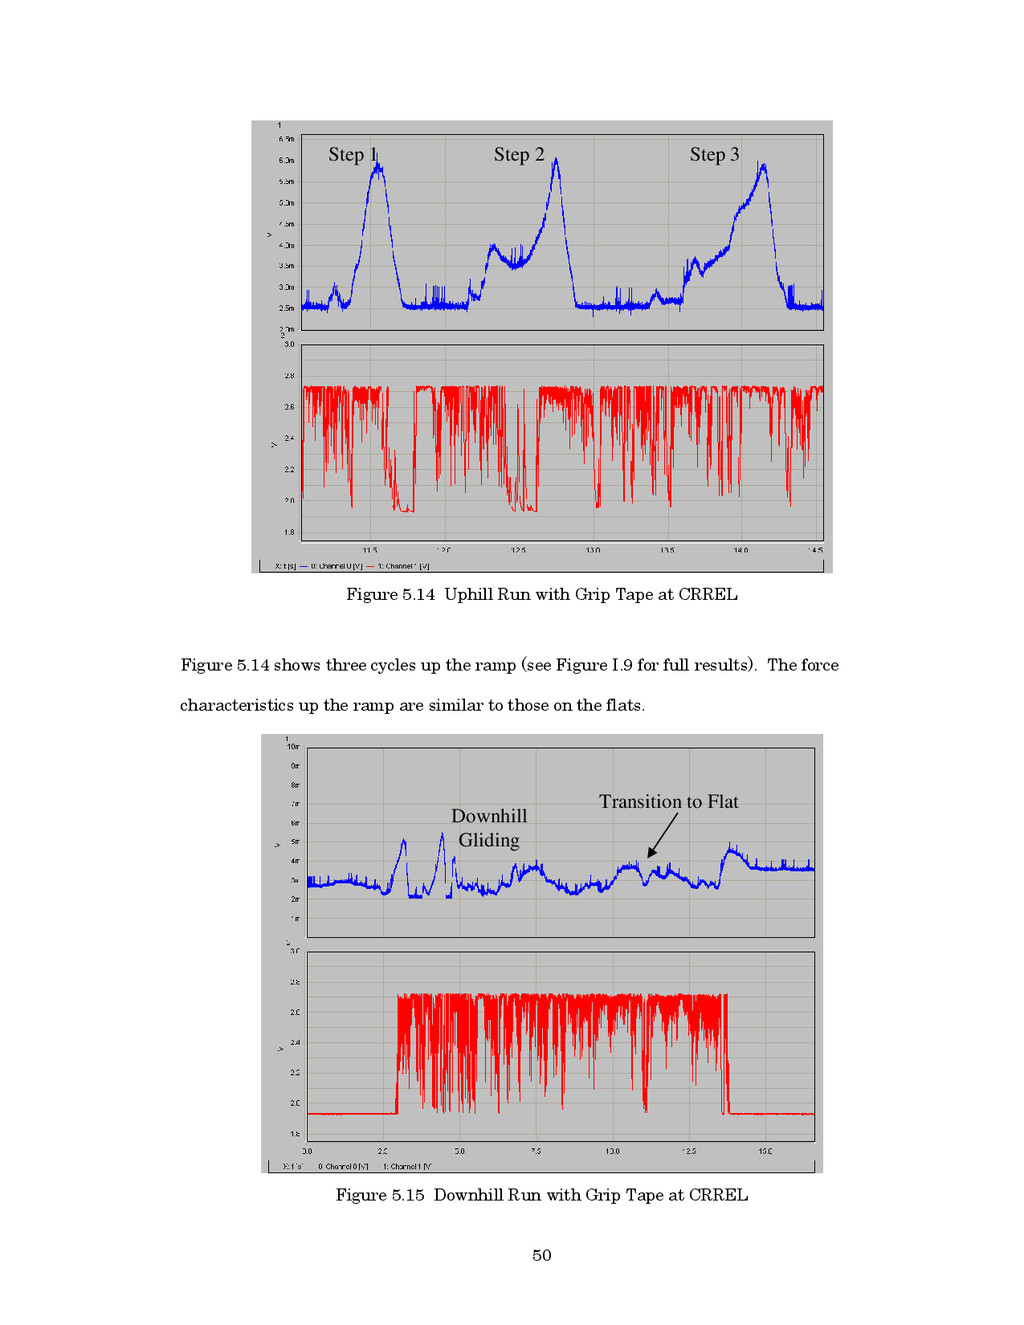
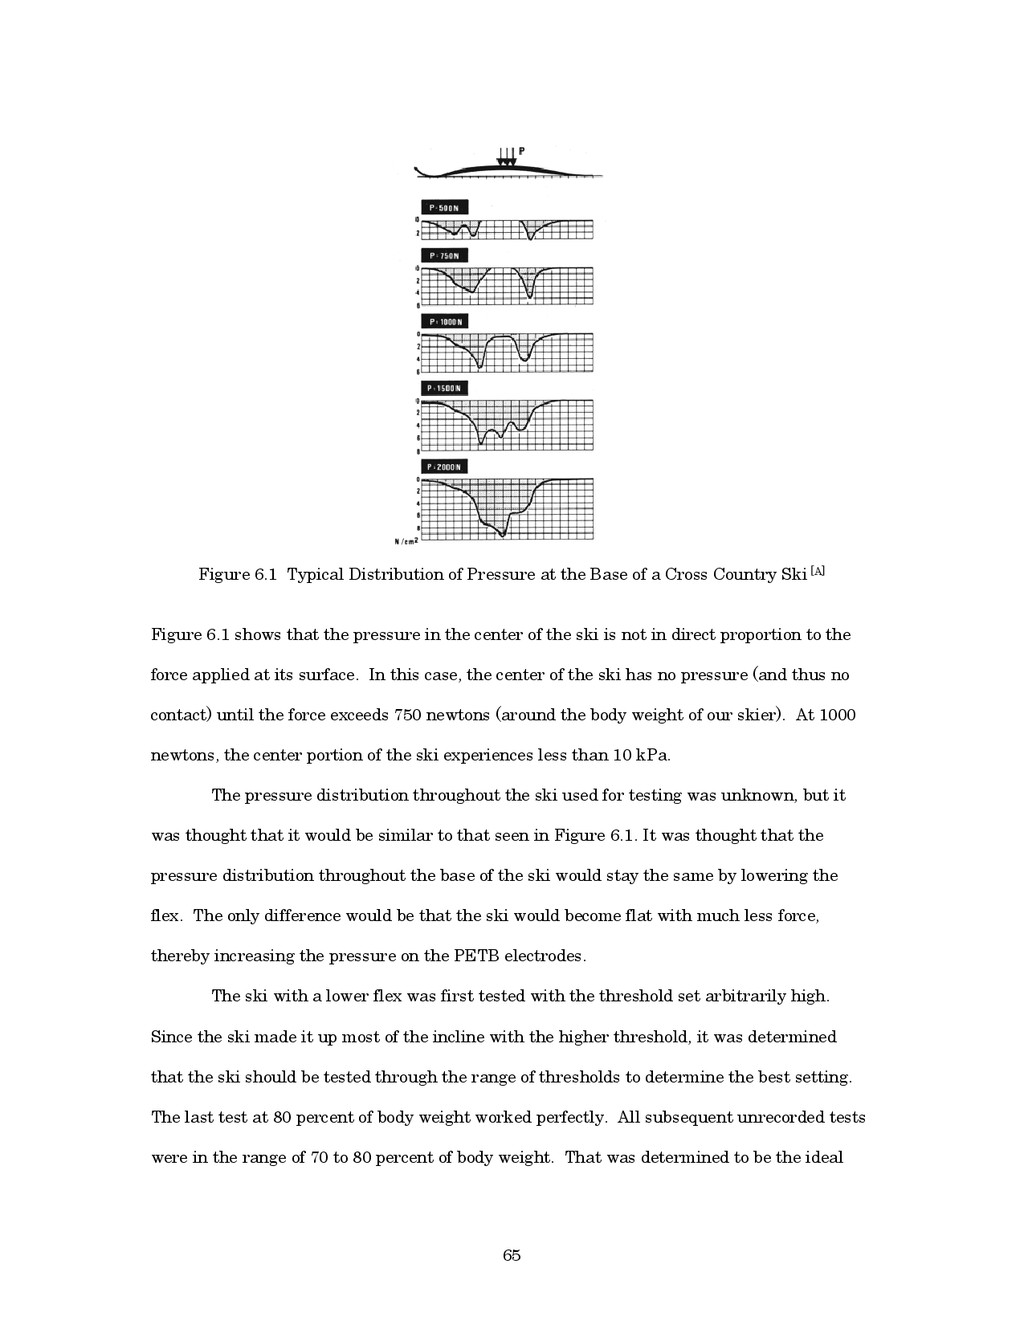
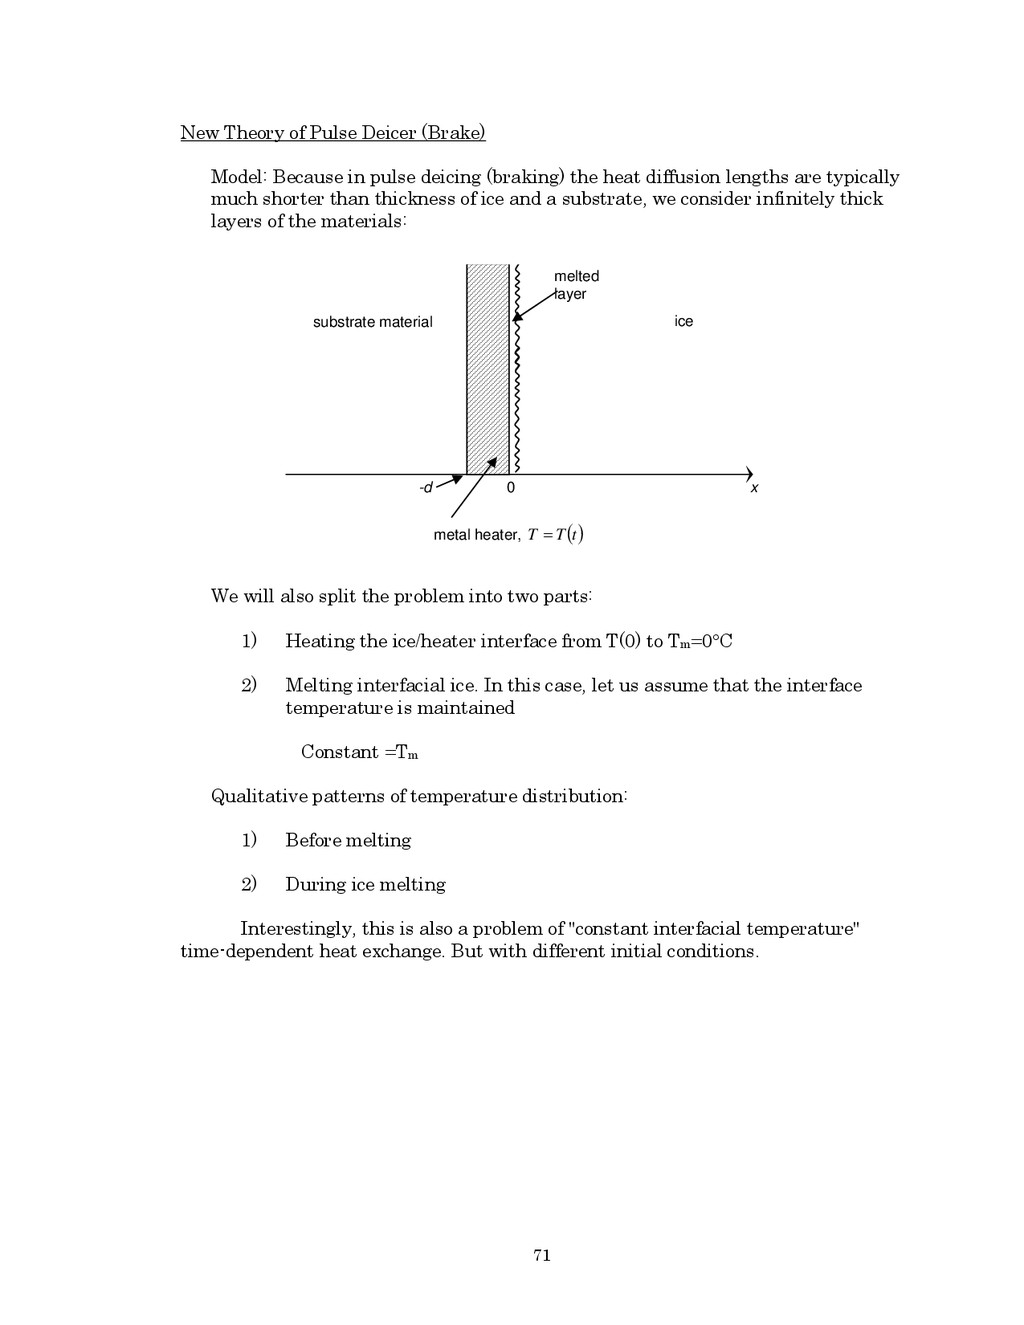
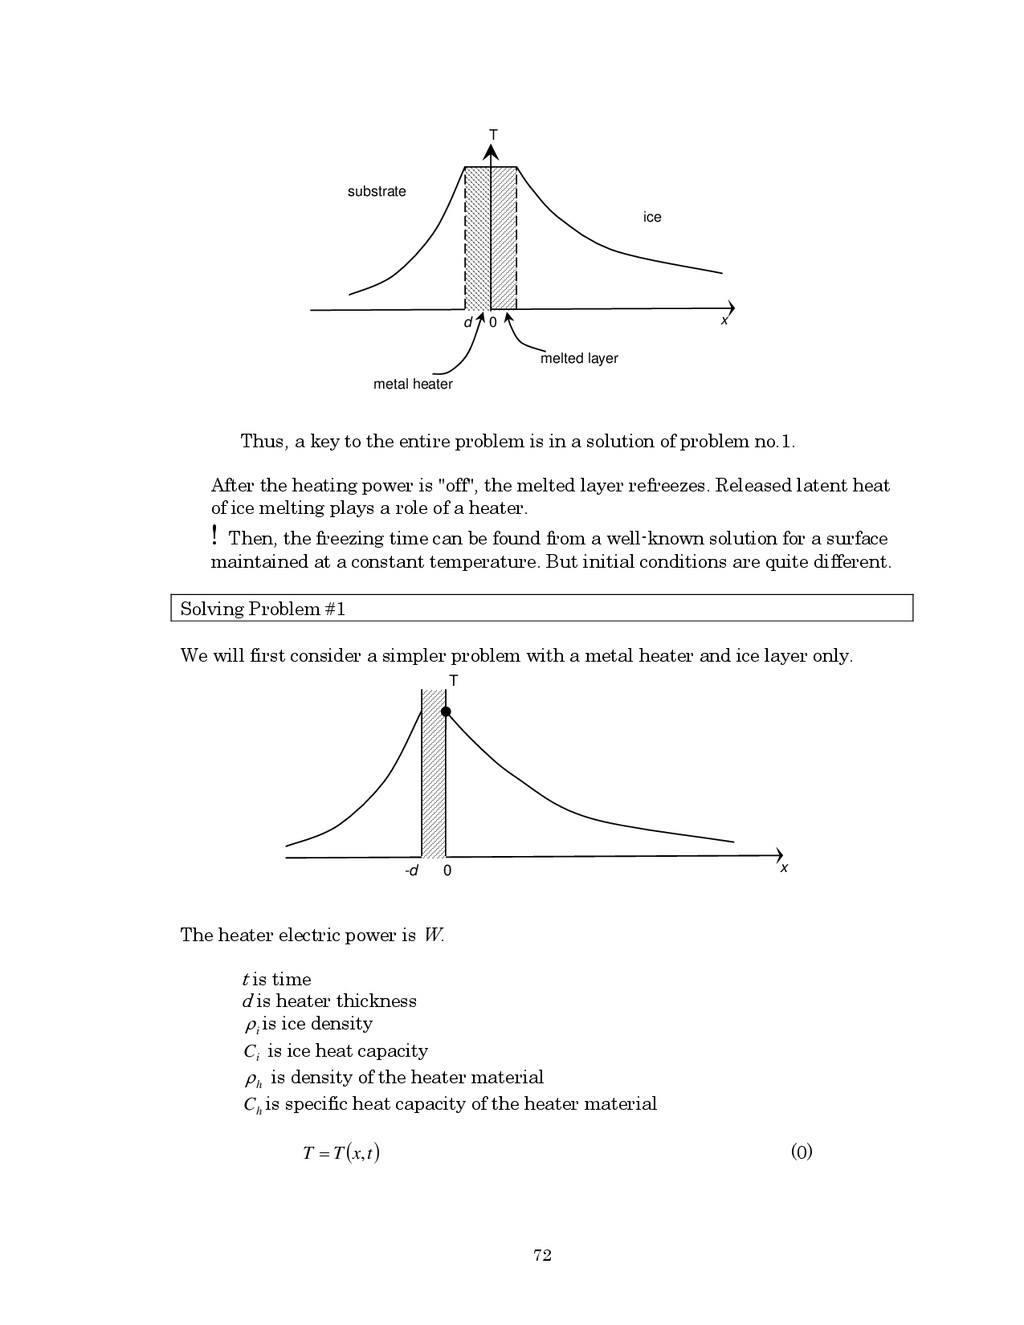
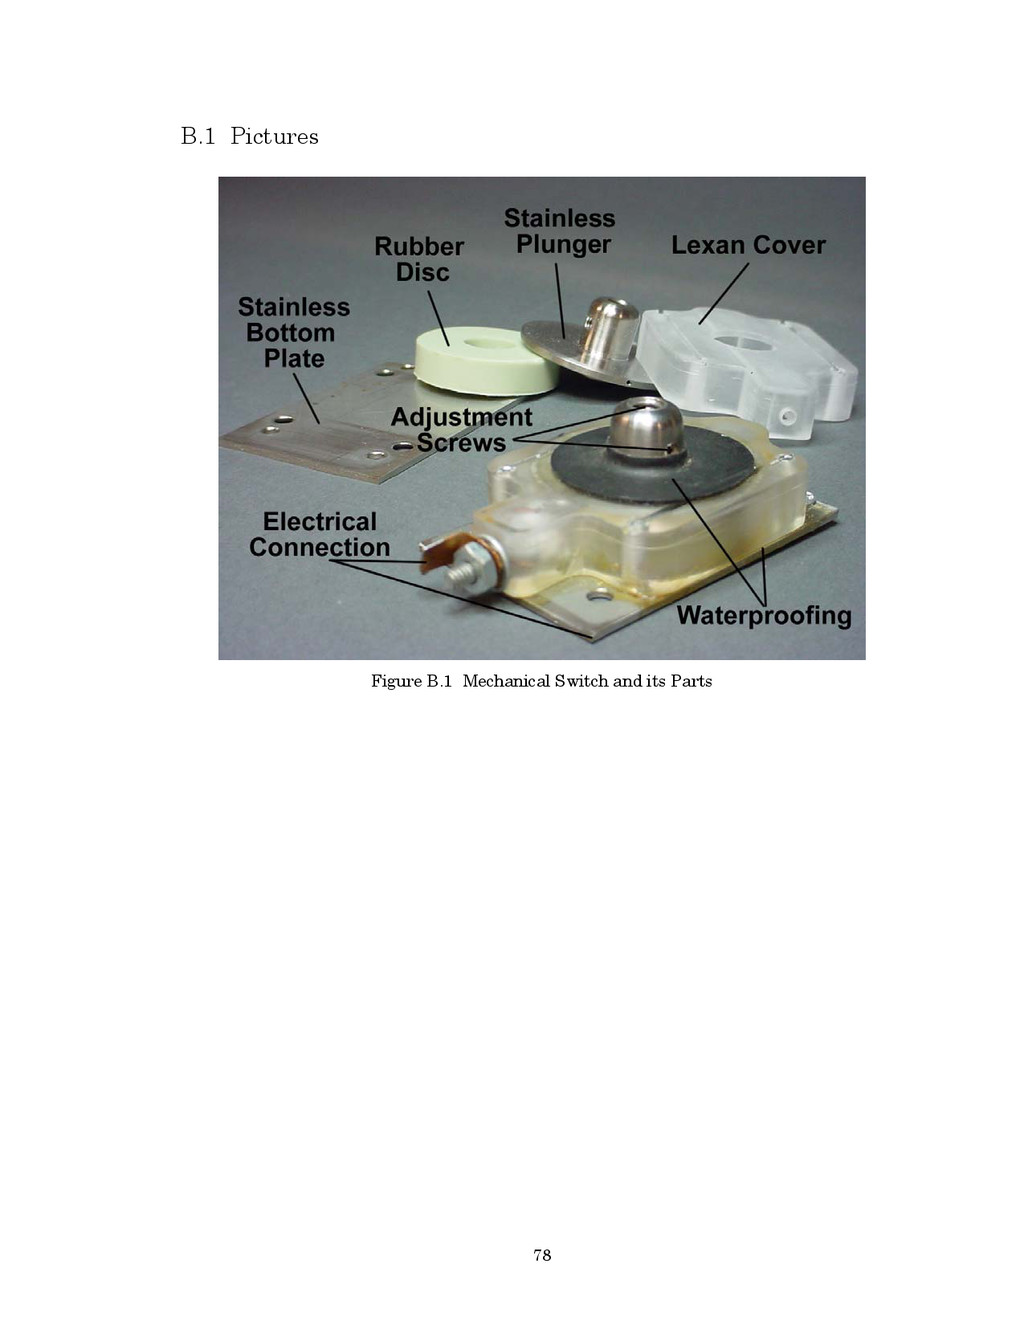
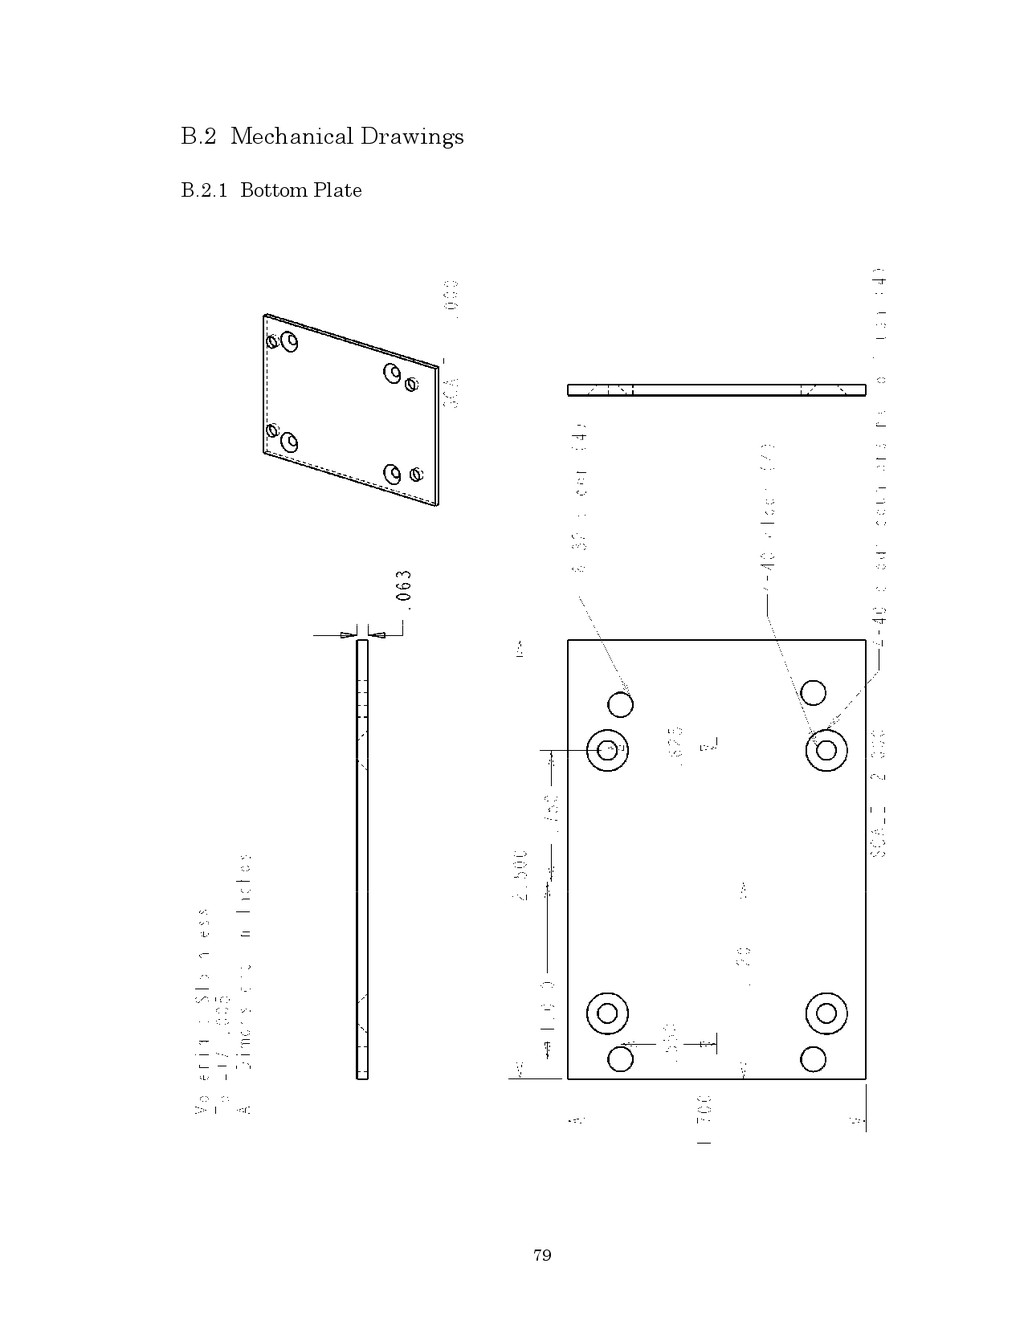
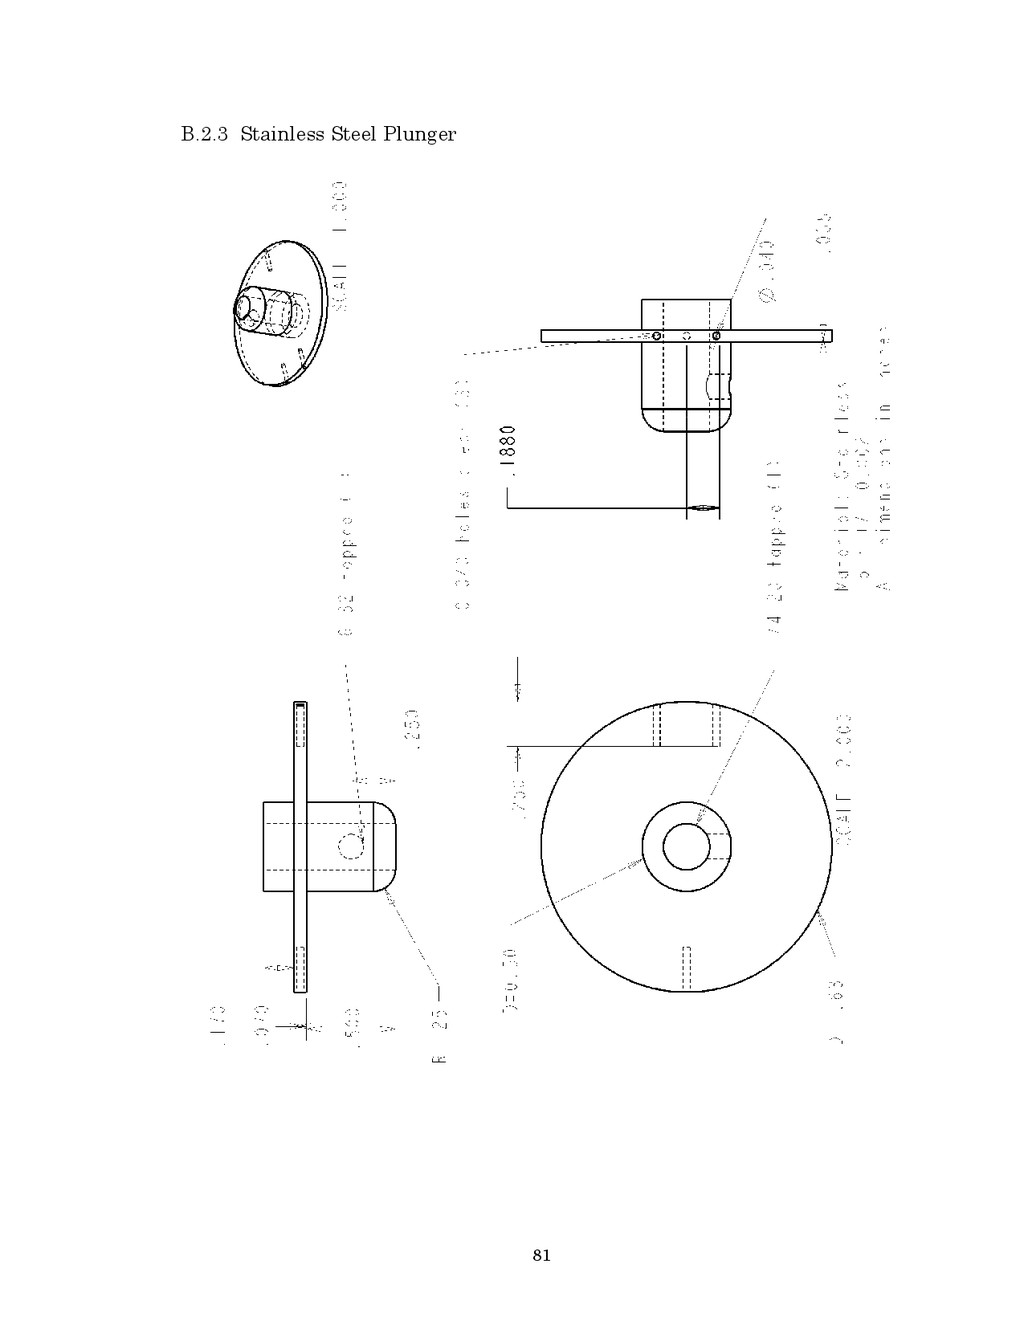
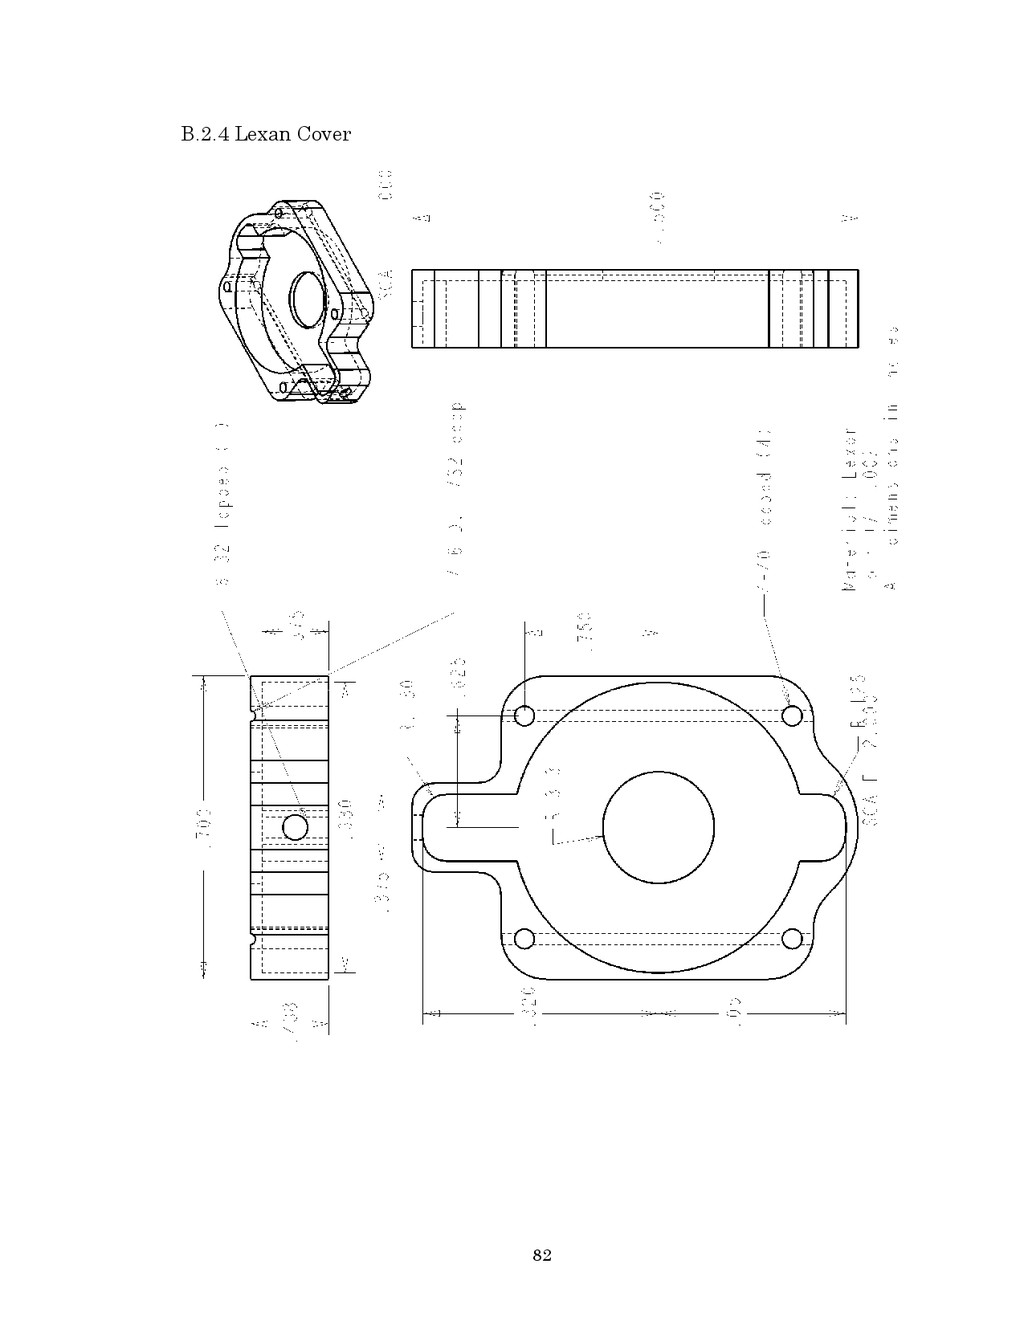
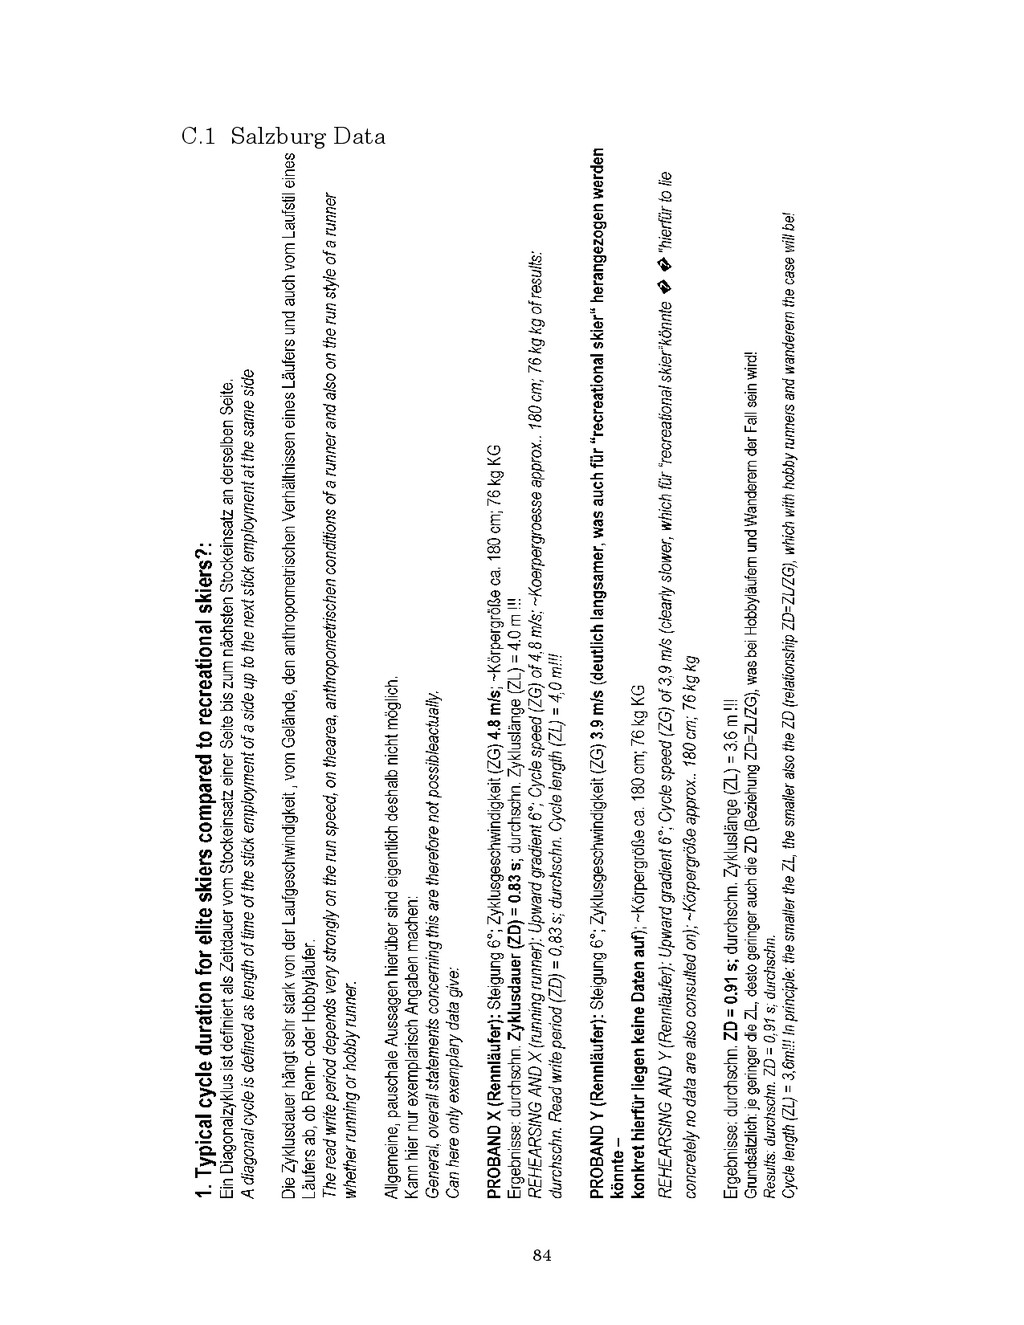
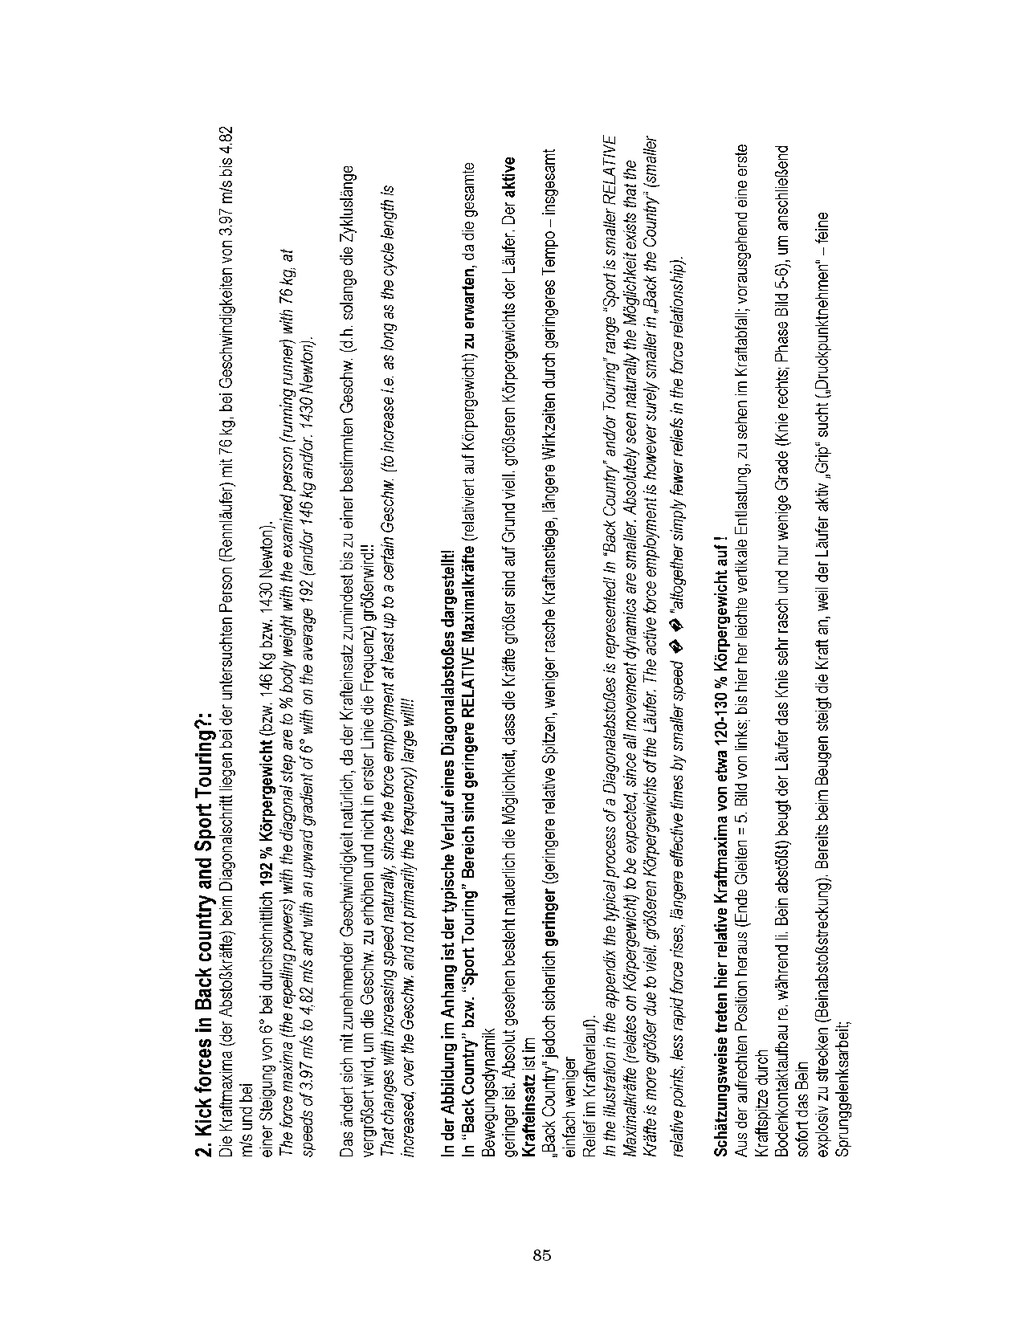
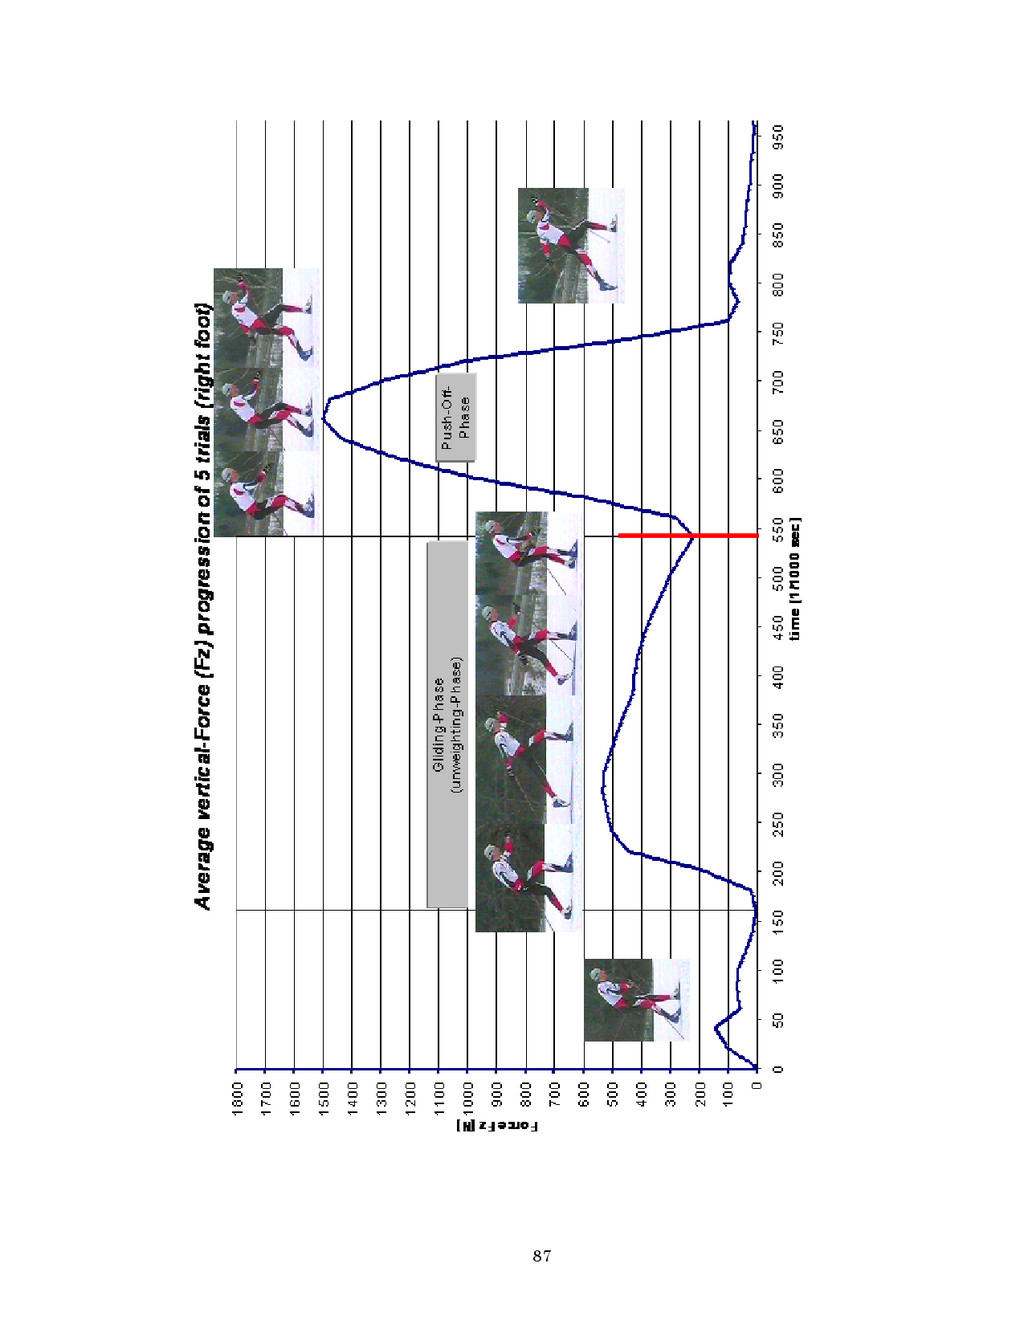
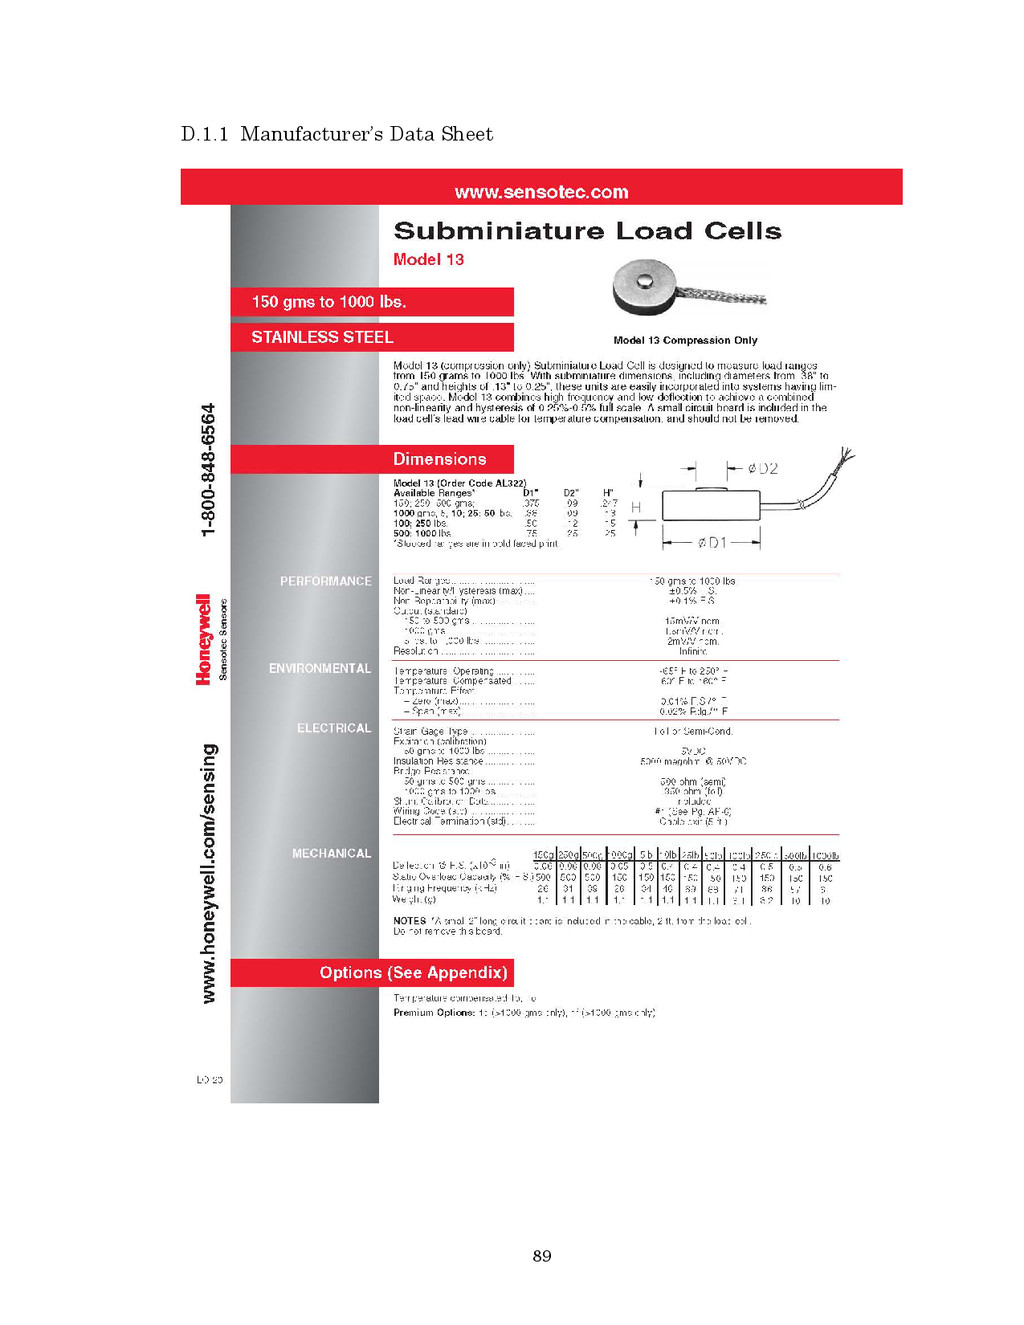
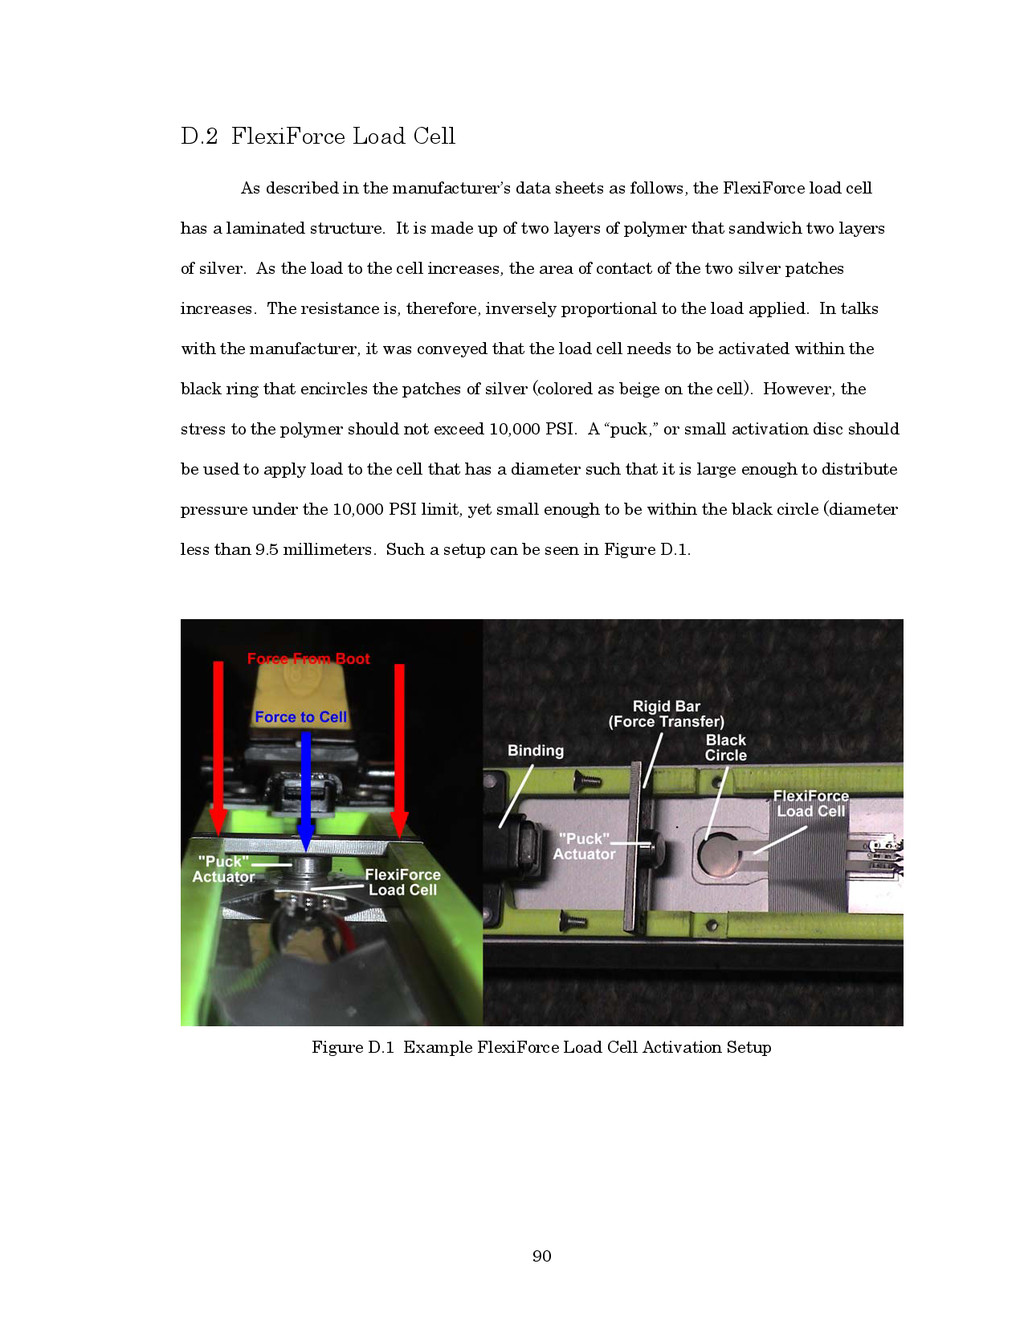
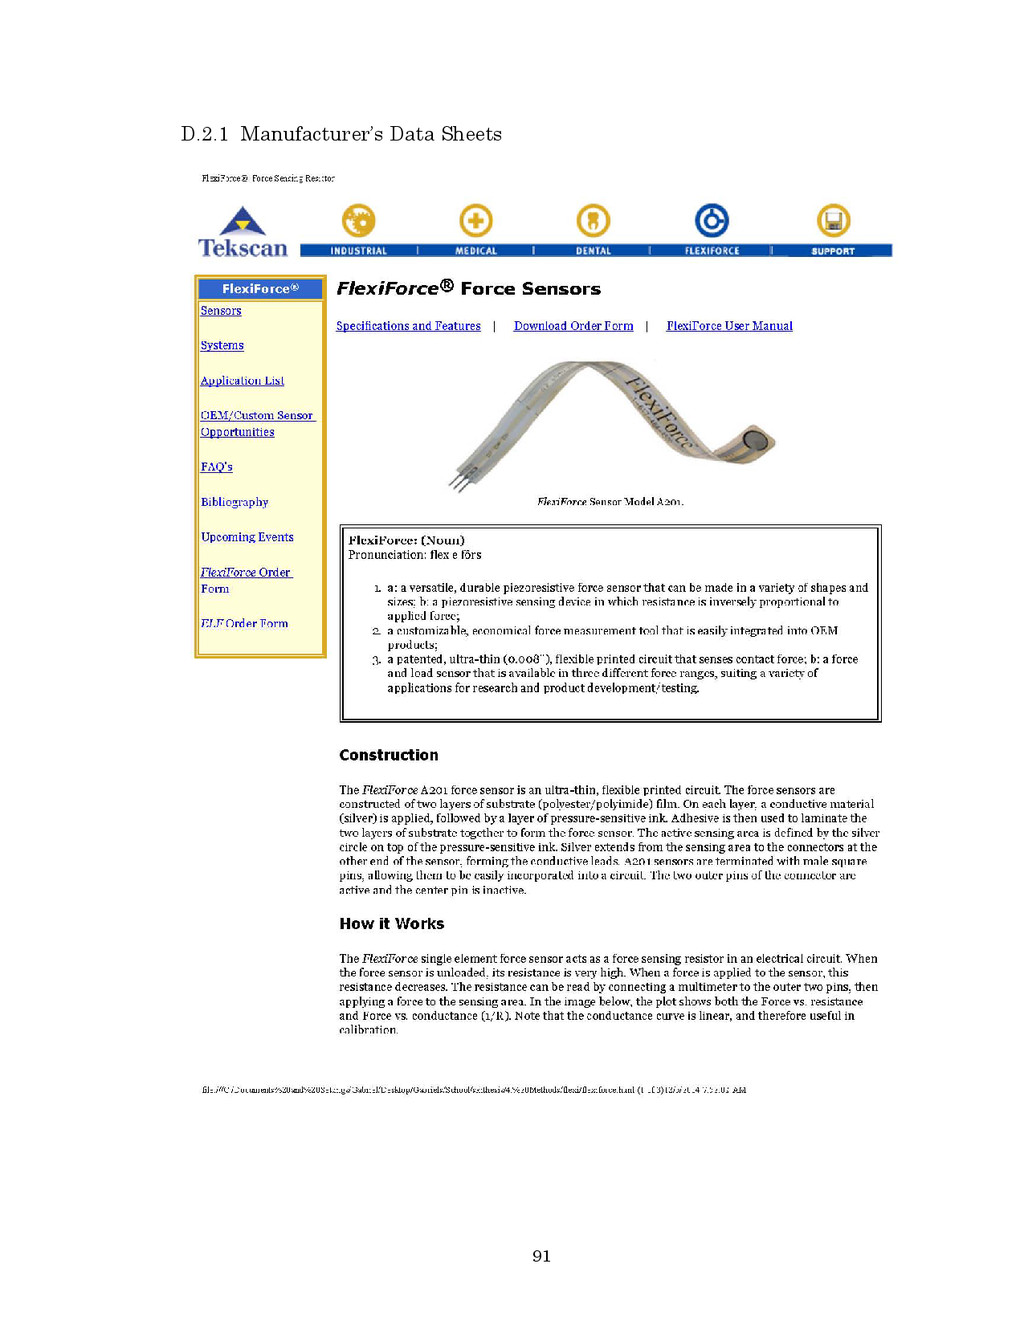
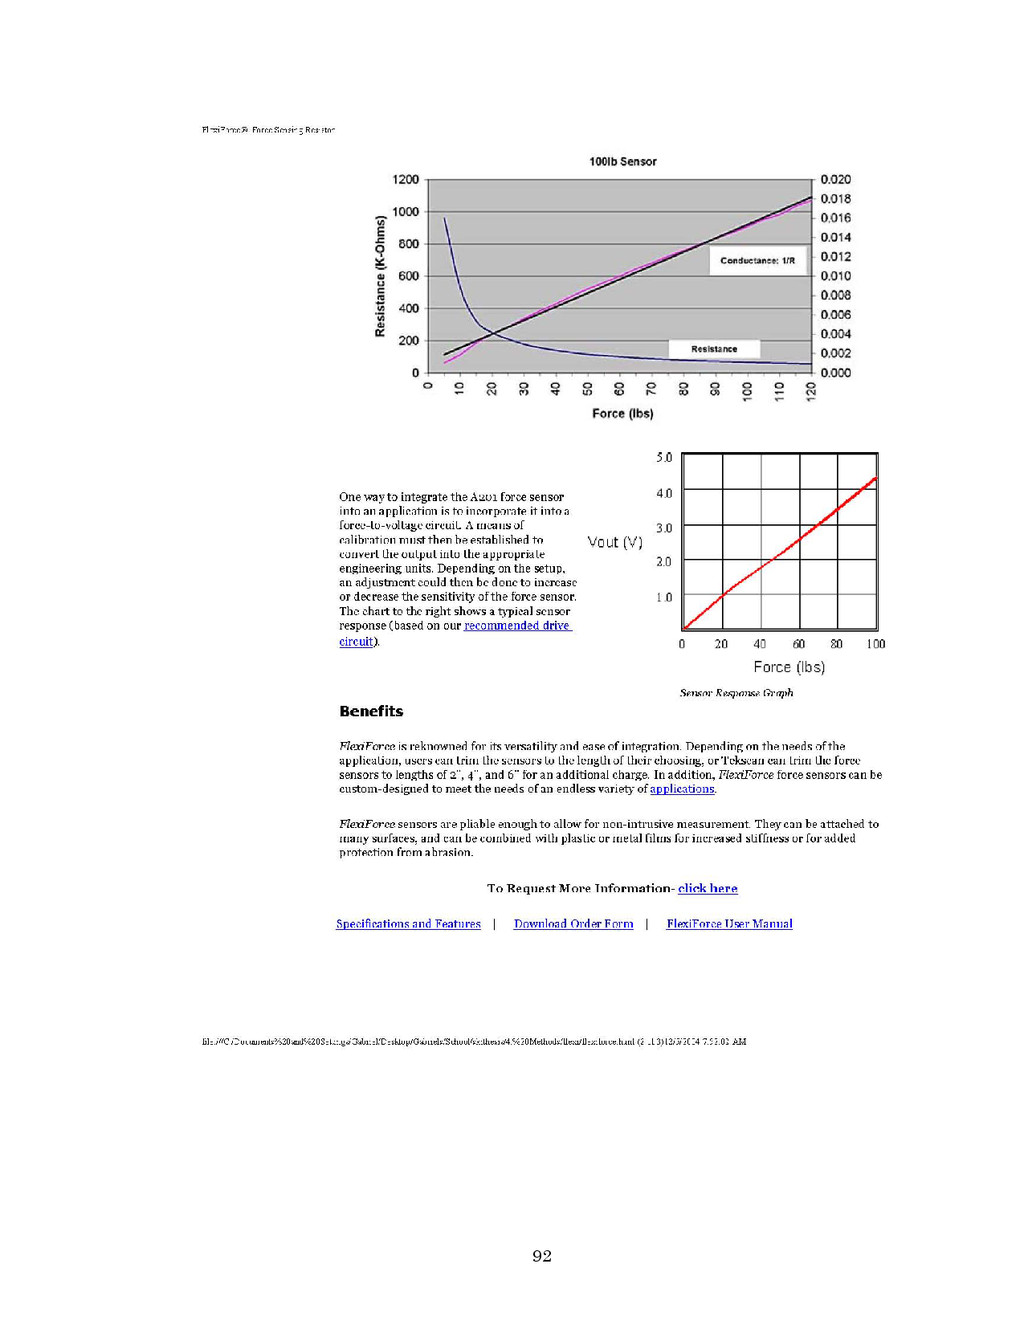
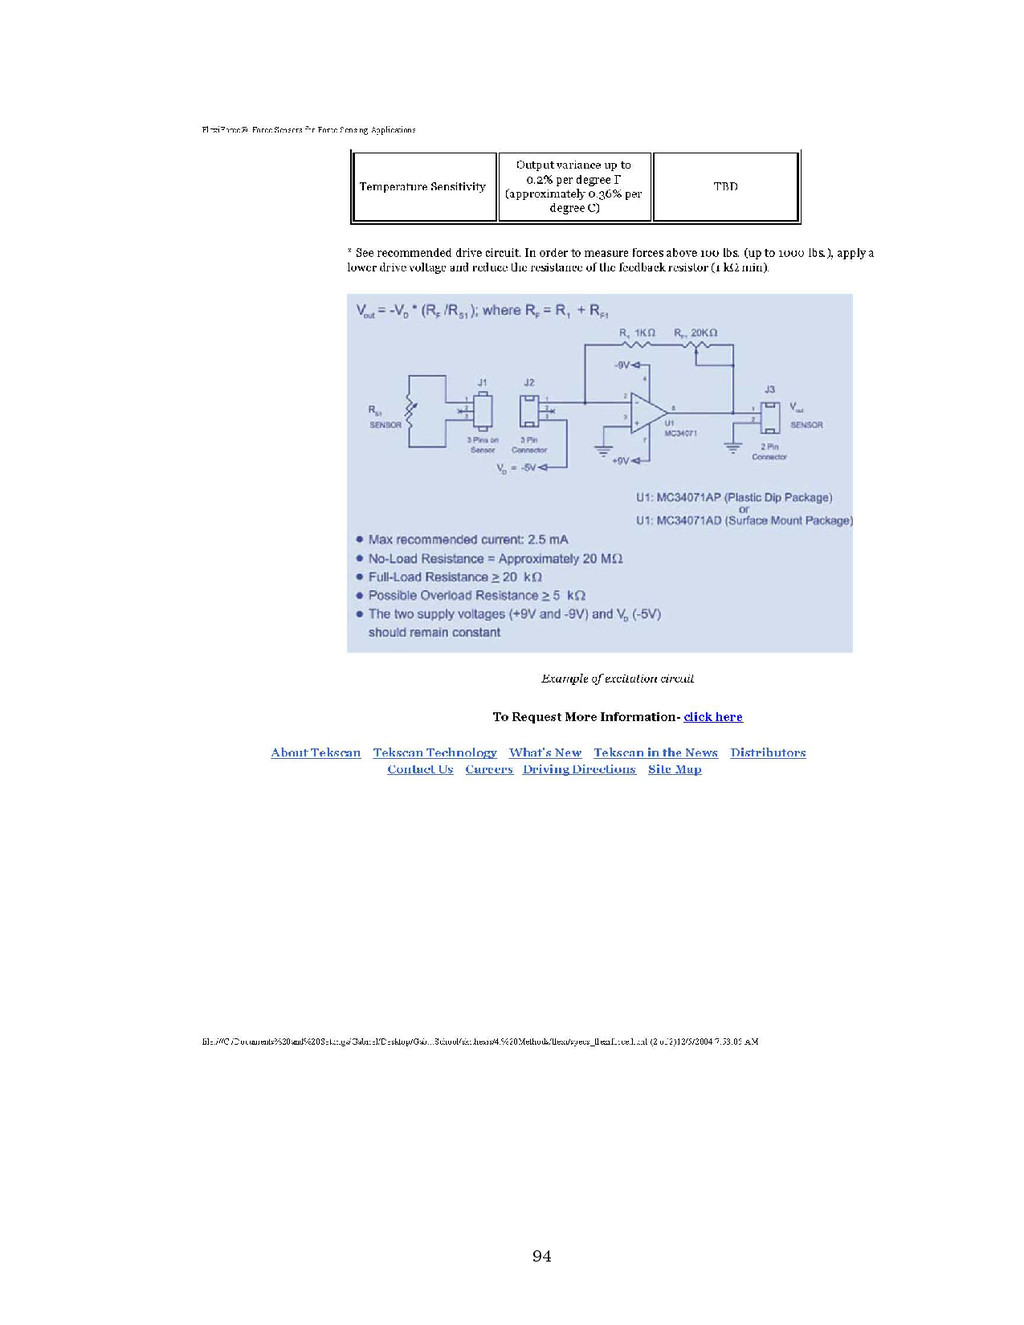
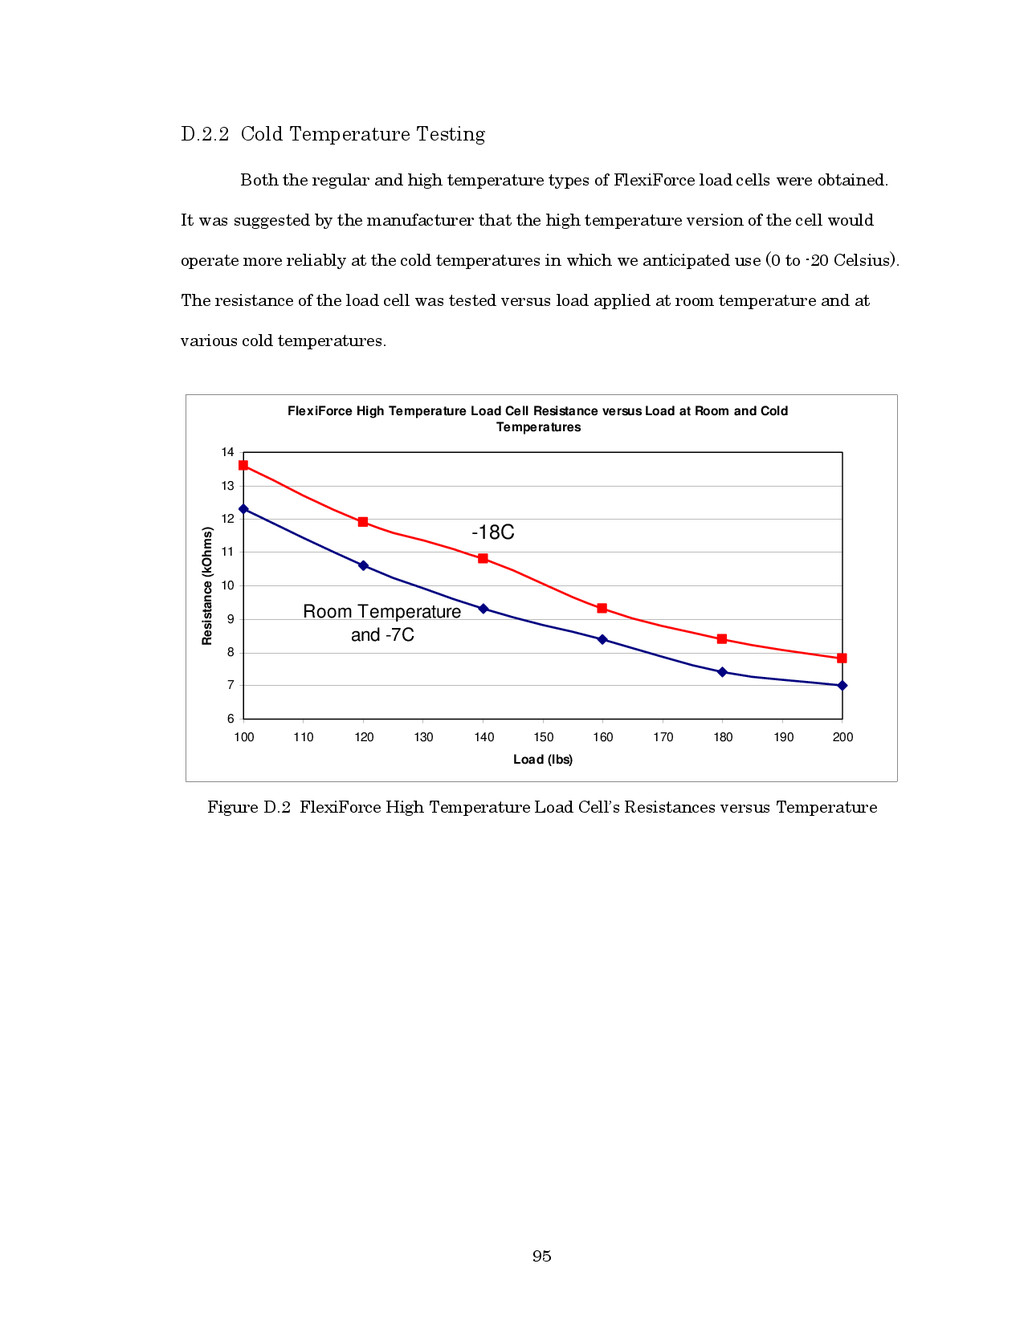
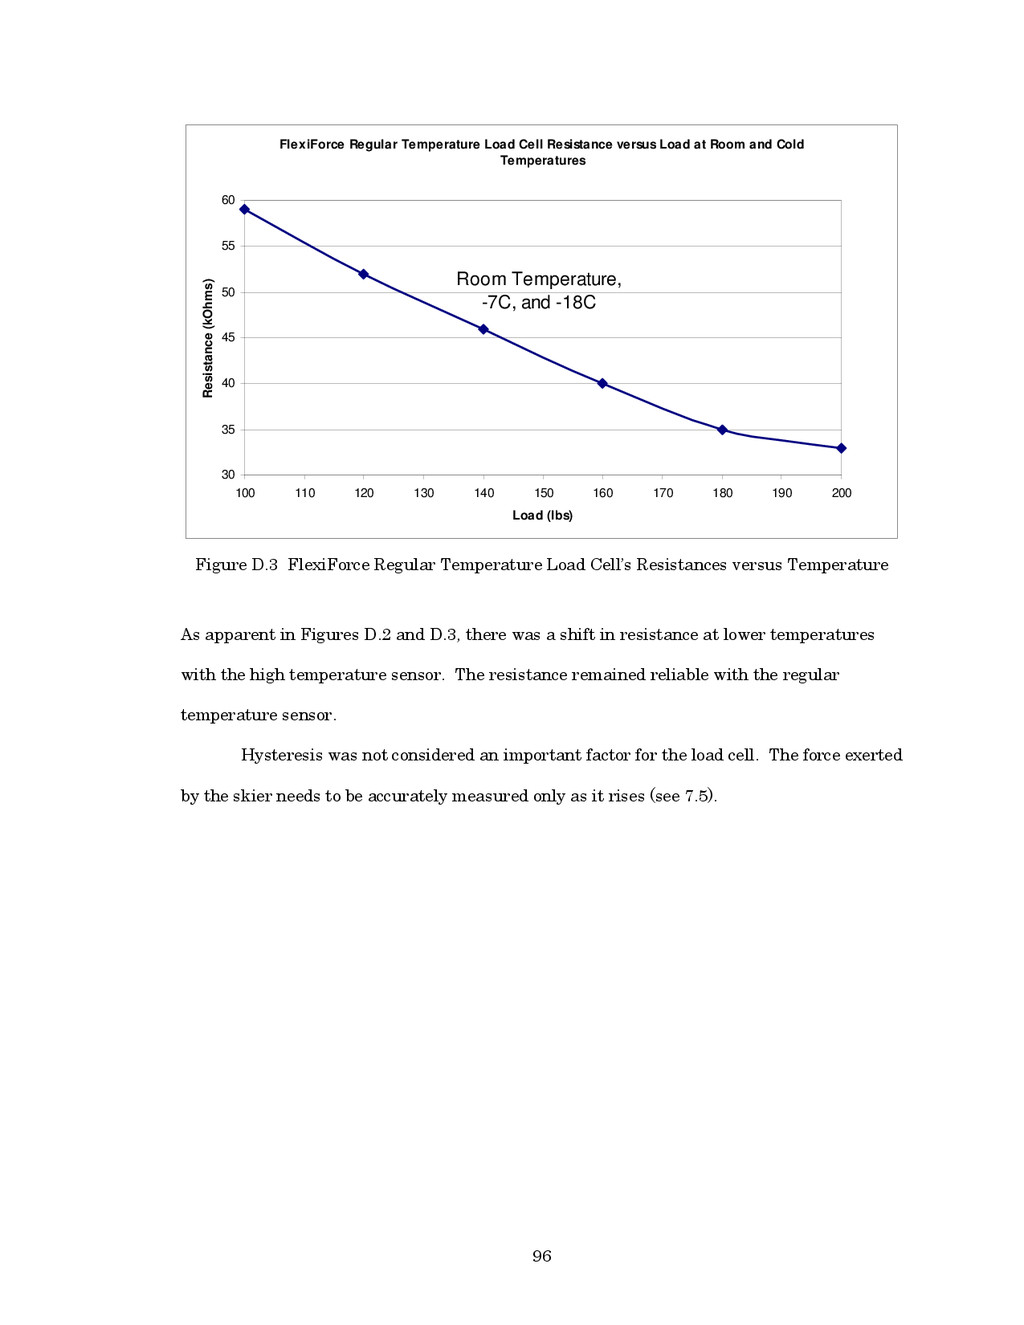
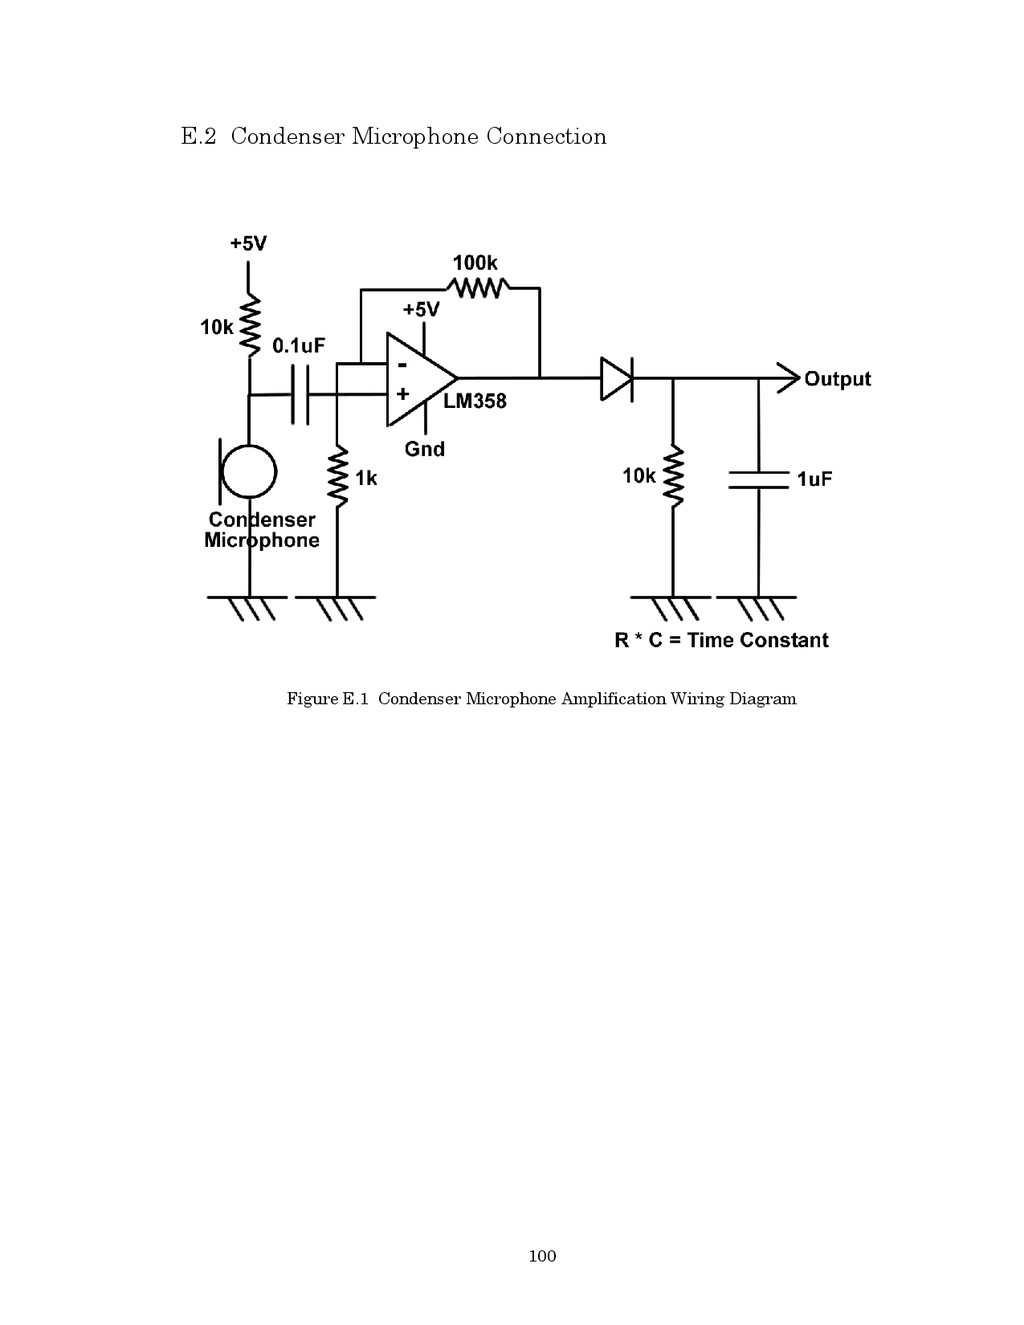
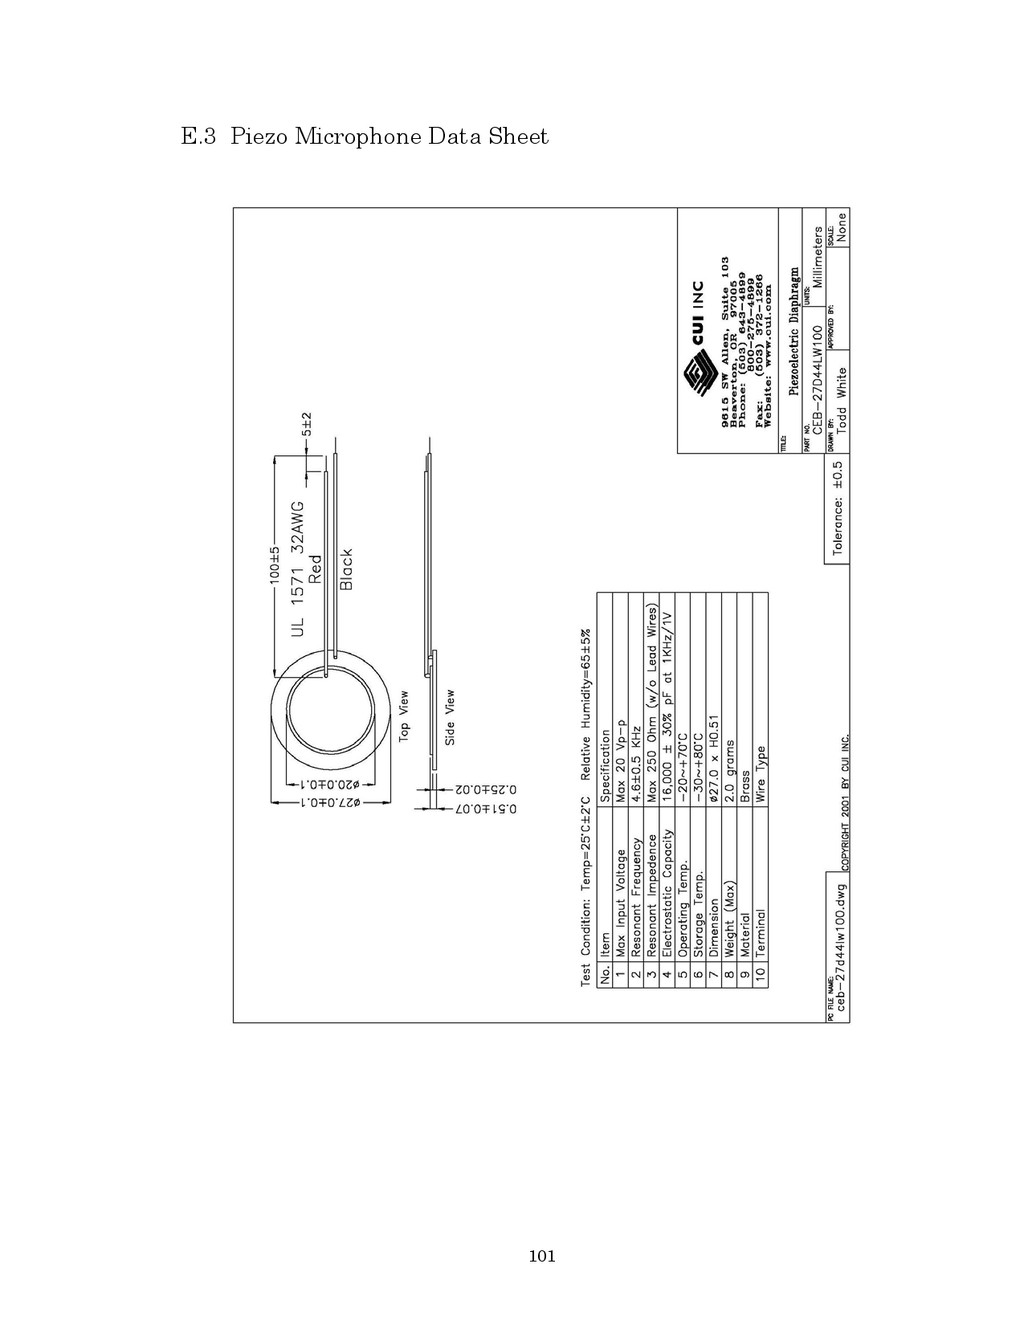
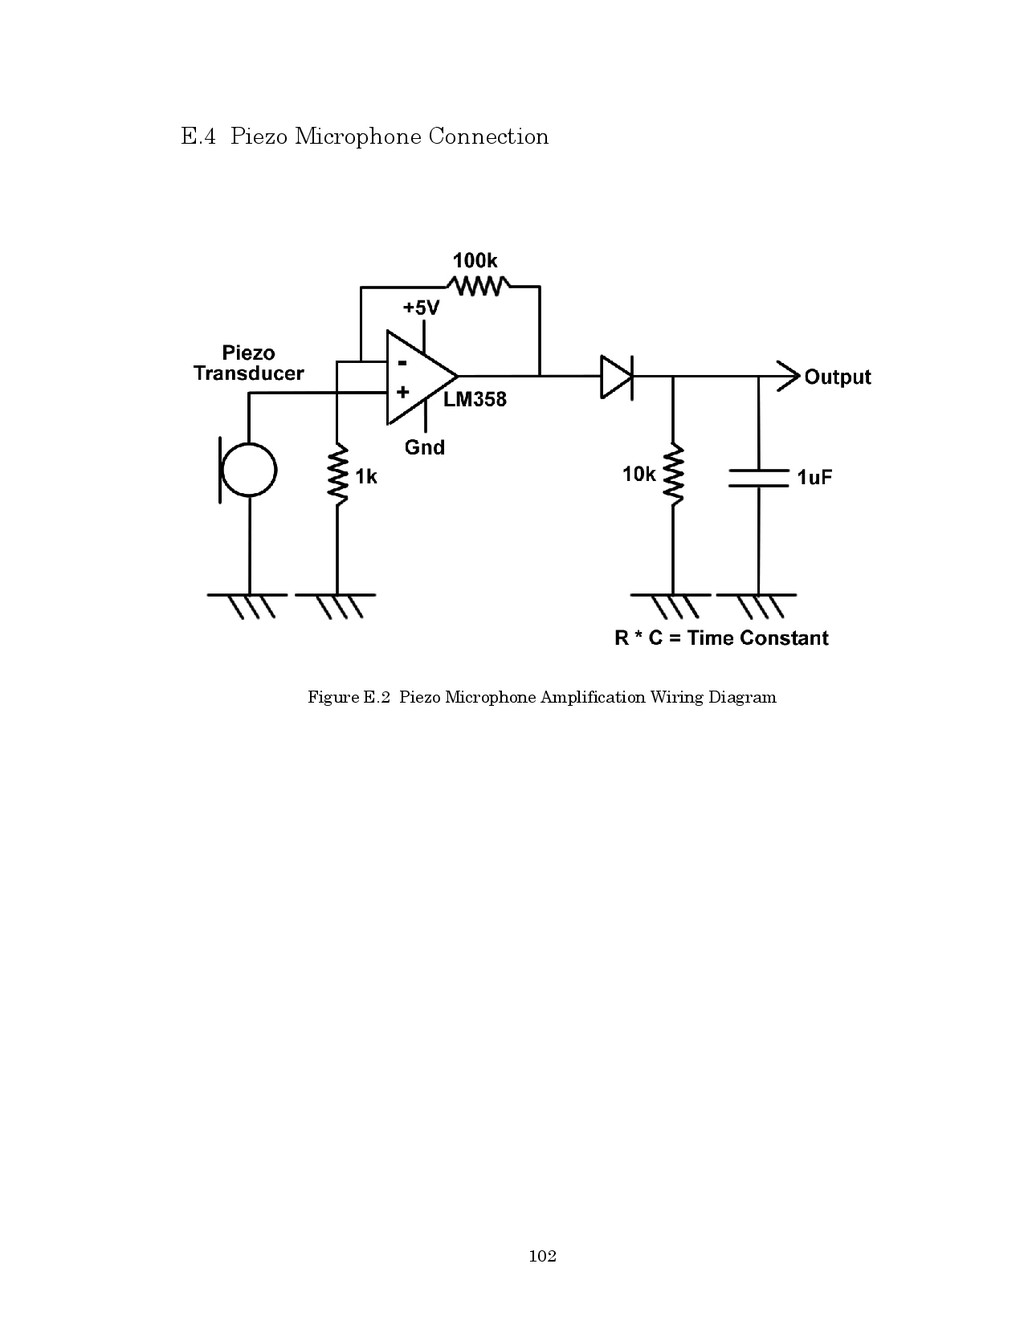
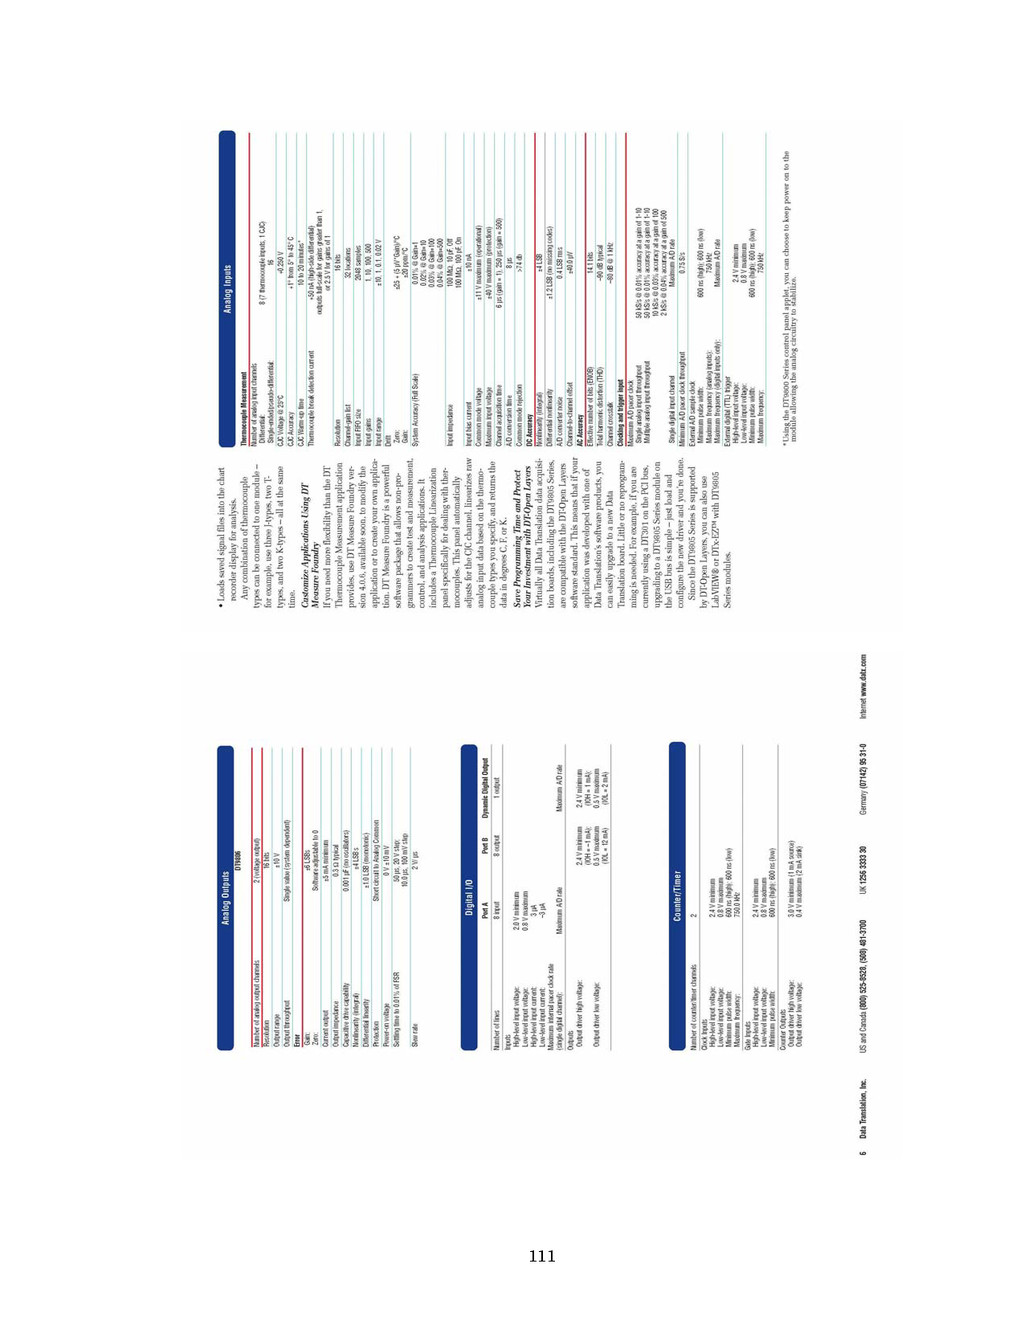
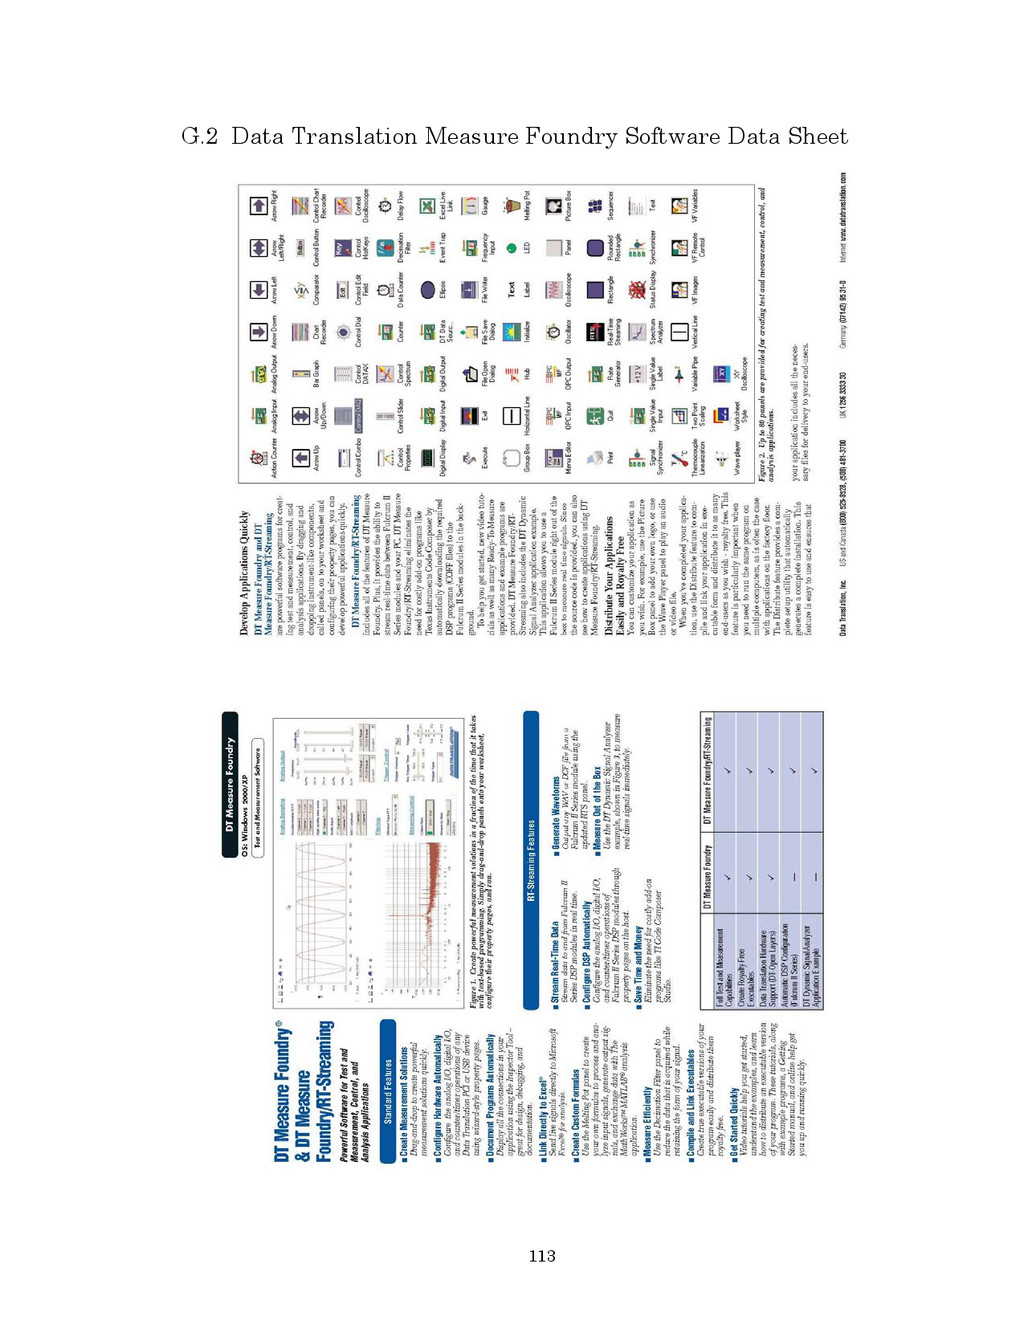
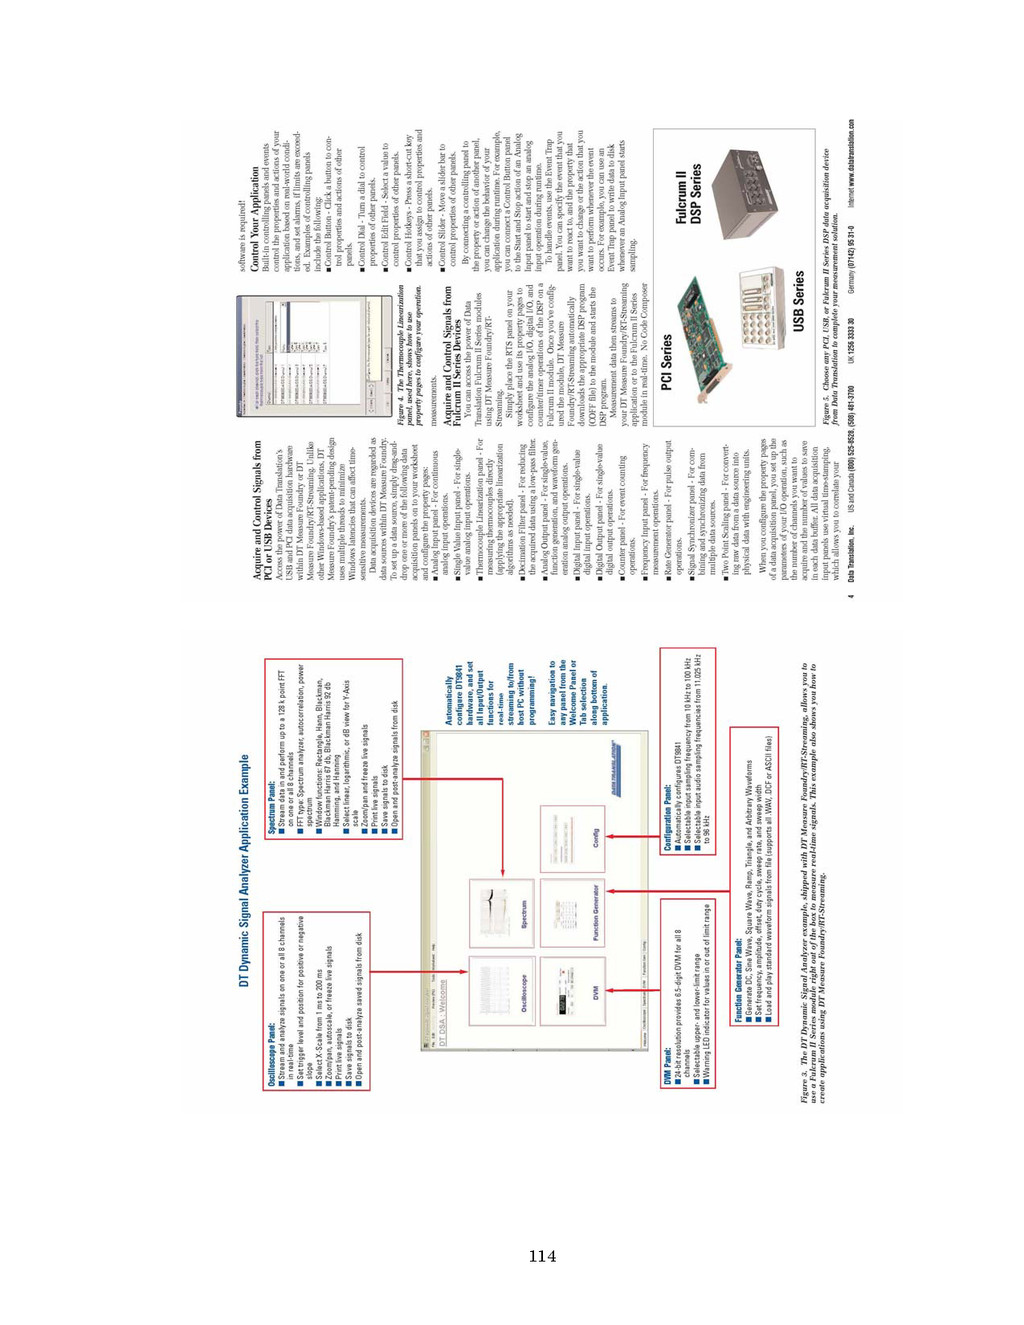
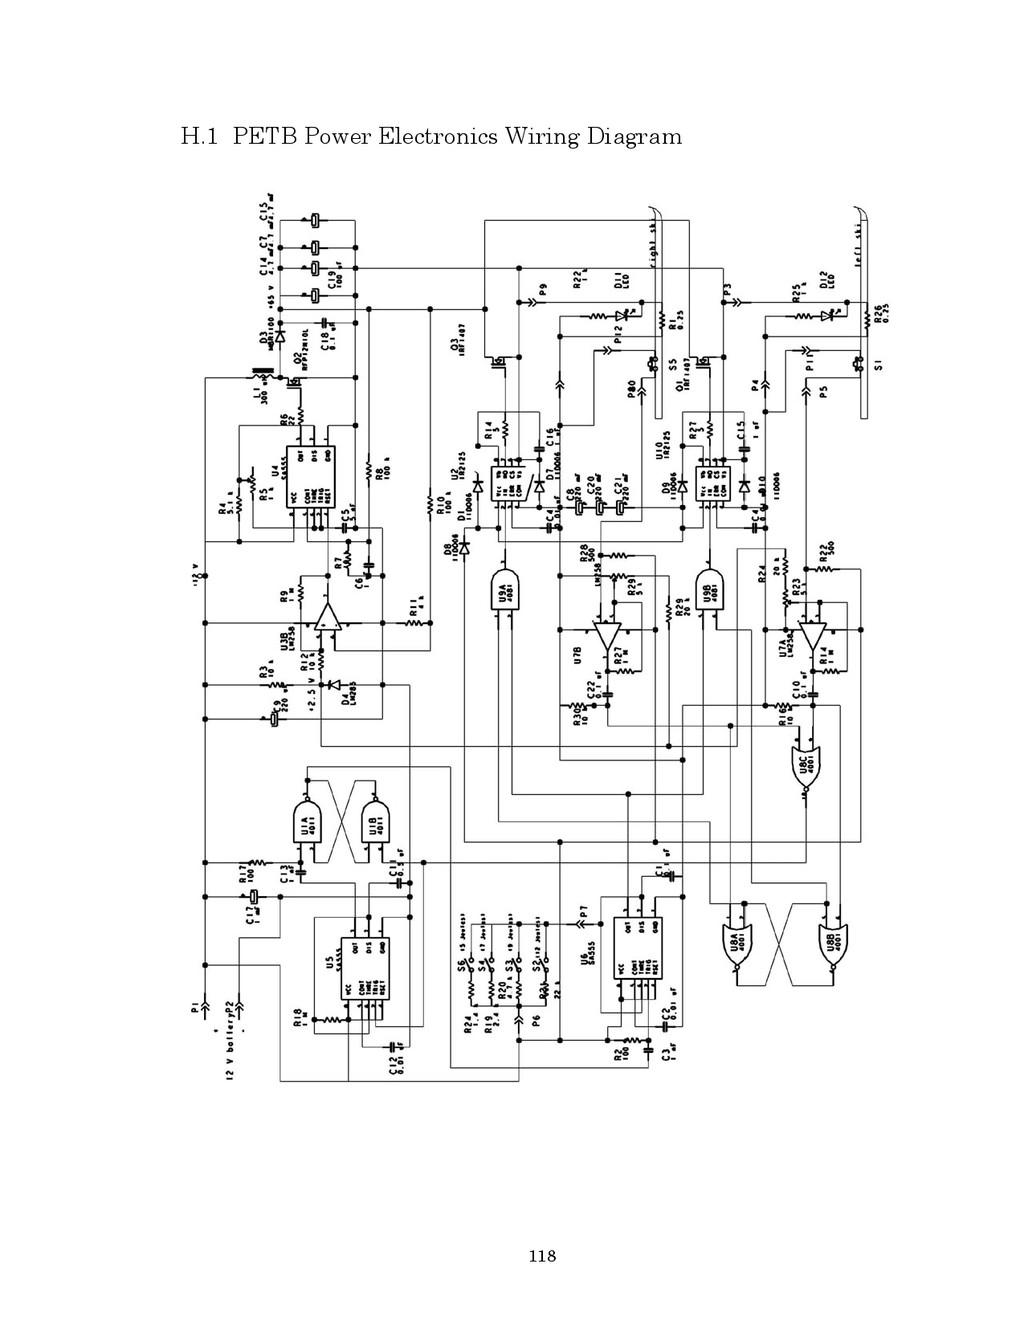
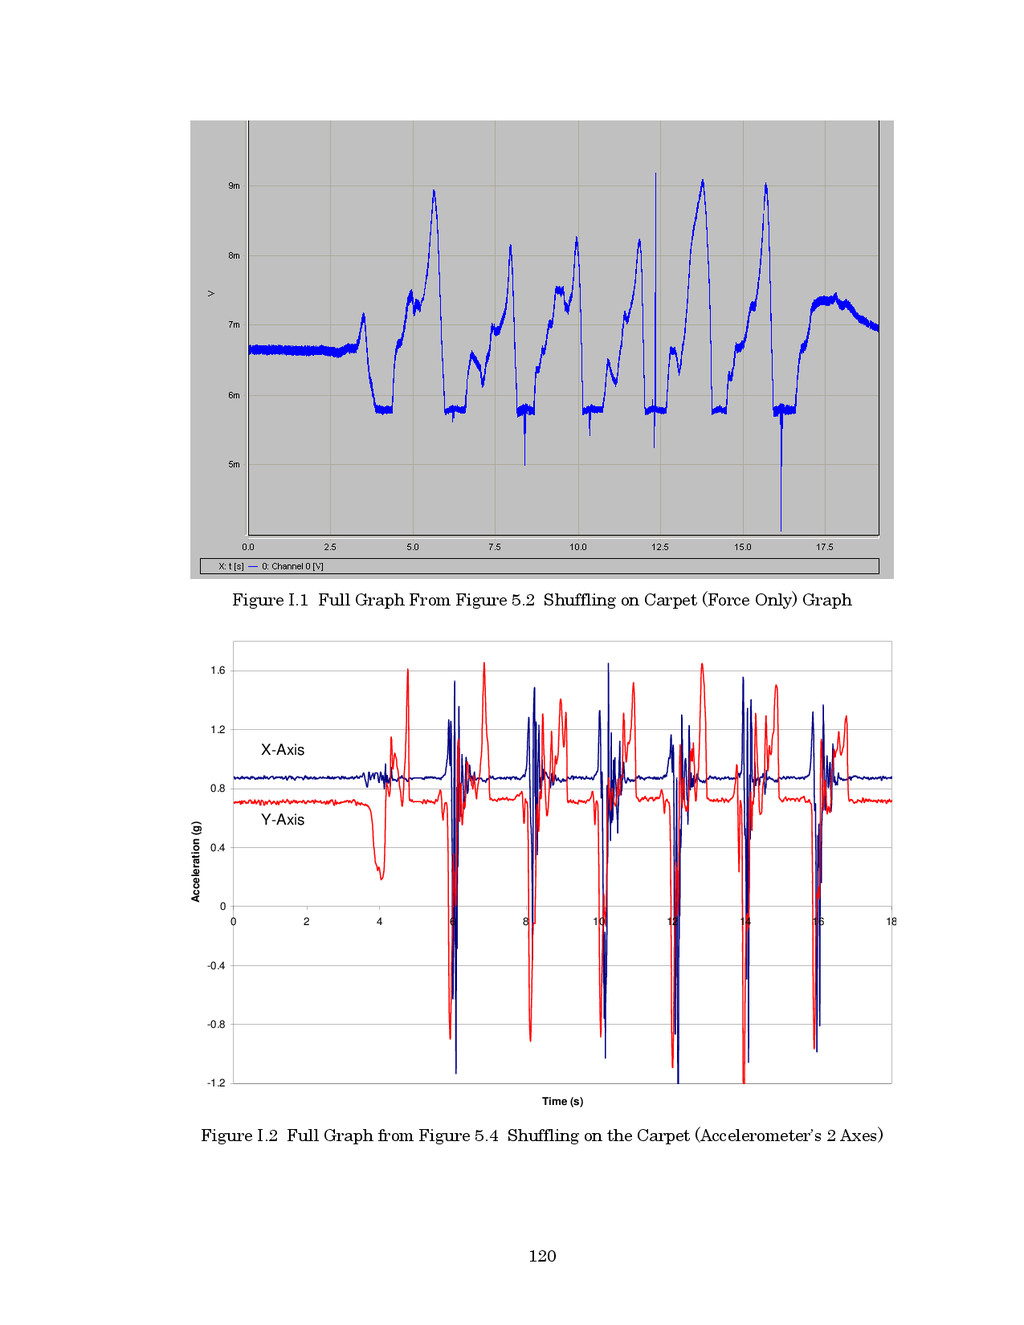
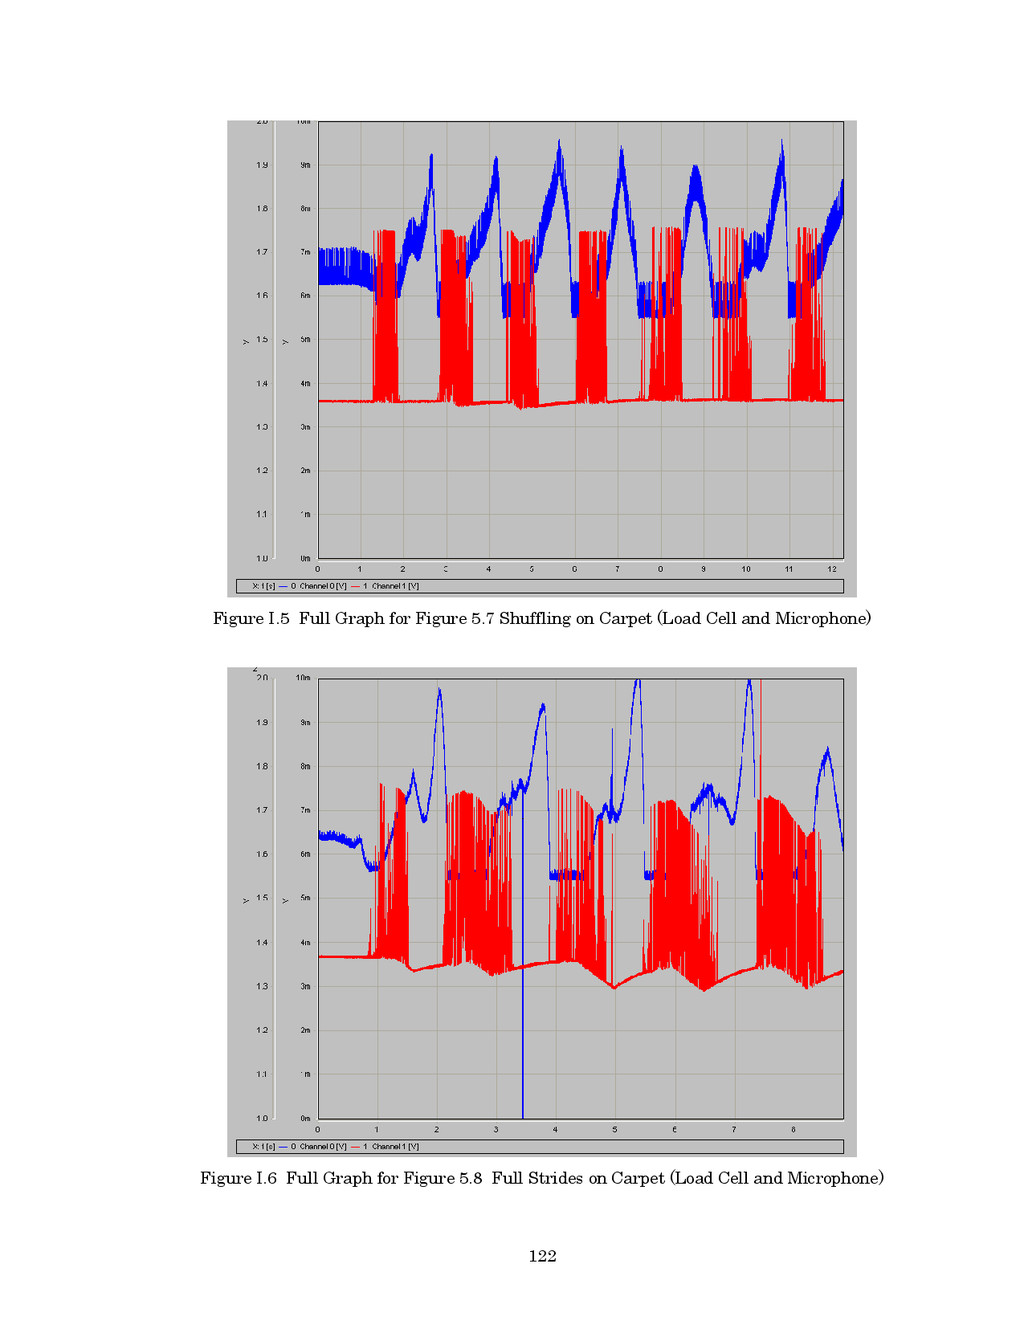
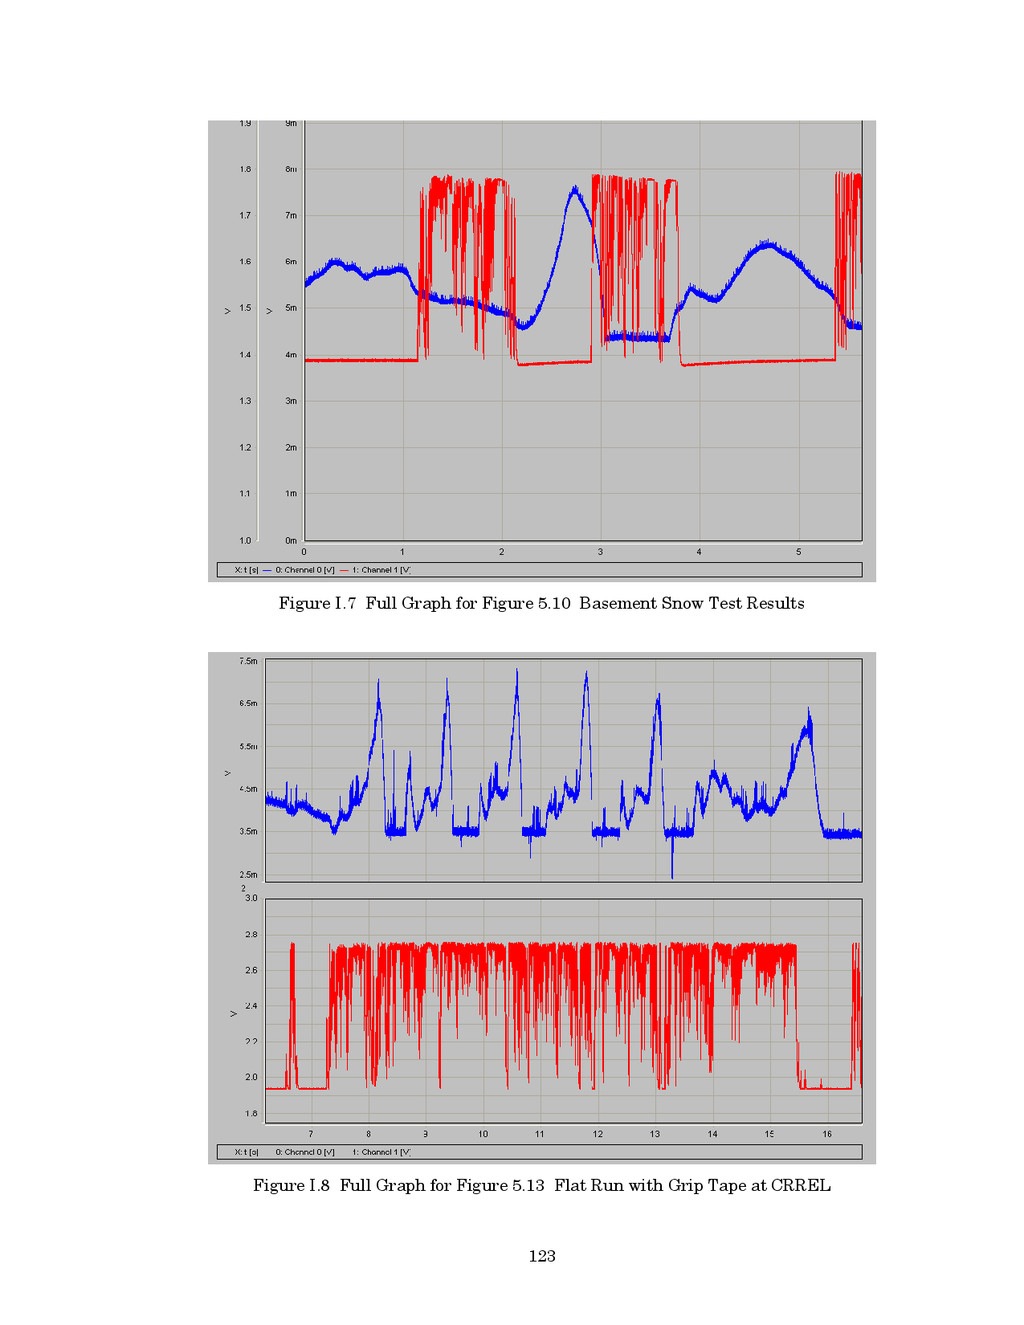
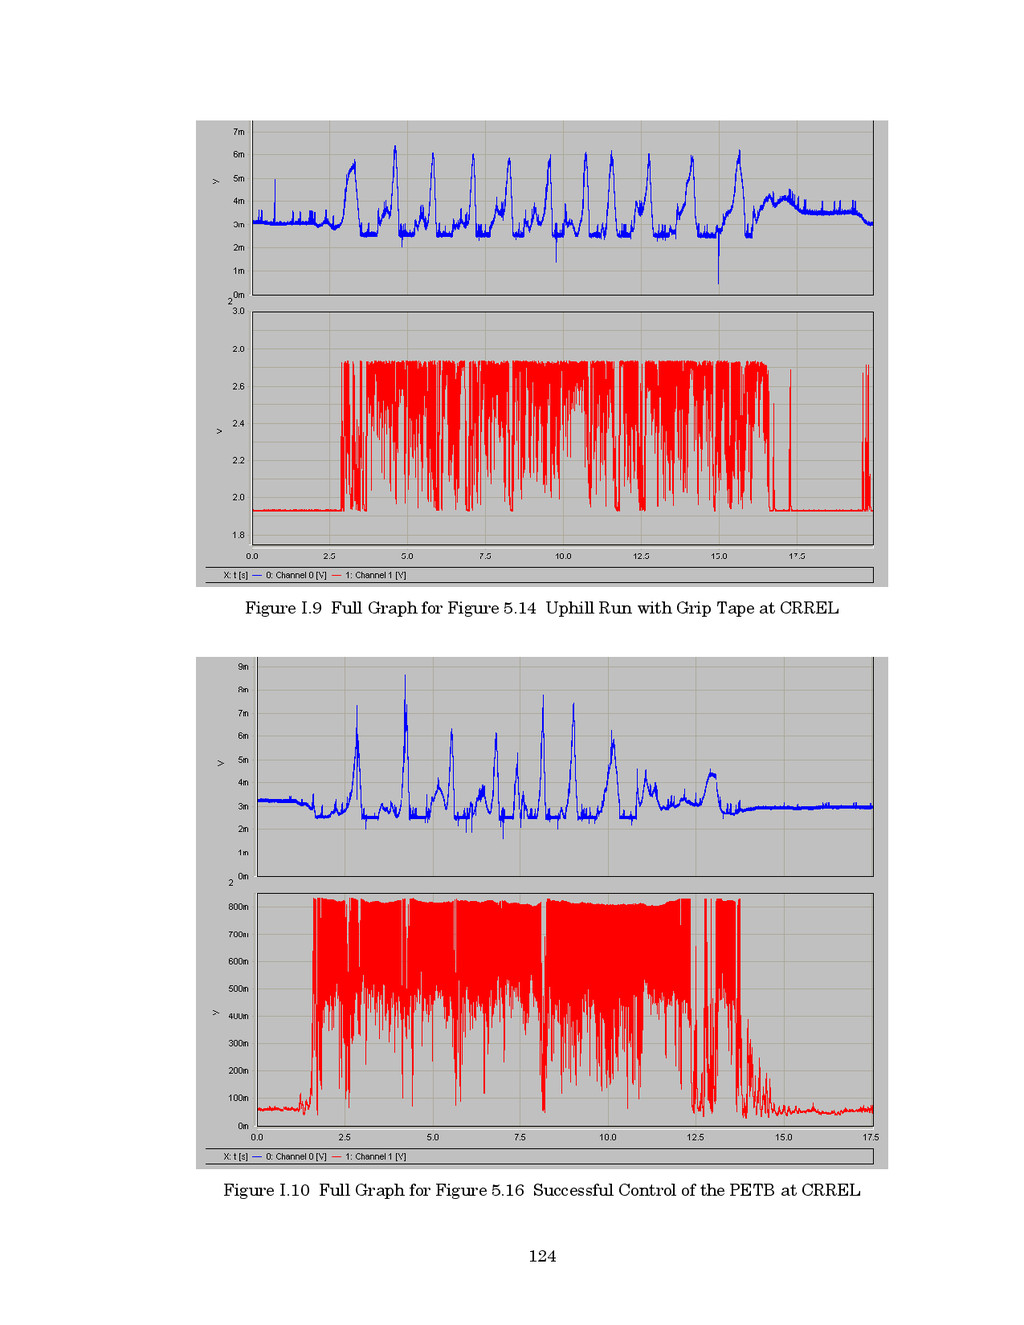
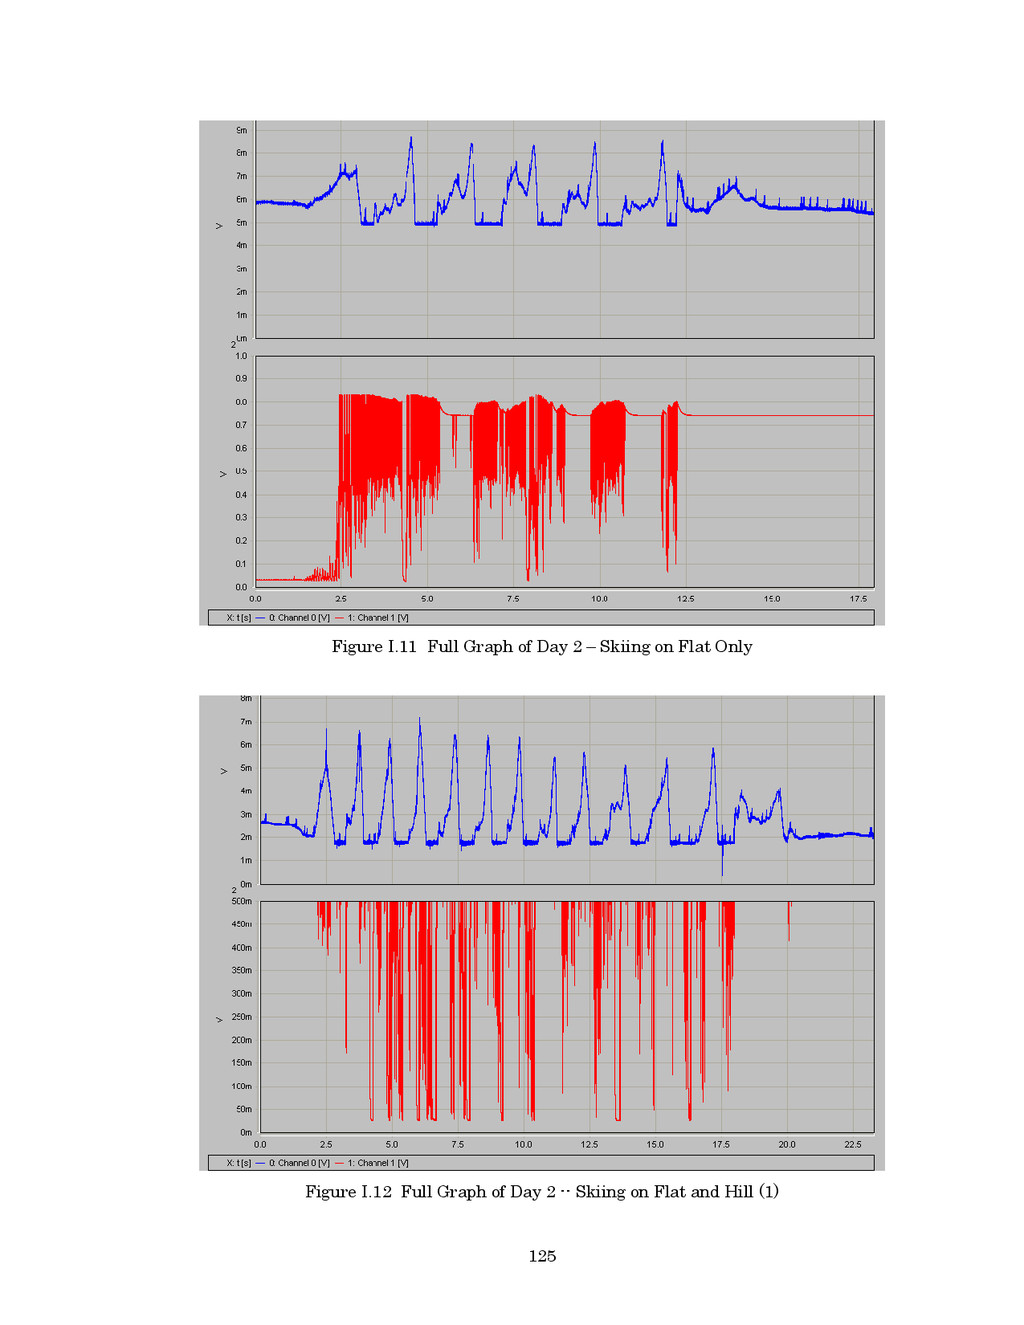
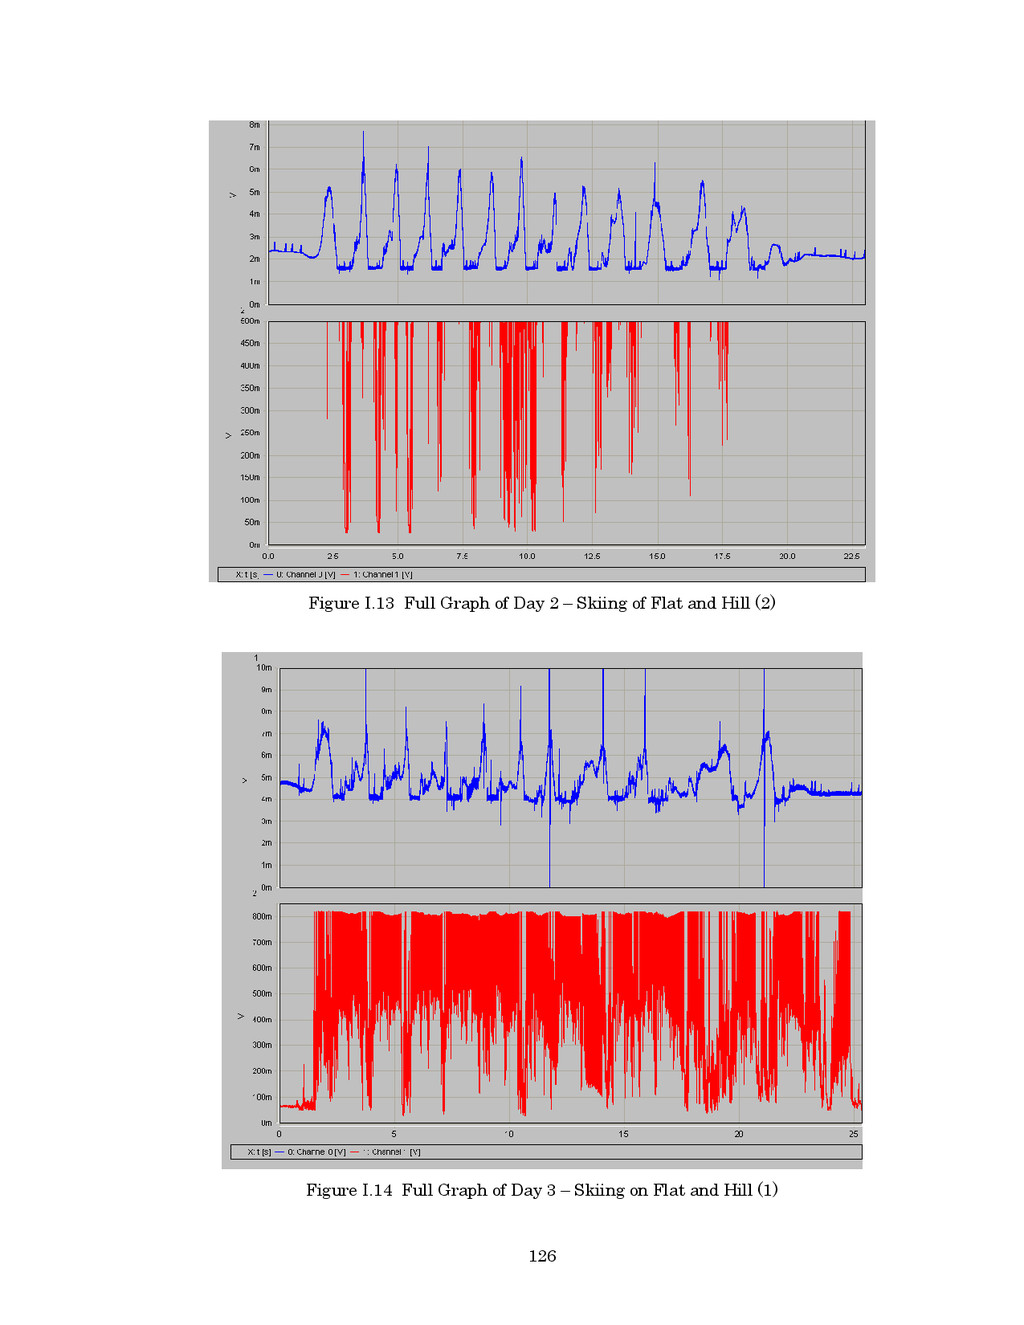
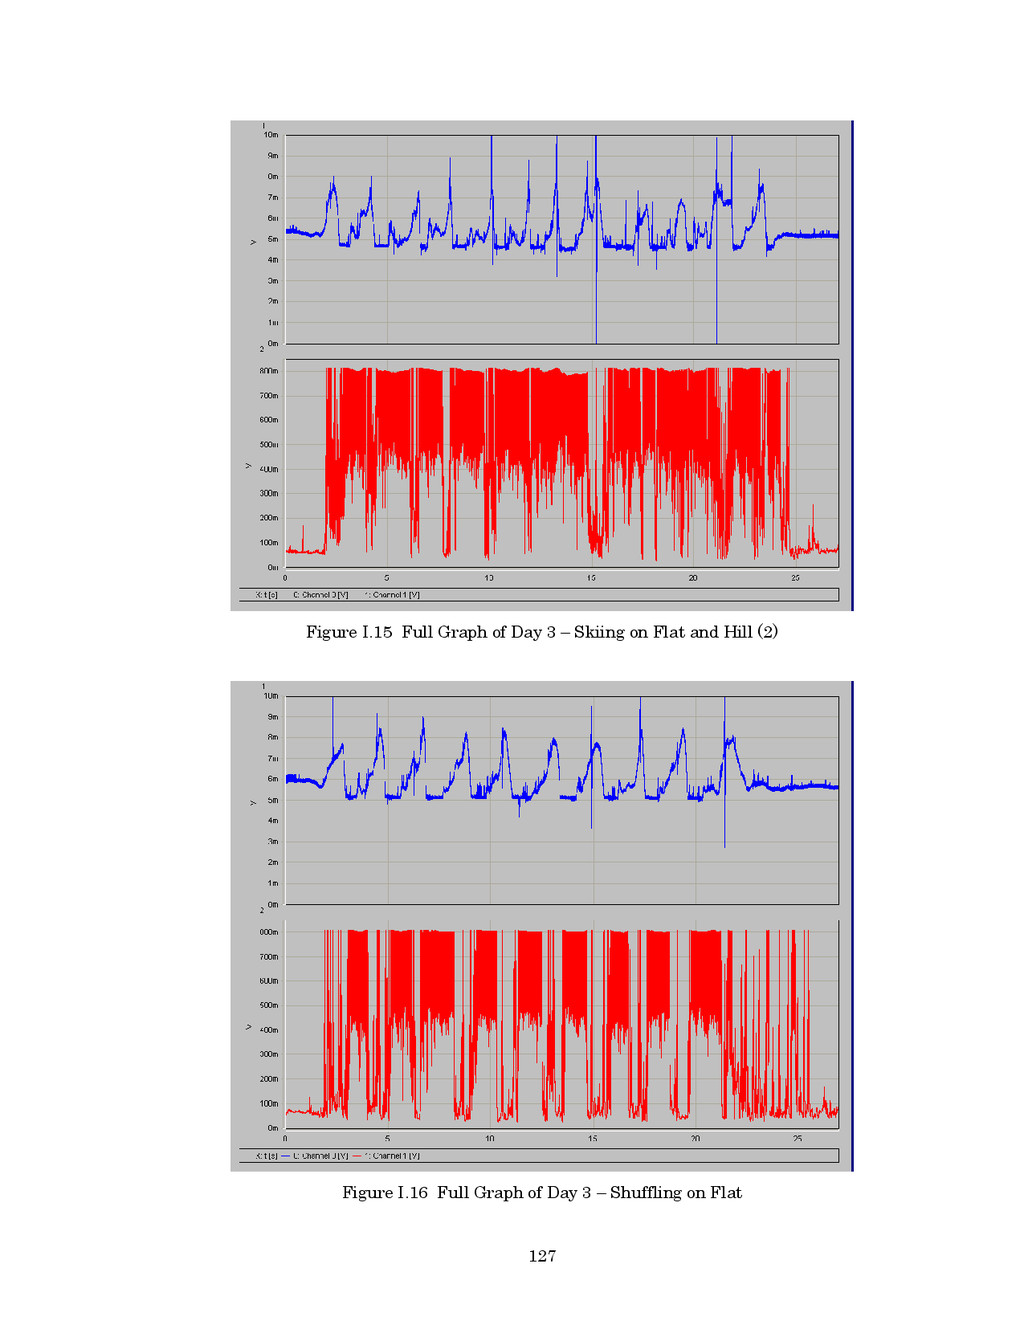
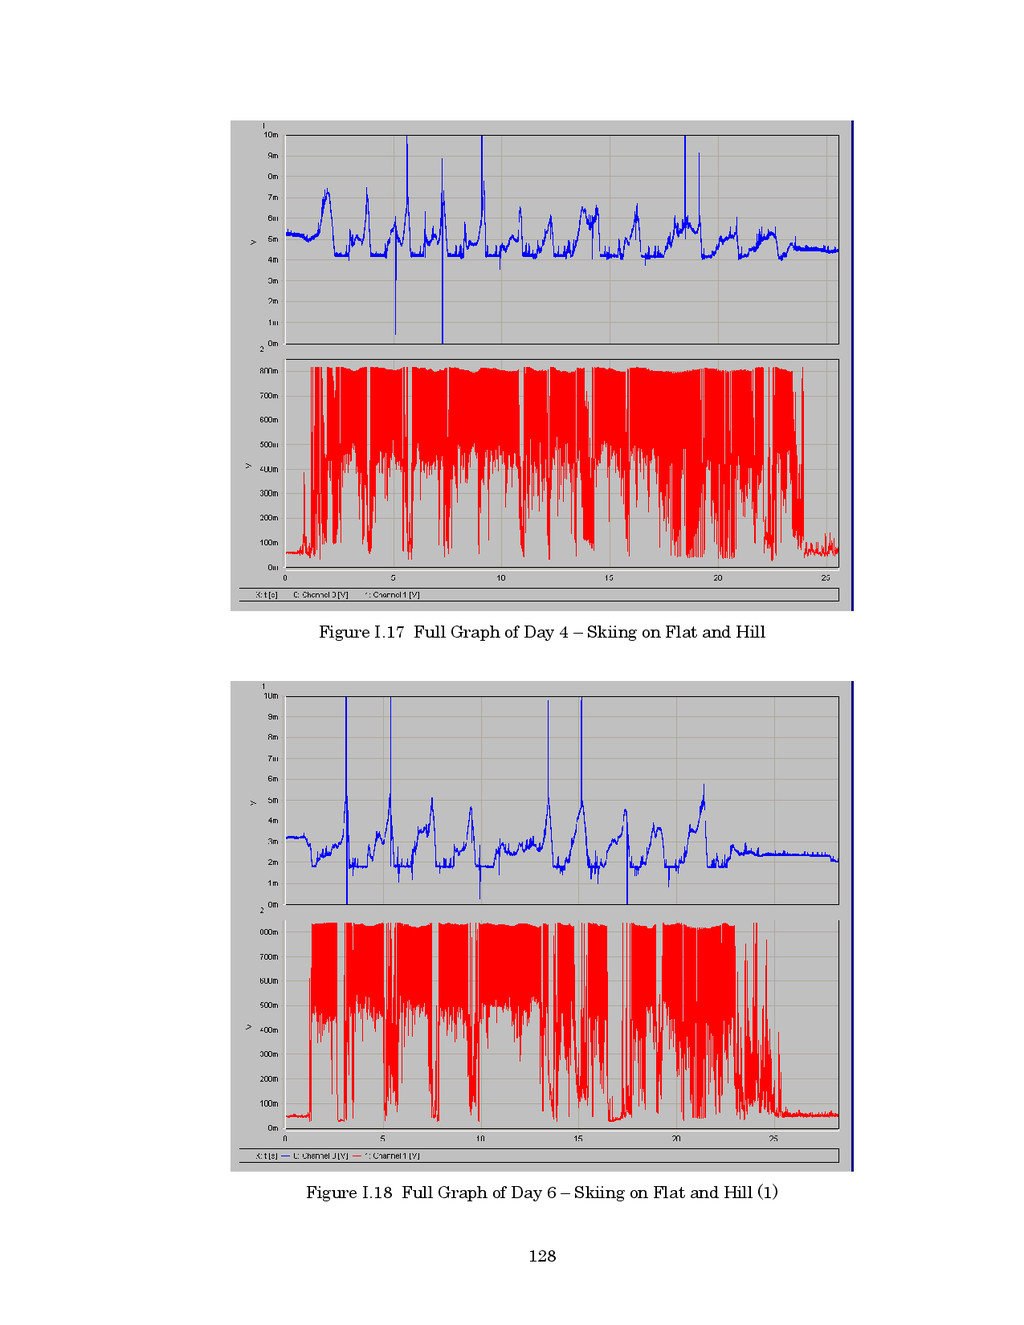
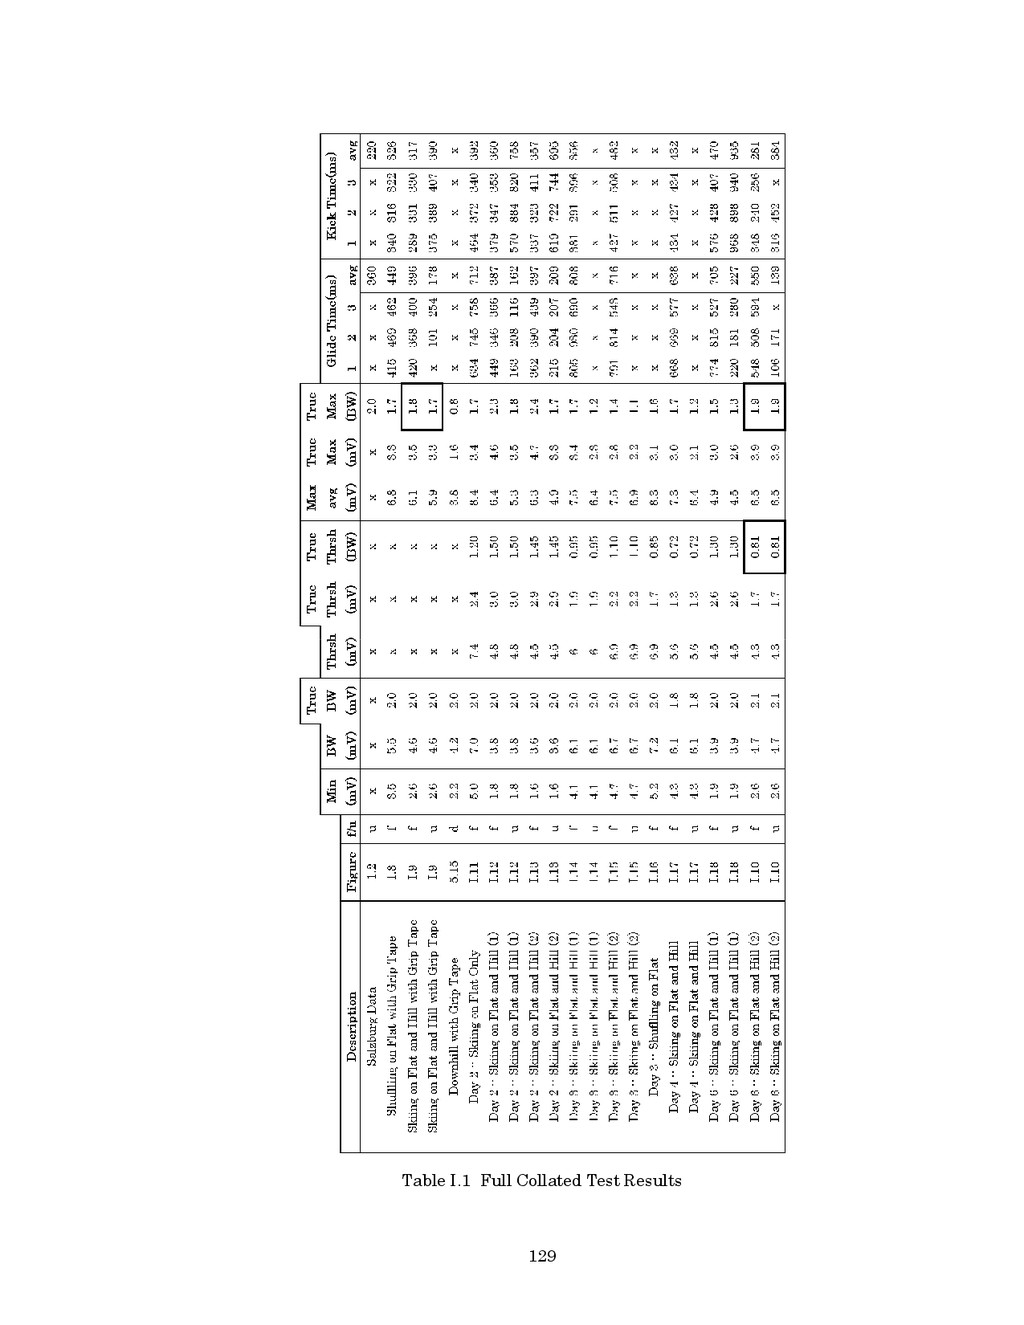
![134 Works Cited [1] Smith, Gerald A., “Biomechanics of Cross](https://files.speakerdeck.com/presentations/3f2ee4309668013157027e3205d19d29/slide_143.jpg)
![135 [14] Unknown Author (2004). Thermal Conductivity Measurements in Snow.](https://files.speakerdeck.com/presentations/3f2ee4309668013157027e3205d19d29/slide_144.jpg)