$30 off During Our Annual Pro Sale. View Details »

The Colors of the Robert Koch Institute

Georges Hattab
November 12, 2023

The Colors of the Robert Koch Institute

Georges Hattab

November 12, 2023
Tweet

More Decks by Georges Hattab

Other Decks in Design

Transcript

  1. The Colors of the Robert Koch Institute


    Revisiting and Extending the Corporate Identity
    PD Dr Georges Hattab


    Center for Artificial Intelligence in Public Health Research

    2023 | Berlin | ZKI-PH 5 Visualization
    1

    View Slide

  2. Color For Humans
    Spaces, Theory, Accessibility, Visualization, Color Deficient Simulation, Revise
    2

    View Slide

  3. The Eye
    3
    Eye: Tony Graham/Getty Images, adapted by J. Hirshfeld; webvision.med.utah.edu

    View Slide

  4. Color: a Relative Medium
    4
    Johannes Itten’s The Elements of Color (public PDF)
    Josef Albers’s Interaction of Color

    View Slide

  5. ▪ Corporate Identity (CI)


    ▪ Two Strategies for Color Palettes


    ▪ Ten Simple Rules and Summary


    ▪ Color Blindness Simulation


    ▪ Accessibility & Inclusion Practices


    ▪ Examples of Integrated Charts


    ▪ Eight Use Cases in the R language


    ▪ Outcomes & Availability
    Contents
    5
    VH1
    VH3
    VH4
    VH5
    VH6
    JH1 JH2
    JH3
    JH4
    JH5
    JH6
    0
    800
    1600
    0
    800
    1600
    2400
    3200
    4000
    4800
    5600
    6400
    0
    800
    1600
    2400
    3200
    0
    0
    0
    0
    0
    800
    0
    800
    1600
    2400
    3200
    4000
    4800
    5600
    6400
    7200
    8000
    0
    800
    0
    800
    Example Chord Diagram

    View Slide

  6. Corporate Identity: The RKI Blue
    6
    Publikationsumschläge Robert Koch-Institut · Hausfarbe
    Stand: . September zurück zum Inhaltsverzeichnis
    Hausfarbe
    Neue Hausfarbe des Robert Koch-Instituts ist Pantone C. Auf den Umschlägen wird ausschließlich RKI-Blau verwendet, ergänzt
    um schwarz als Kontrastfarbe für Bildmotive. Die genaue Auslobung für die Verwendung der Farben finden Sie auf Seite Seite .
    Beim Druck auf ungestrichene Papiere ist zu beachten, dass der Farbton der Referenz für gestrichene Papiere entspricht!
    Da Pantone-Farbfächer altern und Varianzen haben, gibt es einen vom RKI angefertigten, farbverbindlichen Proof, der jeder
    Druckerei als Referenz zur Verfügung gestellt wird. Bereits bei Druckanfragen ist unbedingt darauf hinzuweisen, dass dieser Proof
    verbindlich ist und abweichende Druckergebnisse nicht abgenommen werde. Der farbverbindliche Proof ist bei der Pressestelle
    erhältlich.
    RKI Hausfarbe: Pantone C
    % Pantone C
    %
    %
    %
    %
    %
    %
    %
    %
    %
    %
    %
    %
    %
    %
    %
    %
    %
    %
    Vierfarb-Umrechnung ( c Euroskala)
    % Euroskala C M Y K
    %
    %
    %
    %
    %
    %
    %
    %
    %
    %
    %
    %
    %
    %
    %
    %
    %
    %
    RGB/Hex-Werte für Office/Internet-Anwendungen
    % R G B | Hex # ec
    %
    %
    %
    %
    %
    %
    %
    %
    %
    %
    %
    %
    %
    %
    %
    %
    %
    %
    Publikationsumschläge Robert Koch-Institut · Hausfarbe
    Stand: . September zurück zum Inhaltsverzeichnis
    Hausfarbe
    Neue Hausfarbe des Robert Koch-Instituts ist Pantone C. Auf den Umschlägen wird ausschließlich RKI-Blau verwendet, ergänzt
    um schwarz als Kontrastfarbe für Bildmotive. Die genaue Auslobung für die Verwendung der Farben finden Sie auf Seite Seite .
    Beim Druck auf ungestrichene Papiere ist zu beachten, dass der Farbton der Referenz für gestrichene Papiere entspricht!
    Da Pantone-Farbfächer altern und Varianzen haben, gibt es einen vom RKI angefertigten, farbverbindlichen Proof, der jeder
    Druckerei als Referenz zur Verfügung gestellt wird. Bereits bei Druckanfragen ist unbedingt darauf hinzuweisen, dass dieser Proof
    verbindlich ist und abweichende Druckergebnisse nicht abgenommen werde. Der farbverbindliche Proof ist bei der Pressestelle
    erhältlich.
    RKI Hausfarbe: Pantone C
    % Pantone C
    %
    %
    %
    %
    %
    %
    %
    %
    %
    %
    %
    %
    %
    %
    %
    %
    %
    %
    Vierfarb-Umrechnung ( c Euroskala)
    % Euroskala C M Y K
    %
    %
    %
    %
    %
    %
    %
    %
    %
    %
    %
    %
    %
    %
    %
    %
    %
    %
    RGB/Hex-Werte für Office/Internet-Anwendungen

    View Slide

  7. Corporate Identity: Defining The RKI Blue
    7
    Publikationsumschläge Robert Koch-Institut · Hausfarbe
    Stand: . September zurück zum Inhaltsverzeichnis
    Hausfarbe
    Neue Hausfarbe des Robert Koch-Instituts ist Pantone C. Auf den Umschlägen wird ausschließlich RKI-Blau verwendet, ergänzt
    um schwarz als Kontrastfarbe für Bildmotive. Die genaue Auslobung für die Verwendung der Farben finden Sie auf Seite Seite .
    Beim Druck auf ungestrichene Papiere ist zu beachten, dass der Farbton der Referenz für gestrichene Papiere entspricht!
    Da Pantone-Farbfächer altern und Varianzen haben, gibt es einen vom RKI angefertigten, farbverbindlichen Proof, der jeder
    Druckerei als Referenz zur Verfügung gestellt wird. Bereits bei Druckanfragen ist unbedingt darauf hinzuweisen, dass dieser Proof
    verbindlich ist und abweichende Druckergebnisse nicht abgenommen werde. Der farbverbindliche Proof ist bei der Pressestelle
    erhältlich.
    RKI Hausfarbe: Pantone C
    % Pantone C
    %
    %
    %
    %
    %
    %
    %
    %
    %
    %
    %
    %
    %
    %
    %
    %
    %
    %
    Vierfarb-Umrechnung ( c Euroskala)
    % Euroskala C M Y K
    %
    %
    %
    %
    %
    %
    %
    %
    %
    %
    %
    %
    %
    %
    %
    %
    %
    %
    RGB/Hex-Werte für Office/Internet-Anwendungen
    % R G B | Hex # ec
    %
    %
    %
    %
    %
    %
    %
    %
    %
    %
    %
    %
    %
    %
    %
    %
    %
    %

    View Slide

  8. Pantone 300 C : The RKI blue
    8
    Stand: . September zurück zum Inhaltsverzeichnis
    Hausfarbe
    Neue Hausfarbe des Robert Koch-Instituts ist Pantone C. Auf den Umschlägen wird ausschließlich RKI-Blau verwendet, ergänzt
    um schwarz als Kontrastfarbe für Bildmotive. Die genaue Auslobung für die Verwendung der Farben finden Sie auf Seite Seite .
    Beim Druck auf ungestrichene Papiere ist zu beachten, dass der Farbton der Referenz für gestrichene Papiere entspricht!
    Da Pantone-Farbfächer altern und Varianzen haben, gibt es einen vom RKI angefertigten, farbverbindlichen Proof, der jeder
    Druckerei als Referenz zur Verfügung gestellt wird. Bereits bei Druckanfragen ist unbedingt darauf hinzuweisen, dass dieser Proof
    verbindlich ist und abweichende Druckergebnisse nicht abgenommen werde. Der farbverbindliche Proof ist bei der Pressestelle
    erhältlich.
    RKI Hausfarbe: Pantone C
    % Pantone C
    %
    %
    %
    %
    %
    %
    %
    %
    %
    %
    %
    %
    %
    %
    %
    %
    %
    %
    Vierfarb-Umrechnung ( c Euroskala)
    % Euroskala C M Y K
    %
    %
    %
    %
    %
    %
    %
    %
    %
    %
    %
    %
    %
    %
    %
    %
    %
    %
    RGB/Hex-Werte für Office/Internet-Anwendungen
    % R G B | Hex # ec
    100 % 80 % 60 %

    View Slide

  9. Pantone 300 C (#005EB8) versus (#006EC7)
    9
    #006EC7
    #005EB8

    View Slide

  10. Pantone 300 C (#005EB8) versus (#006EC7)
    10

    View Slide

  11. ▪ Strategy 1. Using Color Harmonies to create Harmonious Color Schemes


    ▪ Strategy 2. Mapping Color Schemes according to Data Types
    How to Design Color Schemes?
    11

    View Slide

  12. Strategy 1. Color Harmonies for Harmonious Color Schemes
    12
    Hattab G, Rhyne TM, Heider D (2021) Correction: Ten simple rules to colorize biological data visualization. PLOS
    Computational Biology 17(4): e1008901. https://doi.org/10.1371/journal.pcbi.1008901

    View Slide

  13. ▪ Color harmony is the process of choosing
    colors on a color wheel that work well
    together in the composition of an image.


    ▪ Like concepts in music, these harmonies are
    based around color combinations on the
    color wheel that help to provide common
    guidelines for how color hues will work
    together.


    ▪ Isaac Newton is credited with creating the
    color wheel concept when he closed the
    linear color spectrum into a color circle.


    ▪ Over the centuries, artists and color scientists
    amplified it to include color harmonies.
    Harmony by Sir Isaac Newton (circa 1770s)
    13
    Adapted from Rhyne TM

    View Slide

  14. Monochromatic Sequential Palette in RKI Blue
    14
    Accessibility in Action

    View Slide

  15. Accessibility in Action
    15
    COLORS IN ACTION
    Background color: ⬤ #ffffff !
    Font color: ⬤ #000000 !
    Charts made with Semiotic
    Color Population:
    Sample font
    Stroke:
    word mot ظفل 字
    COLOR REPORT
    #71BAFE light blue ●
    #A8D3FA light blue ●
    #005EB8 blue ●
    #38A0FF blue ●
    #E5F3FE white
    ● Minimize name
    conflicts for
    categorical palettes
    Arcs link colors difficult
    to tell apart as:
    Lines or small points
    Medium areas
    Large areas
    Deuteranomaly - 2.7% Protanomaly - 0.66% Protanopia - 0.59% Deuteranopia - 0.56%
    Greyscale
    Randomize Data None
    No Color Deficiency - 96%
    Dark
    COLORS IN ACTION
    Background color: ⬤ #ffffff !
    Font color: ⬤ #000000 !
    Charts made with Semiotic
    Color Population:
    Sample font
    Stroke:
    word mot ظفل 字
    COLOR REPORT
    #87b5ff light blue ●
    #bcccfc light blue ●
    #0060ad blue ●
    #4a9dff blue ●
    #f6eeff white
    Original
    #71BAFE
    #A8D3FA
    #005EB8
    #38A0FF
    #E5F3FE
    ● Minimize name
    conflicts for
    categorical palettes
    Arcs link colors difficult
    to tell apart as:
    Lines or small points
    Medium areas
    Large areas
    No Color Deficiency - 96% Protanomaly - 0.66% Protanopia - 0.59% Deuteranopia - 0.56%
    Greyscale
    Randomize Data None
    Deuteranomaly - 2.7%
    Dark
    COLORS IN ACTION
    Background color: ⬤ #ffffff !
    Font color: ⬤ #000000 !
    Charts made with Semiotic
    Color Population:
    Sample font
    Stroke:
    word mot ظفل 字
    VIZ PALETTE
    VIZ PALETTE By: Elijah Meeks
    & Susie Lu
    PICK
    Use Chroma.js
    Use Colorgorical
    Use ColorBrewer
    #005EB8, #38A0FF, #71BAFE, #A8D3FA,
    #E5F3FE
    EDIT
    5 Colors
    #hex rgb
    hsl


    ☰ 1 ⬤ #005eb8 !
    ☰ 2 ⬤ #38a0ff !
    ☰ 3 ⬤ #71bafe !
    ☰ 4 ⬤ #a8d3fa !
    ☰ 5 ⬤ #e5f3fe !
    GET
    #hex rgb
    hsl
    String quotes
    Object with metadata
    ["#005eb8",
    "#38a0ff",
    "#71bafe",
    "#a8d3fa",
    "#e5f3fe"]
    Add Replace
    Add
    Deuteranomaly - 2.7% Protanomaly - 0.66% Protanopia - 0.59% Deuteranopia - 0.56%
    Greyscale
    Randomize Data None
    No Color Deficiency - 96%
    Dark

    View Slide

  16. RKI Blue and its Complement
    16
    #B87200
    #005EB8
    RKI Blue Complement

    View Slide

  17. Complementary Color of the RKI blue
    17
    Accessibility in Action

    View Slide

  18. Diverging Sequential Palette
    18
    18
    RKI Blue Complement

    View Slide

  19. Example Charts
    19
    0
    25
    50
    75
    100
    April May June July
    0
    50
    100
    150
    200
    April May June July
    0
    25
    50
    75
    100
    April May June July
    0
    50
    100
    150
    200
    April May June July
    RKI Blue
    Complement

    View Slide

  20. Four-Colors Categorical Palette from a Triadic Harmony
    20
    RKI Blue
    #93C4F6 #005EB8 #D9DE84 #636B05
    Accessibility in Action

    View Slide

  21. 0
    75
    150
    225
    300
    April May June July
    Example Charts
    21
    11 %
    13 %
    18 %
    58 %
    12 %
    13 %
    34 %
    41 %
    RKI


    Blue
    RKI Blue
    Green

    View Slide

  22. Four-Colors Categorical Palette from the Complement
    22
    RKI Blue
    #93C4F6 #005EB8 #FFD797 #B87200
    Accessibility in Action

    View Slide

  23. Example Charts
    23
    11 %
    13 %
    18 %
    58 %
    12 %
    13 %
    34 %
    41 %
    RKI Blue
    0
    75
    150
    225
    300
    April May June July
    Complement

    View Slide

  24. Strategy 2. Mapping Data Types to Color Schemes
    24
    Cynthia Brewer

    View Slide

  25. Example Binary Schemes
    25
    #E6E6E6
    #A7A6A7
    #005EB8 #81B5E6
    T F
    Two example Schemes are presented.


    They may be also combined to create a qualitative scheme with 4 categories.

    Notice that it is likely that people may better see the more saturated colors: The Dark Gray and the Base Blue RKI.


    Care is necessary for light Gray on White background. All F values are set to 90% Brightness.
    RKI Blue
    Accessibility in Action

    View Slide

  26. Example Qualitative and Qualitative Binary Schemes
    26
    #C2C19B
    #636B05 #005EB8
    #D8DCF1
    #C10170
    #EEABC3
    RKI Blue
    Accessibility in Action

    View Slide

  27. Example Qualitative Sequential and Qualitative Schemes
    27
    Examples of 5-step sequential Color Schemes

    With both Lightness Correction and Bezier Interpolation
    #c10170,#d2528b,#e180a7,#eeabc3,#f8d5e1,#ffffff
    #005eb8,#587bc7,#869ad5,#b0bbe3,#d8dcf1,#ffffff
    #636b05,#83873e,#a3a36c,#c2c19b,#e0e0cc,#ffffff
    https://gka.github.io/palettes/#/6|s|005eb8,ffffff|636b05|1|1


    https://gka.github.io/palettes/#/6|s|c10170,ffffff|636b05|1|1


    https://gka.github.io/palettes/#/6|s|636b05,ffffff|636b05|1|1
    RKI Blue
    Accessibility in Action
    Accessibility in Action
    Accessibility in Action

    View Slide

  28. Example Qualitative Sequential Schemes
    28
    RKI Blue

    View Slide

  29. Example Diverging and Binary Diverging Color Schemes (4 step)
    29
    https://gka.github.io/palettes/#/9|d|c10170,ffffff|636b05|1|1
    4-step is colorblind safe

    but 5-step not
    #c10170,#d65e92,#e896b5,#f5cbd9,#ffffff,#c1c563,#8b9131,#596012,#2c3300

    View Slide

  30. Example Diverging and Binary Diverging Color Schemes (5 step)
    30
    Black middle point
    https://gka.github.io/palettes/#/11|d|c10170,000000|000000,636b05|1|1
    #c10170,#981359,#701743,#4b162e,#29111a,#000000,#1a1908,#2b2c0d,#3d400e,#4f550b,#636b05

    View Slide

  31. Example Diverging and Binary Diverging Color Schemes (11 step)
    31
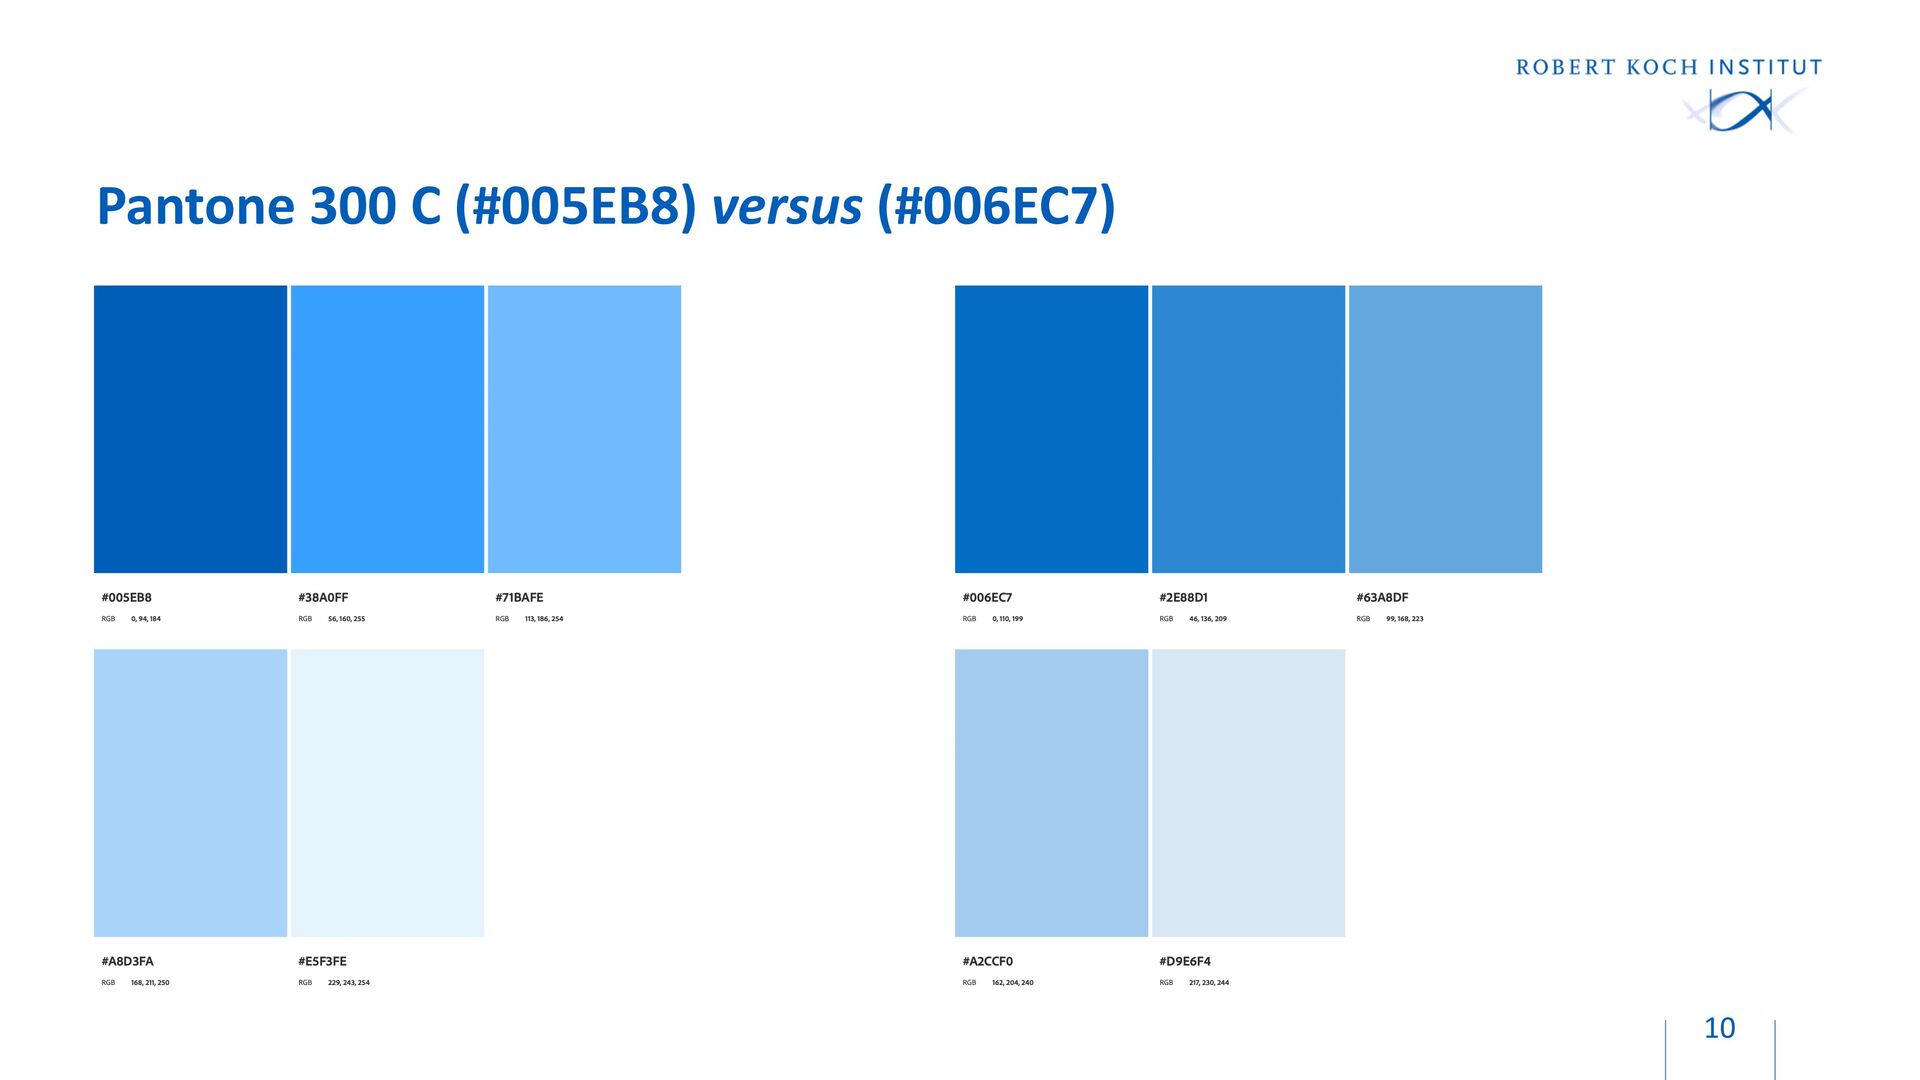
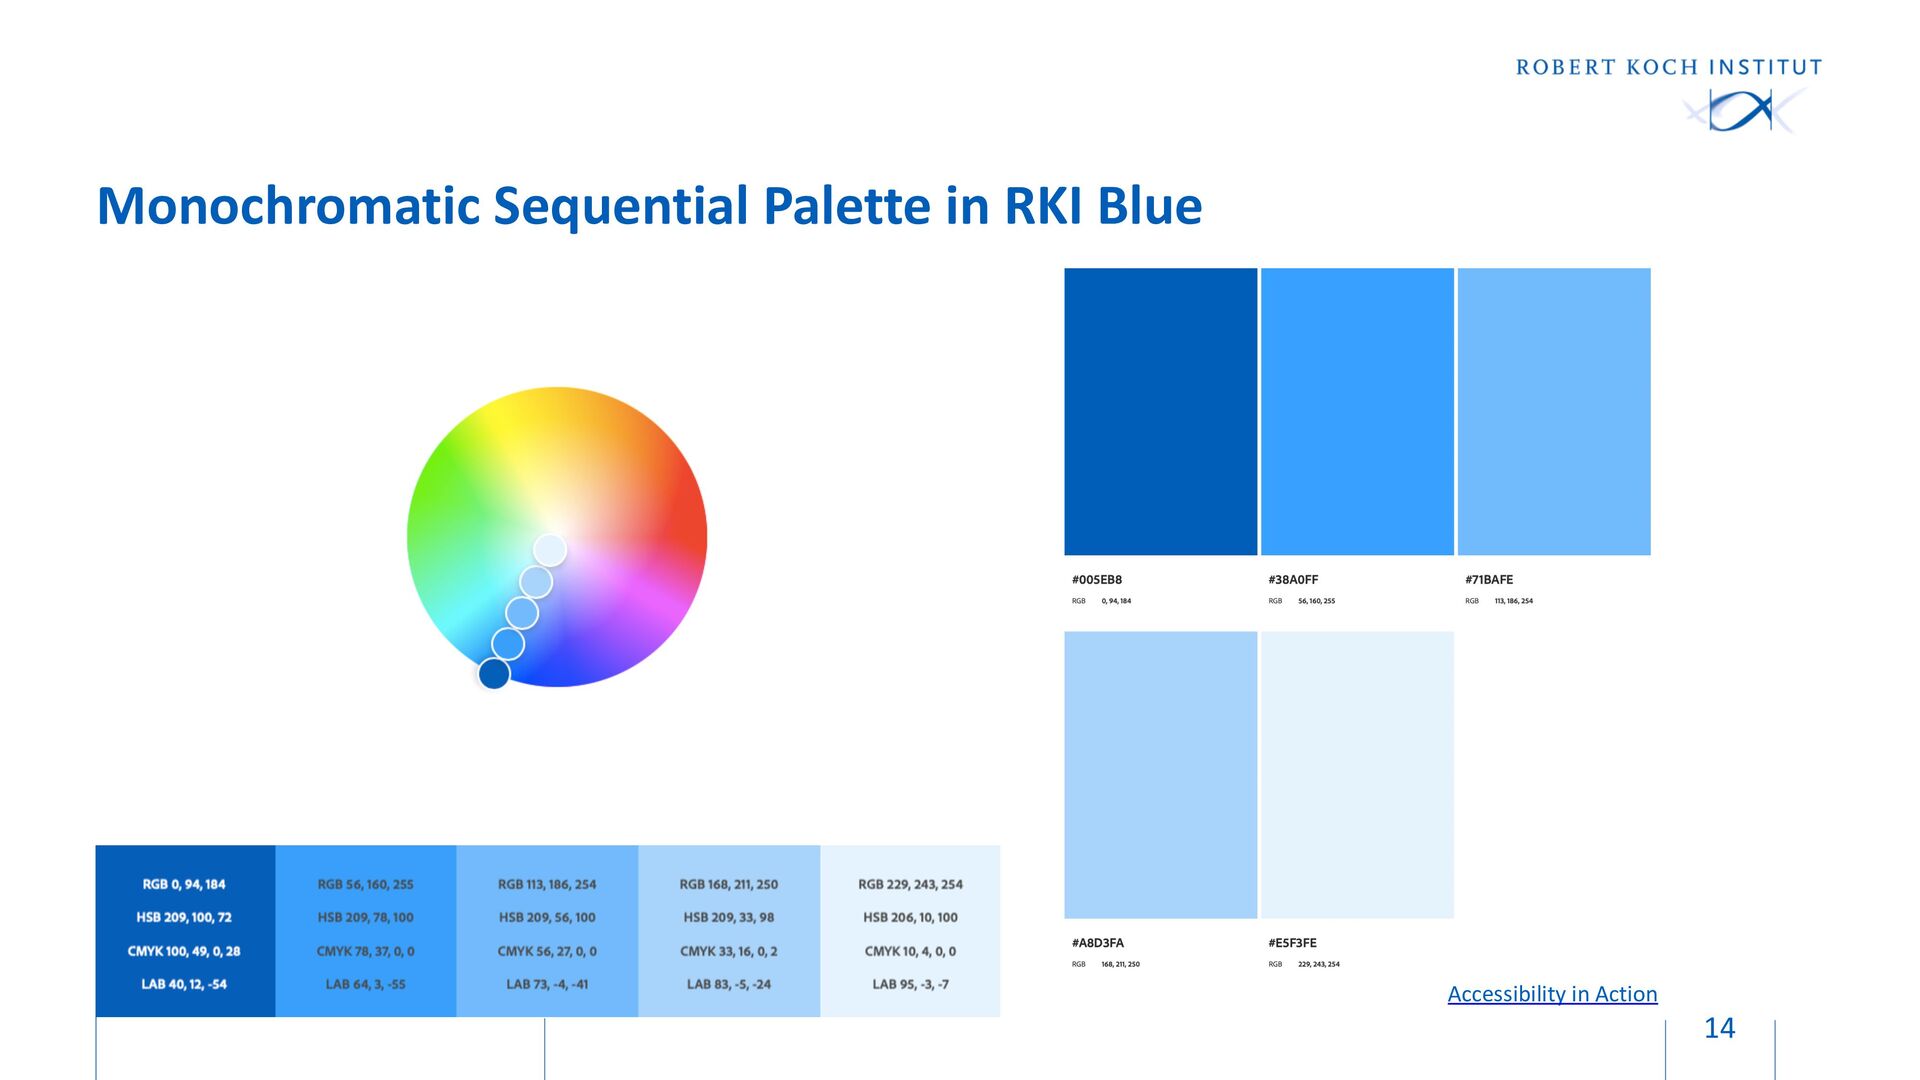
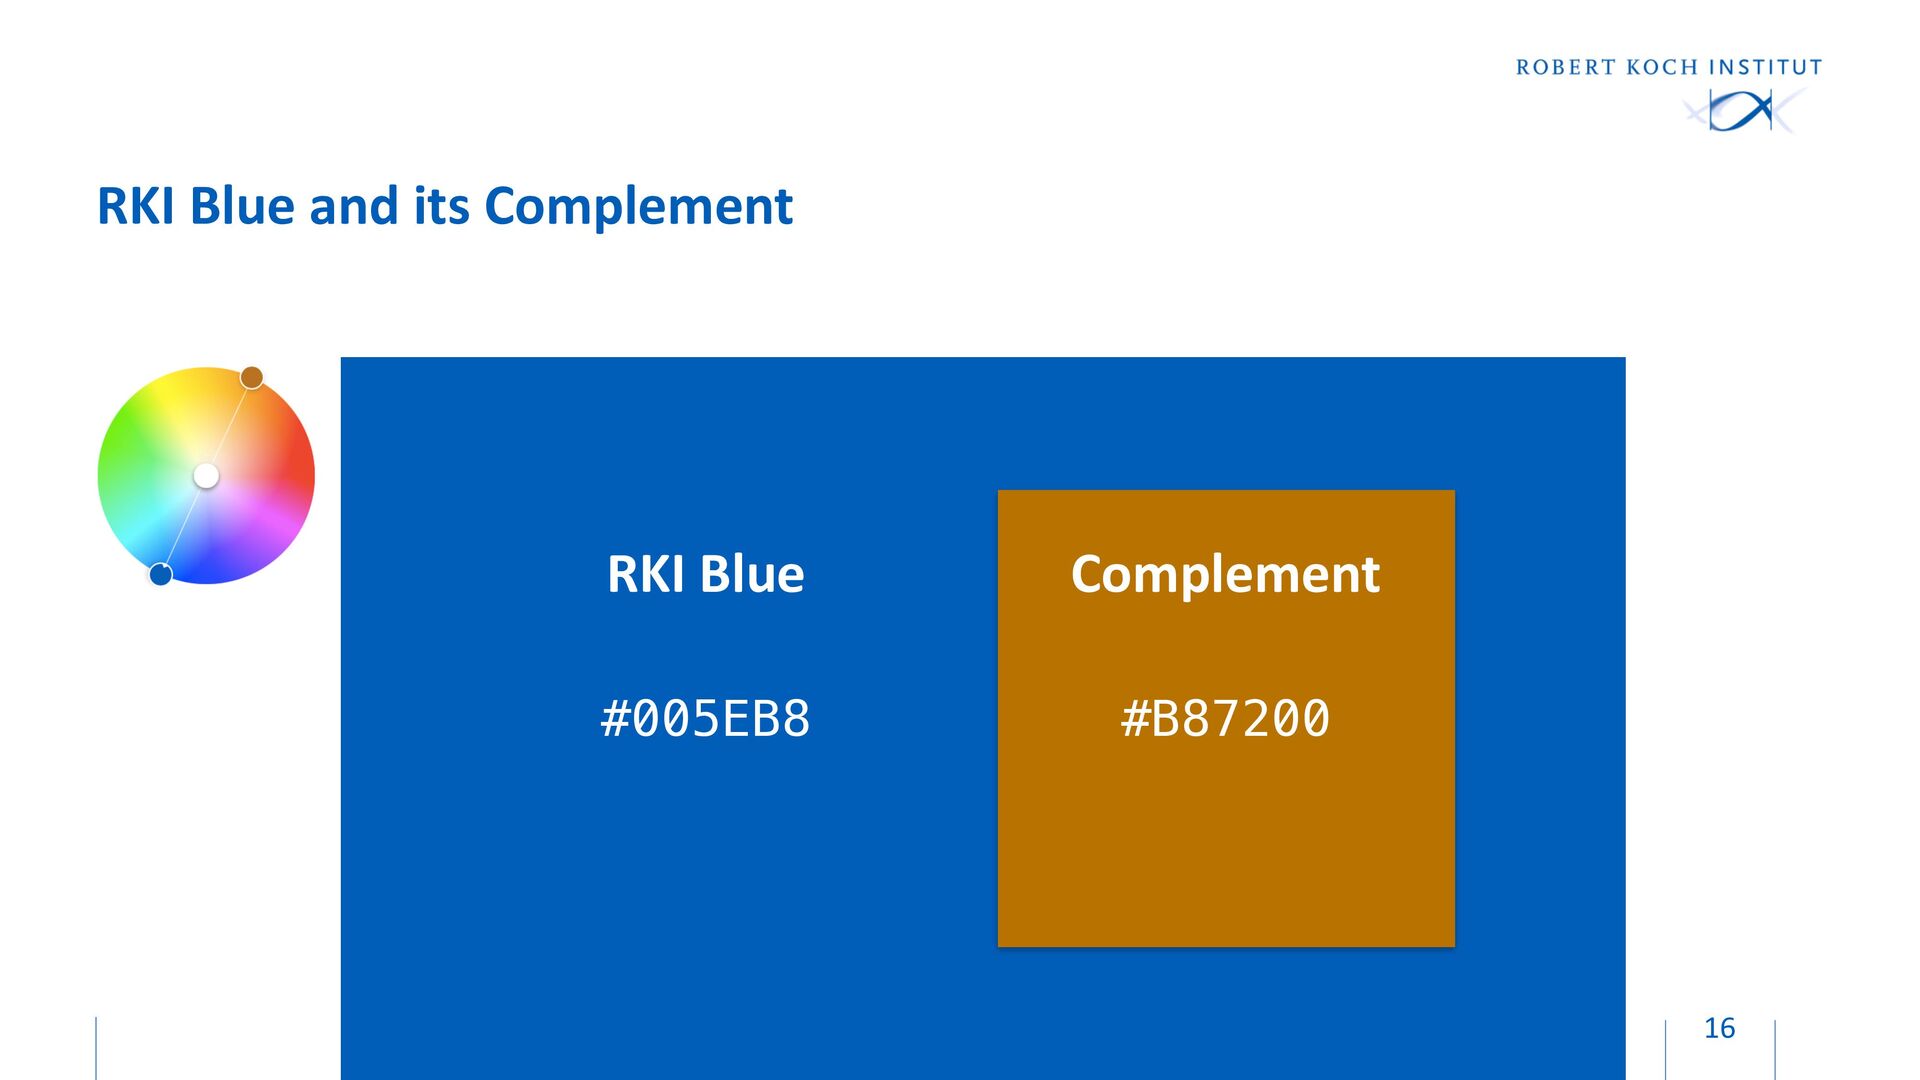
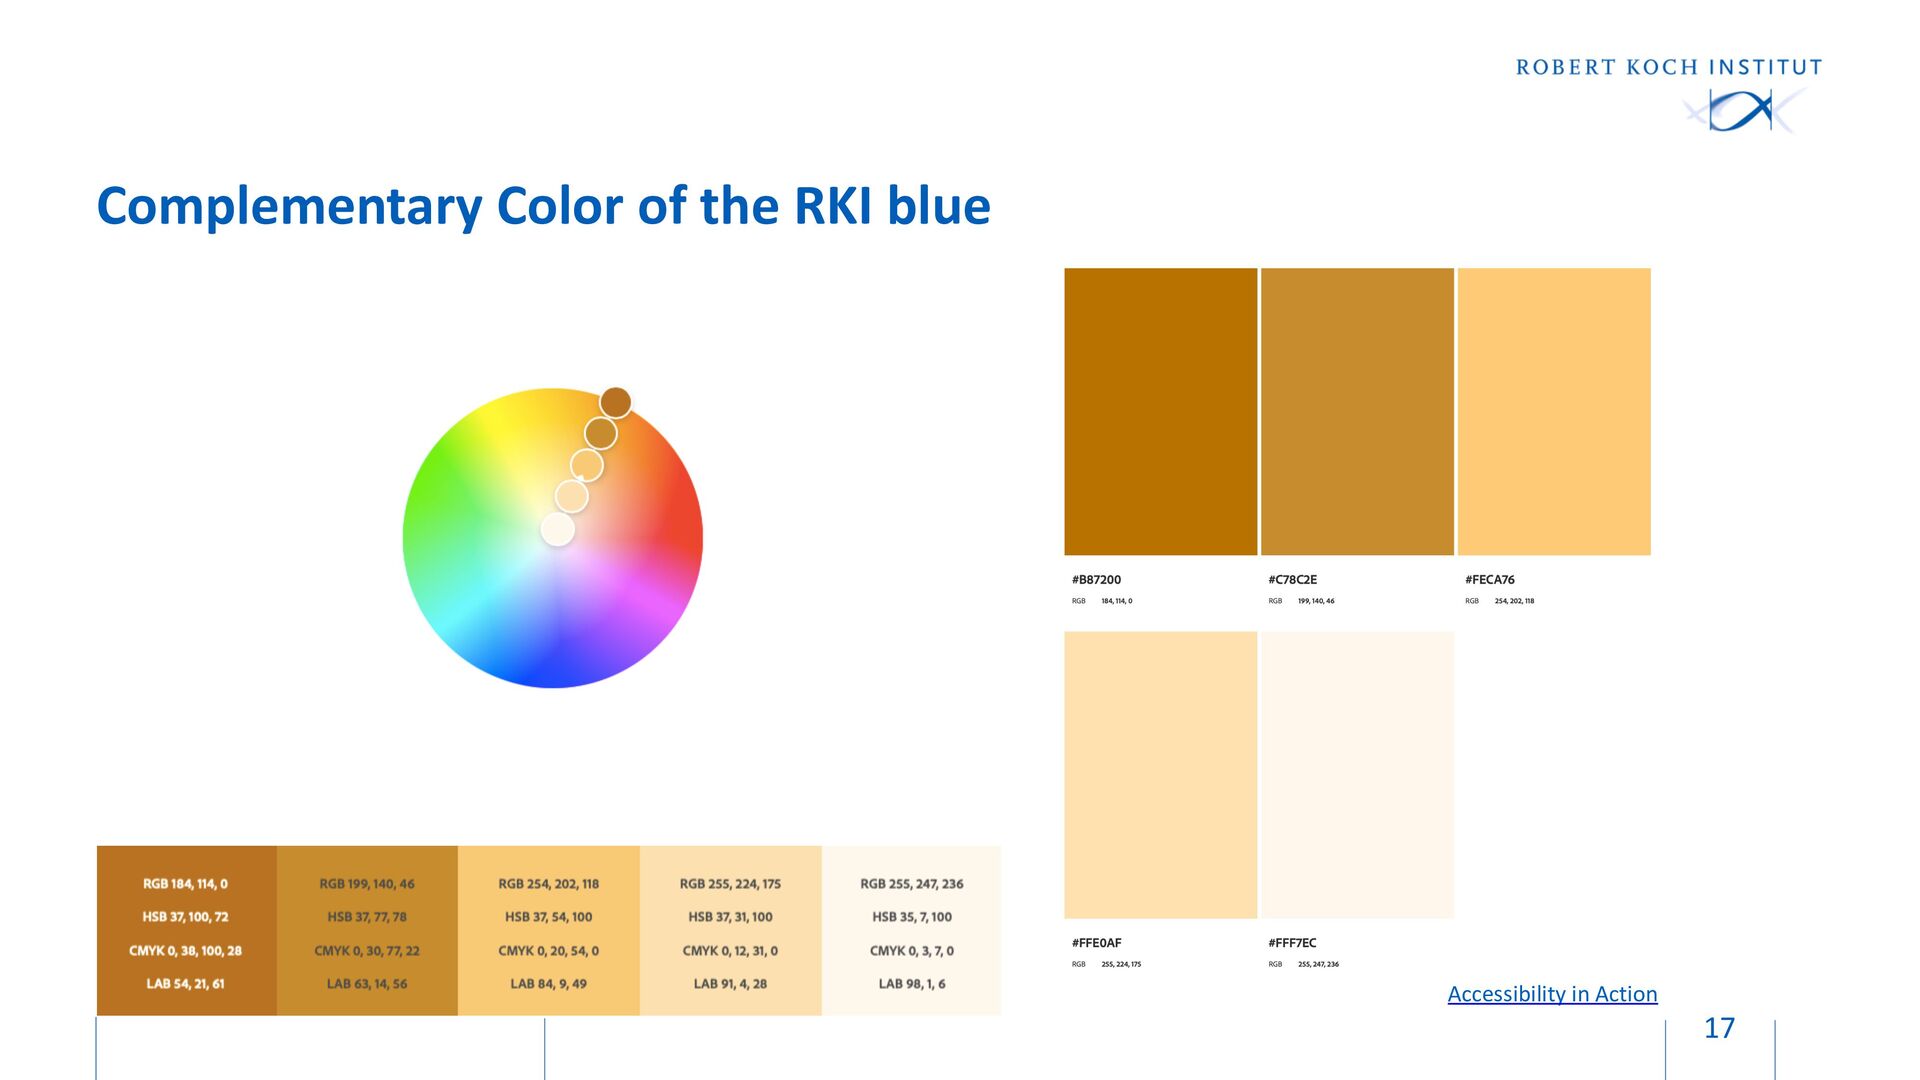
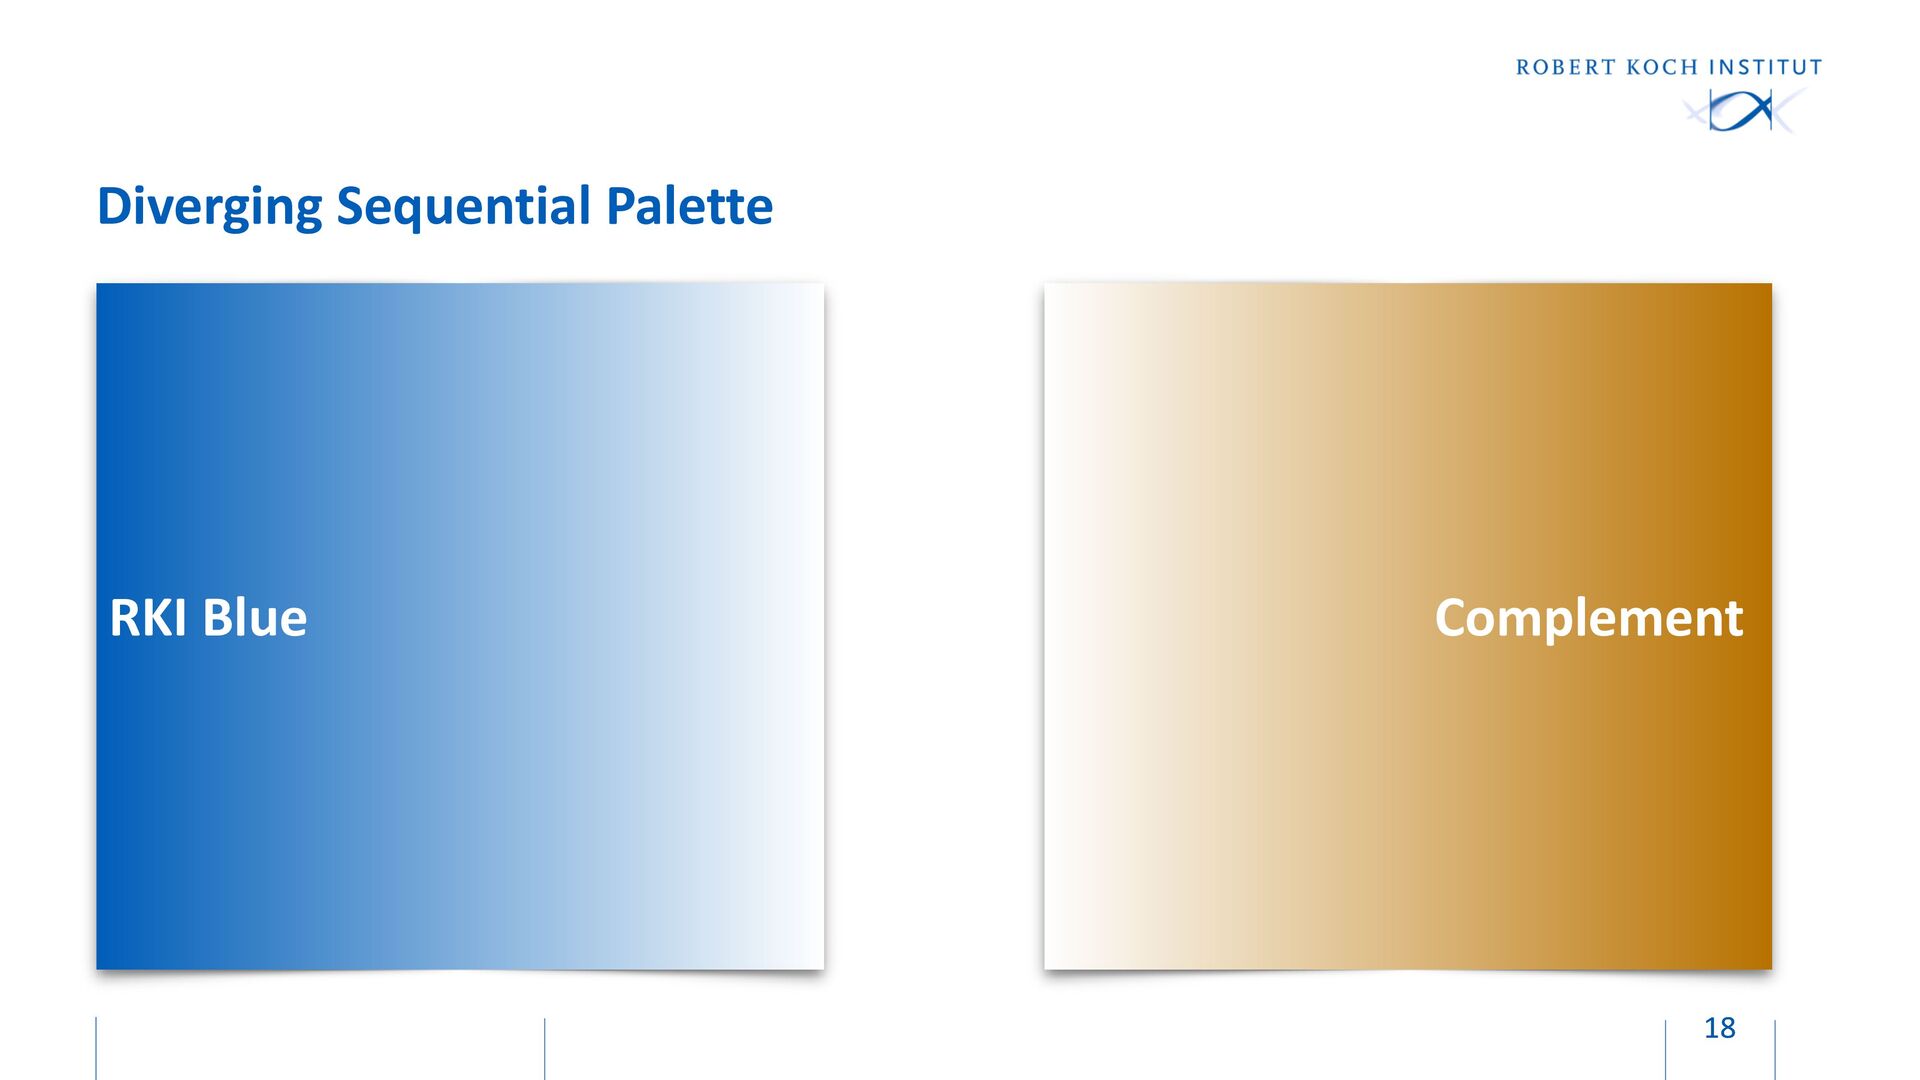
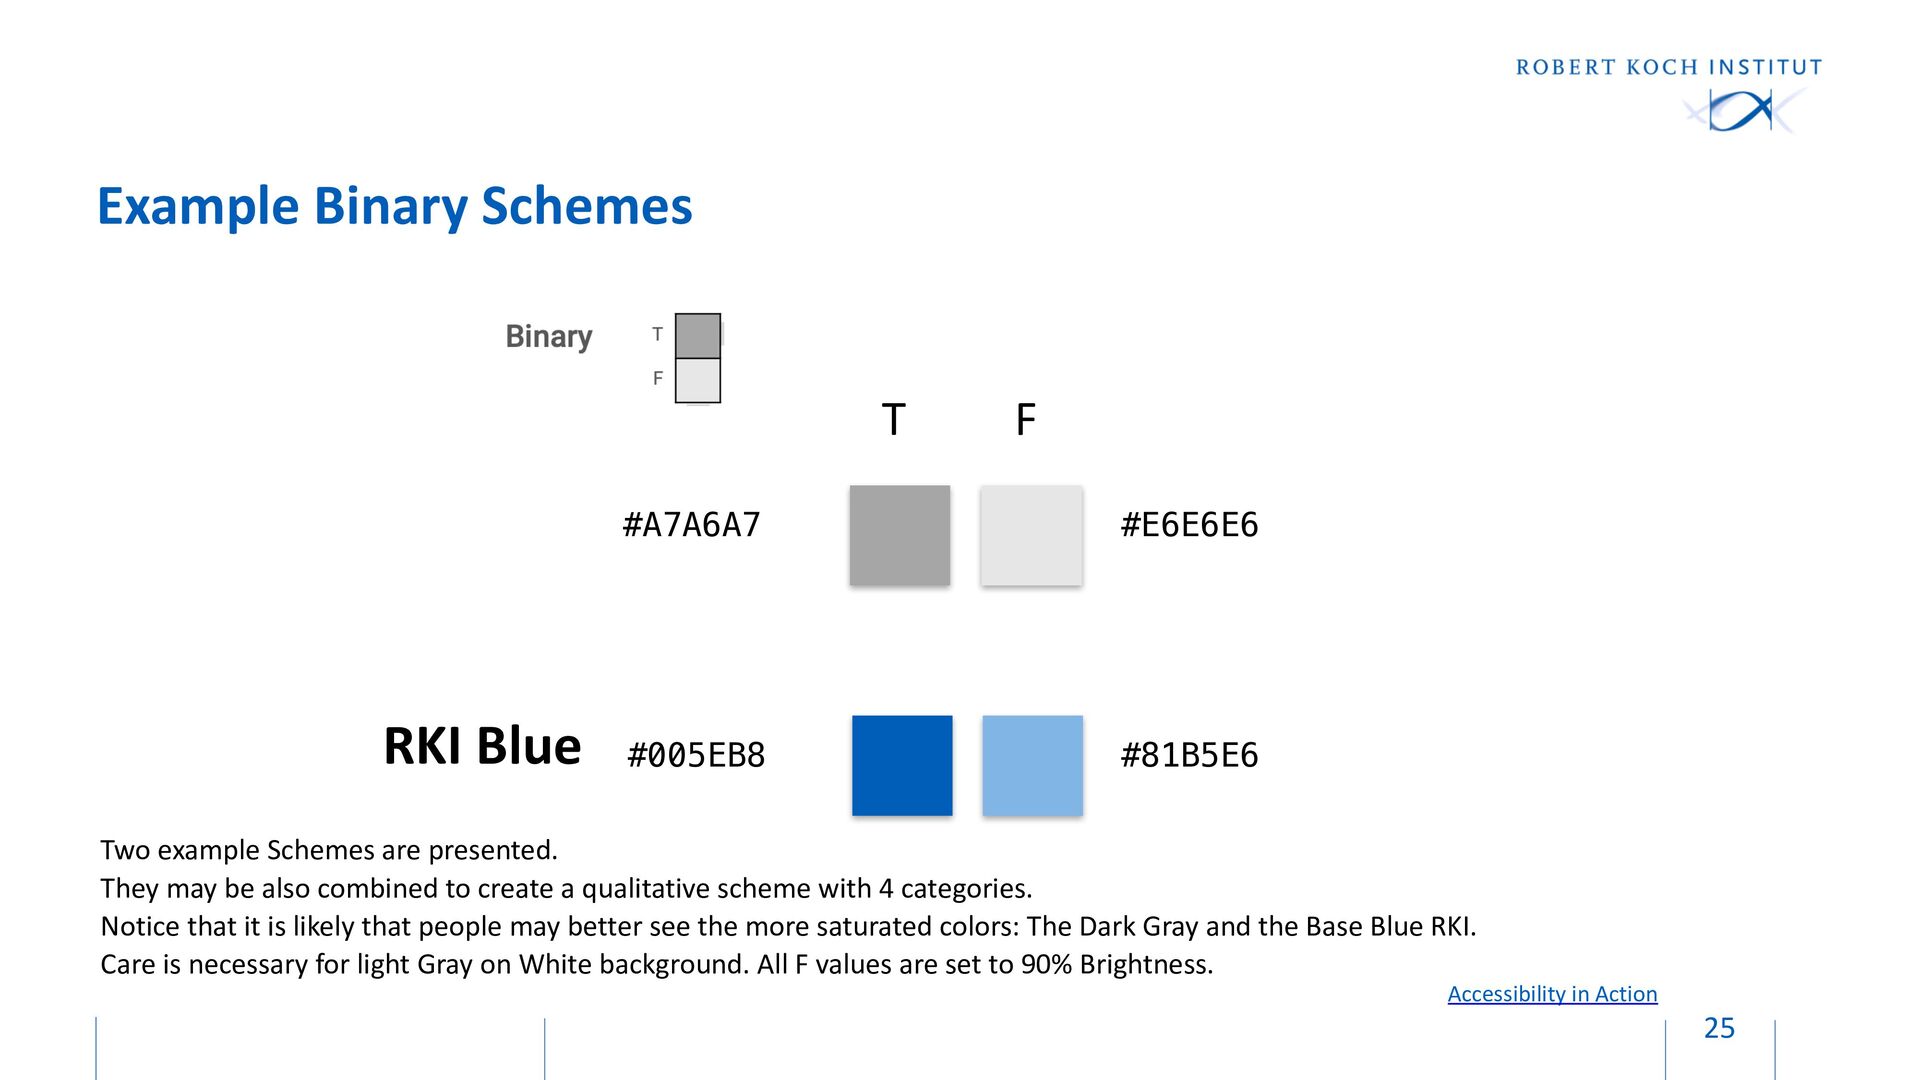
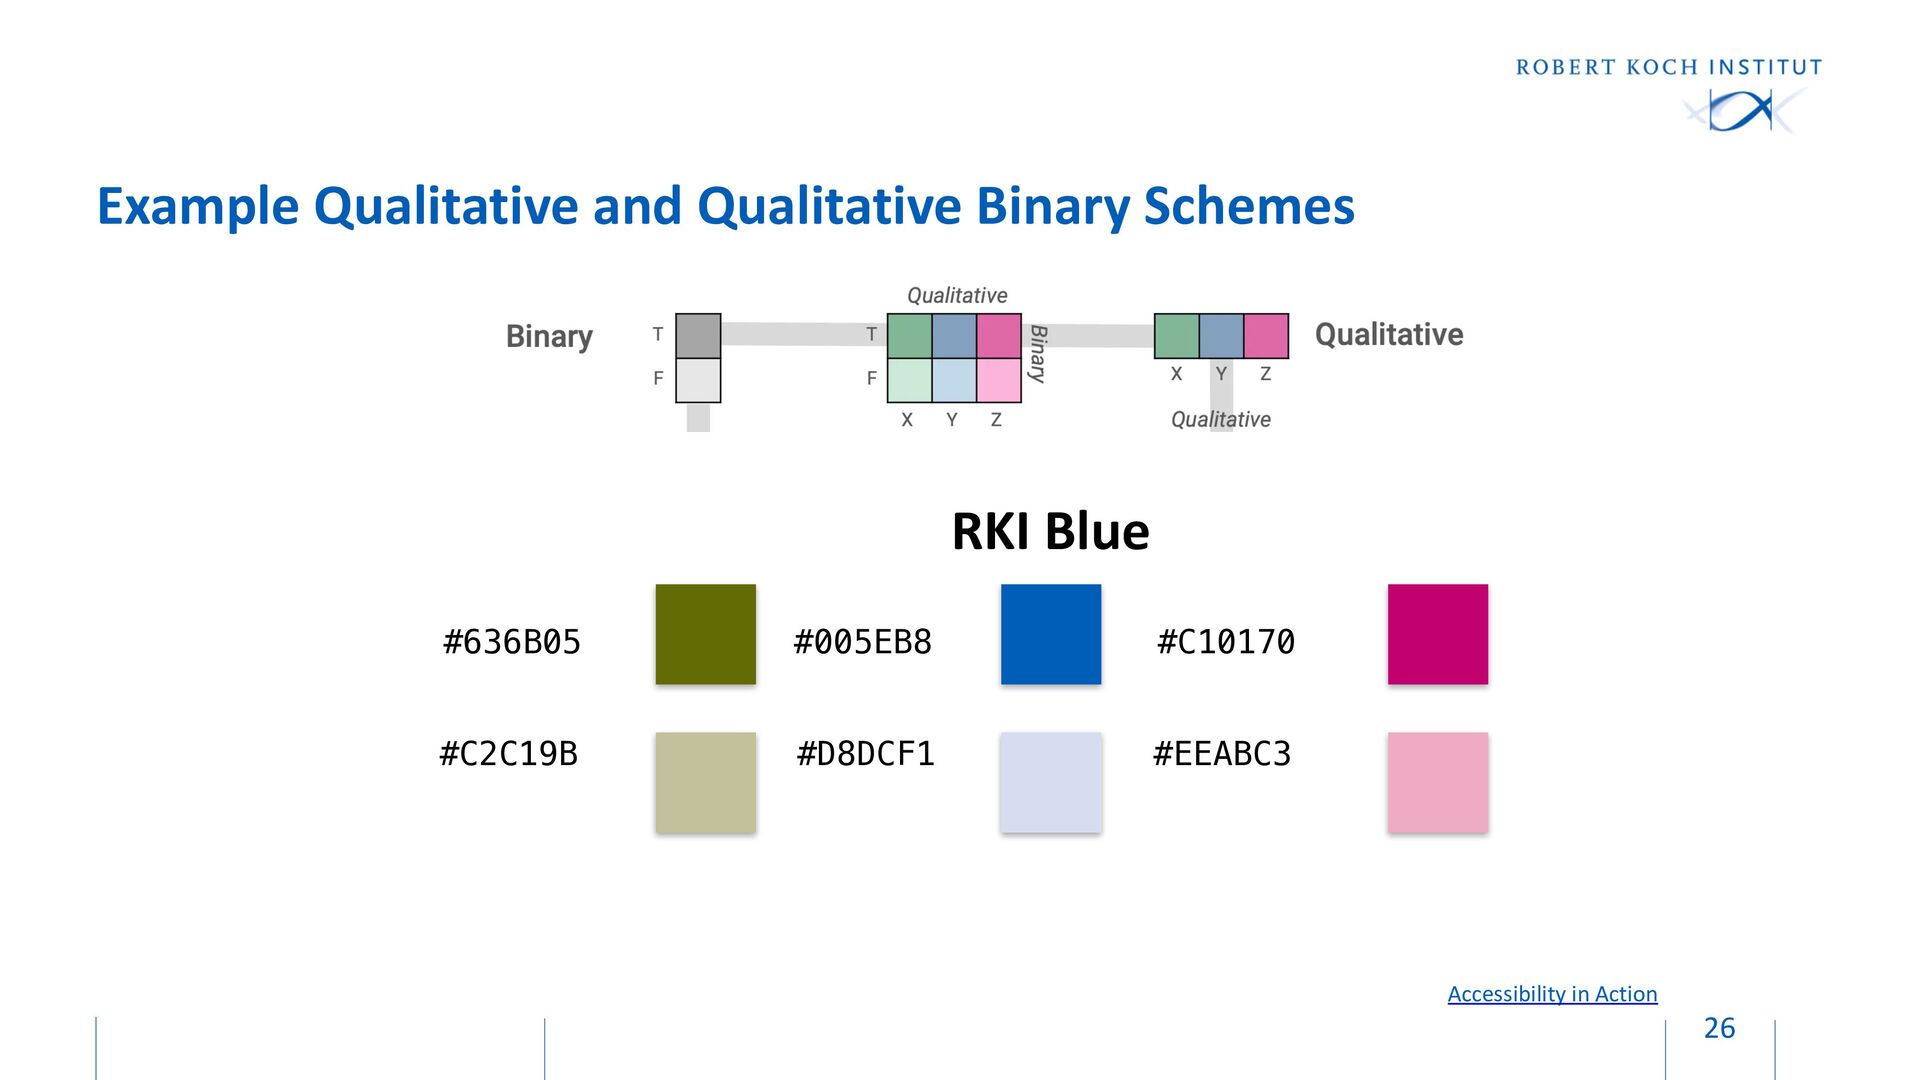
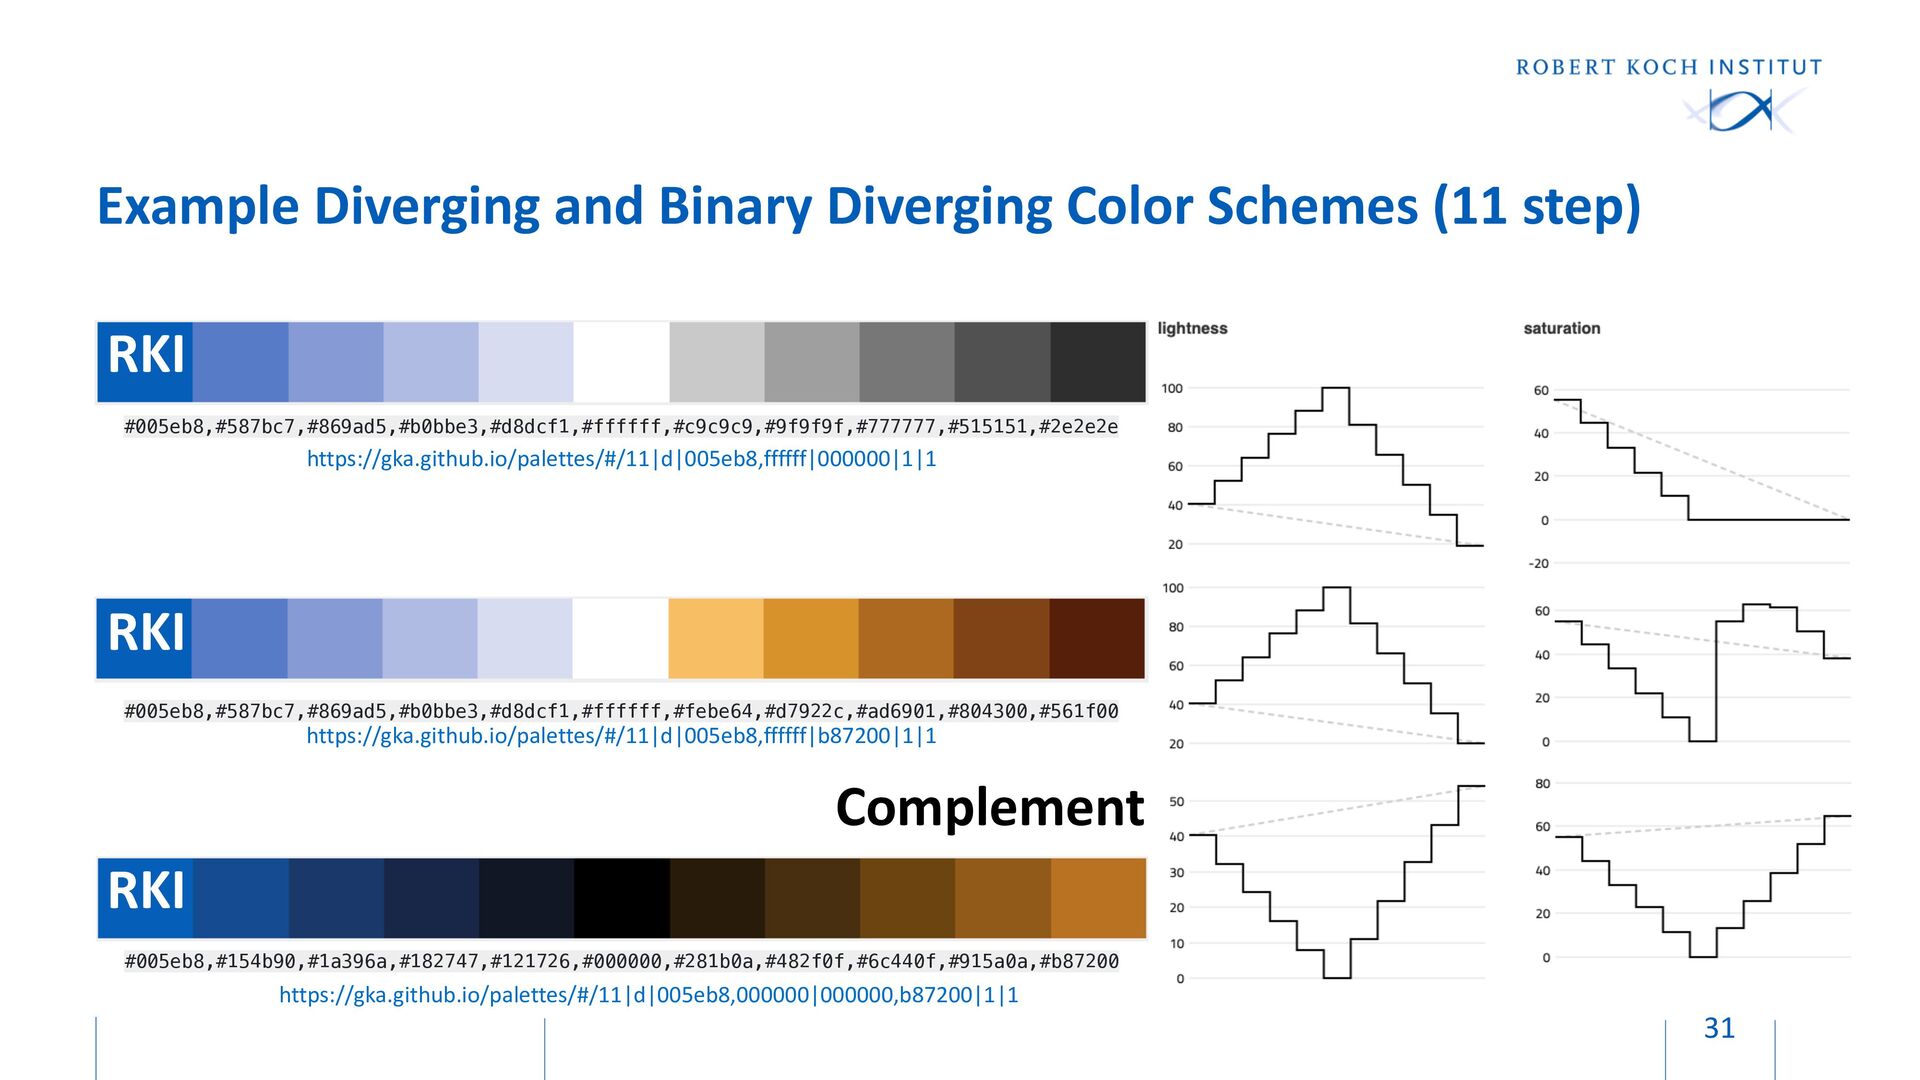
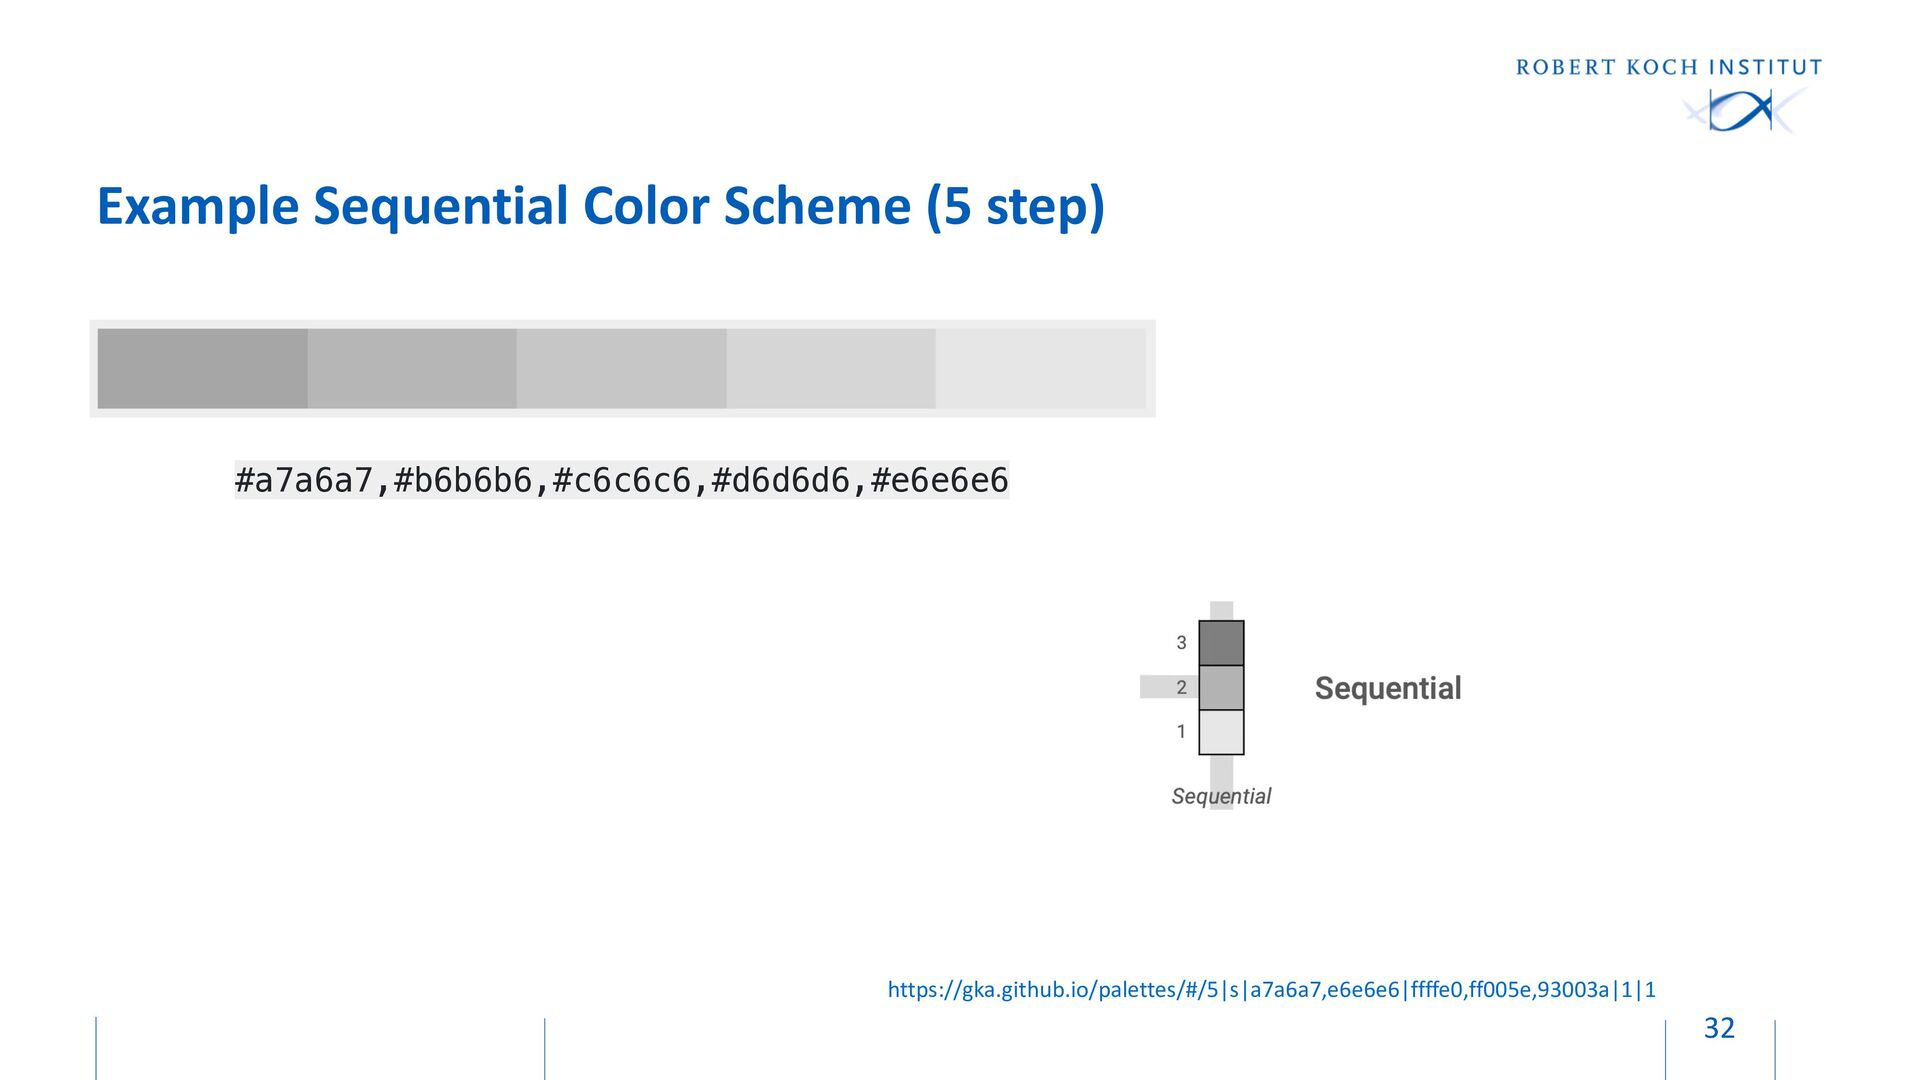
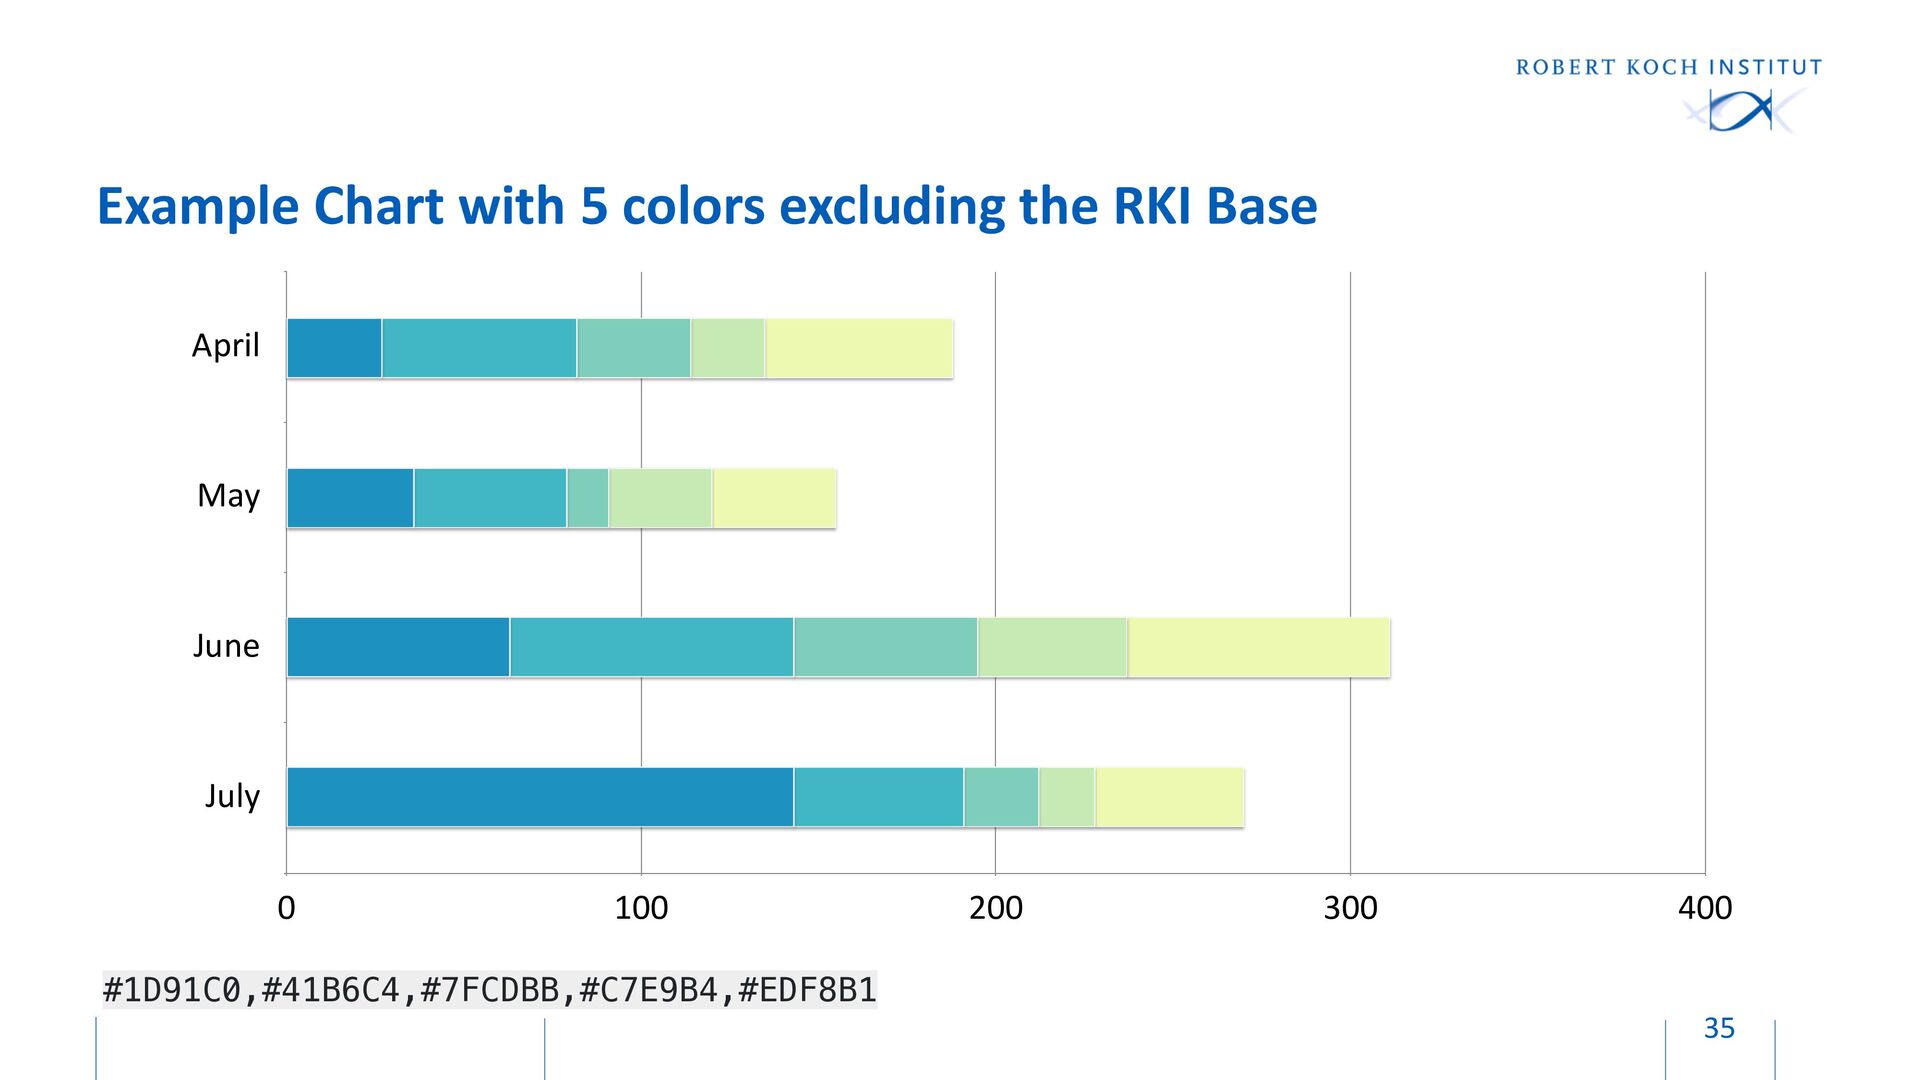
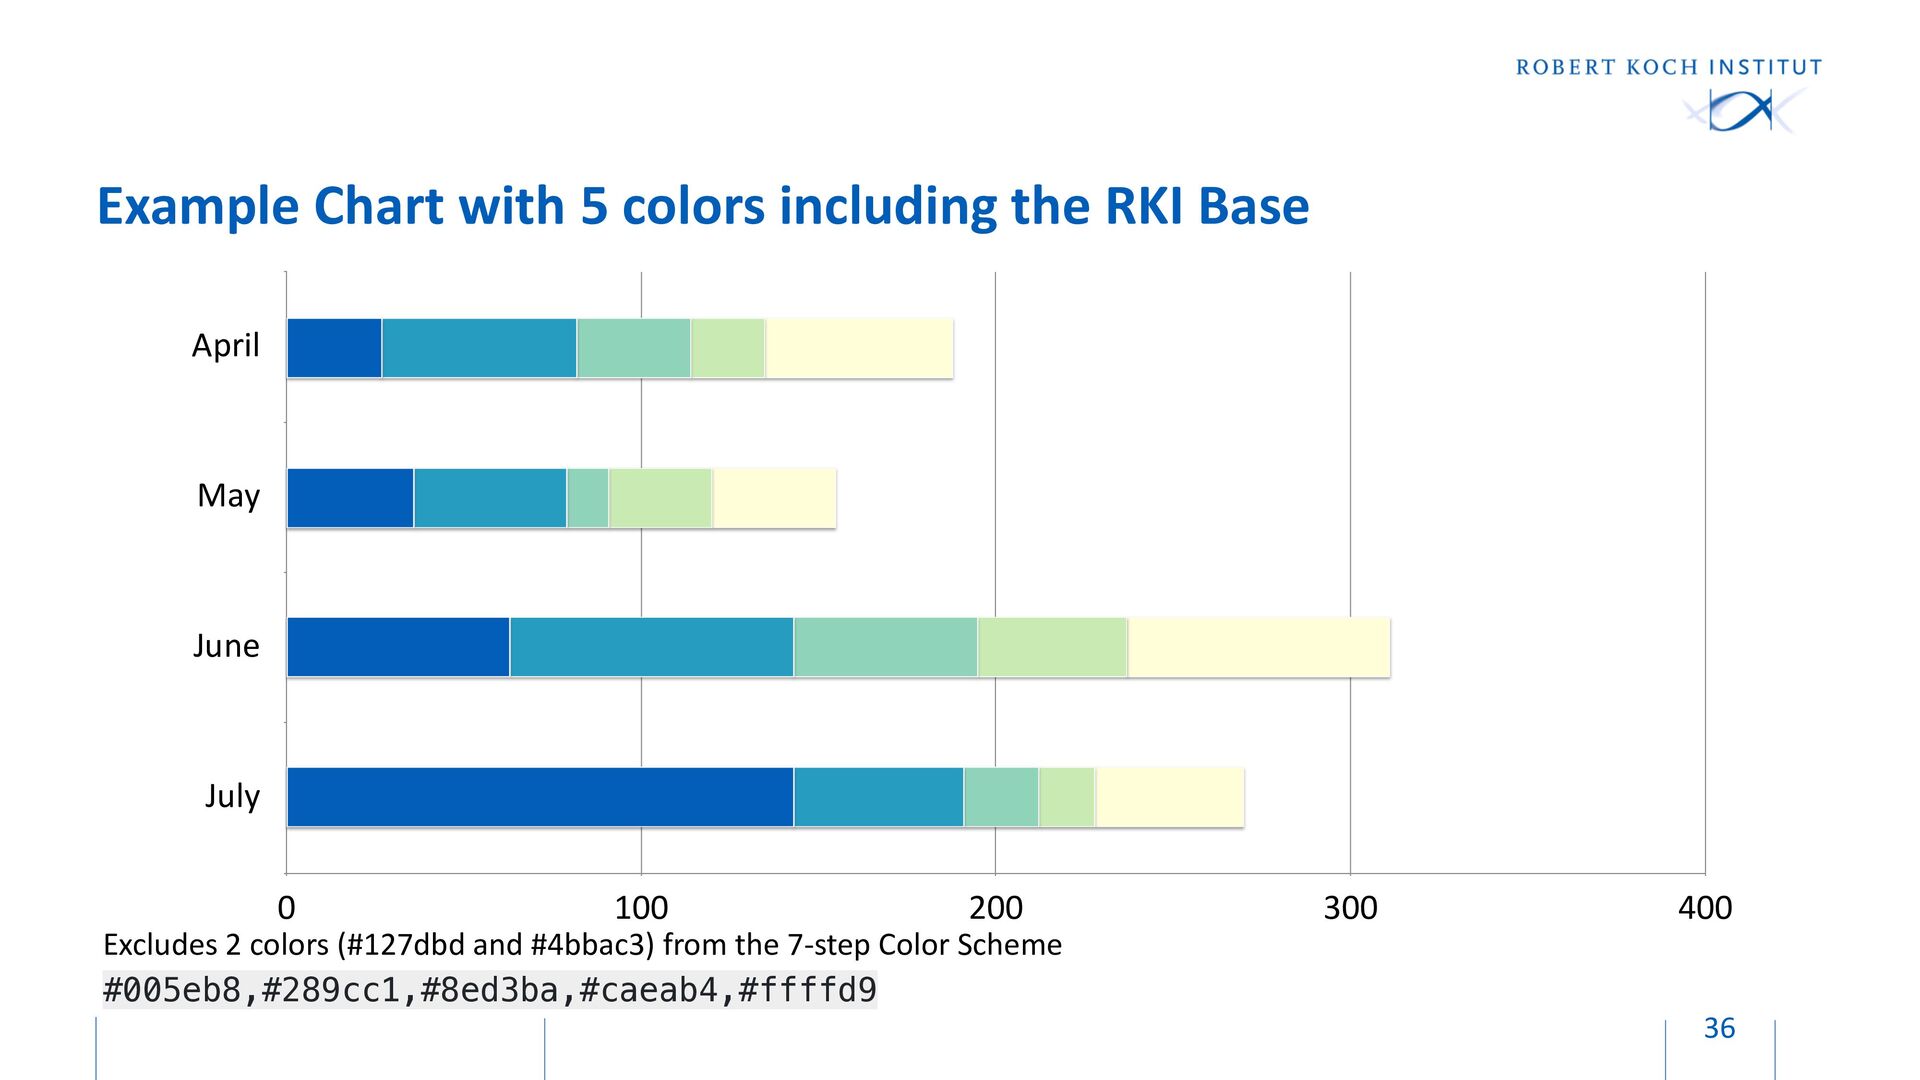
    https://gka.github.io/palettes/#/11|d|005eb8,ffffff|000000|1|1
    https://gka.github.io/palettes/#/11|d|005eb8,ffffff|b87200|1|1
    https://gka.github.io/palettes/#/11|d|005eb8,000000|000000,b87200|1|1
    RKI
    Complement
    RKI
    RKI
    #005eb8,#587bc7,#869ad5,#b0bbe3,#d8dcf1,#ffffff,#c9c9c9,#9f9f9f,#777777,#515151,#2e2e2e
    #005eb8,#587bc7,#869ad5,#b0bbe3,#d8dcf1,#ffffff,#febe64,#d7922c,#ad6901,#804300,#561f00
    #005eb8,#154b90,#1a396a,#182747,#121726,#000000,#281b0a,#482f0f,#6c440f,#915a0a,#b87200

    View Slide

  32. Example Sequential Color Scheme (5 step)
    32
    #a7a6a7,#b6b6b6,#c6c6c6,#d6d6d6,#e6e6e6
    https://gka.github.io/palettes/#/5|s|a7a6a7,e6e6e6|ffffe0,ff005e,93003a|1|1

    View Slide

  33. More Complex Color Schemes possible for Advanced Color Usage
    33
    Cynthia Brewer

    View Slide

  34. ▪ A Multi-Hue Sequential Color Scheme
    for Changes in Hue for:

    - Continuous Data

    - Categorical Data (when discretized
    maximum use 5 or 6)


    ▪ Inspired by the Viridis Color Map: It is
    perceptually uniform and with
    monotonically increasing luminance in
    multiple hues


    ▪ Two Color Schemes result

    - 5 Step Top-Right

    - 7 Step Bottom-Right
    A Color Scheme is Missing!
    34
    #005EB8,#127DBD,#289CC1,#4BBAC3,#8ED3BA,#CAEAB4,#FFFFD9
    https://gka.github.io/palettes/#/7|s|005eb8,127dbd,289cc1,4bbac3,8ed3ba,caeab4,ffffd9
    #1D91C0,#41B6C4,#7FCDBB,#C7E9B4,#EDF8B1

    View Slide

  35. Example Chart with 5 colors excluding the RKI Base
    35
    April
    May
    June
    July
    0 100 200 300 400
    #1D91C0,#41B6C4,#7FCDBB,#C7E9B4,#EDF8B1

    View Slide

  36. Example Chart with 5 colors including the RKI Base
    36
    April
    May
    June
    July
    0 100 200 300 400
    Excludes 2 colors (#127dbd and #4bbac3) from the 7-step Color Scheme
    #005eb8,#289cc1,#8ed3ba,#caeab4,#ffffd9

    View Slide

  37. 1. Identify the Nature of your data


    2. Select Color Space


    3. Create a Color Scheme based on the Color Space


    4. Apply the Color Scheme to the Data


    5. Check for Color Context in the Data Visualization


    6. Evaluate Interaction of Colors


    7. Be Aware of Color Conventions and Definitions in your Discipline


    8. Assess Color Deficiencies


    9. Consider Web Content Accessibility and Print Realities


    10.Get it Right in Black & White
    Ten Simple Rules to Colorize Your Data Visualizations
    37
    Hattab G, Rhyne TM, Heider D (2021) Correction: Ten simple rules to colorize biological data visualization. PLOS
    Computational Biology 17(4): e1008901. https://doi.org/10.1371/journal.pcbi.1008901

    View Slide

  38. 1. Establish data classes and key colors for
    visualization.


    2. Select color rule, color harmony per
    criteria of your data.


    3. Build color scheme. A color suggestion
    tool might be helpful.


    4. Check and revise due to color deficiency,
    contrasts, or any pre-existing conditions.


    5. Apply color scheme to data visualization.
    Some modifications might result.
    The Simplified Process of Colorizing a Data Visualization
    38
    5
    4
    3
    2
    1
    Adapted from Rhyne TM
    RKI Base

    Sequential

    View Slide

  39. ▪ Adopt 5 colors from a proposed
    Color Scheme (c.f., Slide 34)


    ▪ Paste the HEX codes to create toy
    example for Normal Vision users


    ▪ Simulate Deuteranomaly


    ▪ The 5 colors of the Color Scheme
    are distinguishable and pass the
    test
    Color Blindness Simulation with VizPalette
    39
    Accessibility in Action

    View Slide

  40. ▪ All proposed Color Palettes are
    accessible and colorblind friendly


    ▪ Consider your Audience and the
    Device Screen


    ▪ Check for Web Accessibility


    ▪ Simulate Colorblindness


    ▪ Whatever you do, do no harm!


    ▪ Are there domain color
    conventions?


    ▪ Is Color really needed?
    Good Practices for better Accessibility and Inclusivity
    40
    Multi-Hue

    Sequential
    5
    4
    3
    2
    1

    View Slide

  41. Examples of Integrated Charts
    41
    Horizontal Stacked Bar Chart
    3
    April
    May
    June
    July
    0 100 200 300 400
    Heatmap
    5
    0-10 11-20 21-30 31-50+
    Monday Tuesday Wednesday Thursday Friday Saturday Sunday
    A
    B
    C
    D
    Small Multiple Idiom
    13
    Progress Infographic
    16
    High
    Slow Progress is Progress.
    Low
    Speed isn't everything. 65%

    View Slide

  42. ▪ Brexit


    ▪ COVID-19


    ▪ Epidemics


    ▪ Happiness


    ▪ Intersection


    ▪ Oscars


    ▪ Recombination


    ▪ RNAseq
    Eight Use Cases in the R language
    42
    3
    4
    5
    6
    7
    8
    1 10 100
    GDP per person, $'000, at purchasing−power parity, log scale
    Happiness, 0−10 scale
    Happiness and GDP per person:
    same direction opposite directions
    Population, m
    5−25 25−100 100−5000 500+
    85 countries with adult population over 5m
    GDP per person v self−reported happiness
    7674
    2809
    1458
    1246 1187 1151
    827 769 759 685
    547
    467 402 387 368
    258 206 206 190 155 149 113 105 80 71 64 62 54 49 49 42 40 36 35 32 29 28 28 25 24
    0
    2000
    4000
    6000
    8000
    Intersection Size
    O.sativa
    S.bicolor
    B.distachyon
    M.acuminata
    A.thaliana
    P.dactylifera
    0
    5000
    10000
    15000
    Set Size
    UpSet chart showing the distribution of shared gene families (sequence clusters)
    VH1
    VH3
    VH4
    VH5
    VH6
    JH1 JH2
    JH3
    JH4
    JH5
    JH6
    0
    800
    1600
    0
    800
    1600
    2400
    3200
    4000
    4800
    5600
    6400
    0
    800
    1600
    2400
    3200
    0
    0
    0
    0
    0
    800
    0
    800
    1600
    2400
    3200
    4000
    4800
    5600
    6400
    7200
    8000
    0
    800
    0
    800
    LogFC: DANG_REGULATED_BY_MYC_UP
    Statistic
    Down
    Up
    −6.07
    −0.72
    −0.45
    −0.28
    −0.14
    −0.02
    0.13
    0.30
    0.52
    0.92
    6.75
    0 2.1
    Enrichment
    T−statistic: DANG_REGULATED_BY_MYC_UP
    Statistic
    Down
    Up
    −11.50
    −2.04
    −1.24
    −0.74
    −0.35
    −0.04
    0.30
    0.68
    1.22
    2.20
    10.70
    0 3.3
    Enrichment
    20
    40
    60
    80
    100
    20
    40
    60
    80
    100
    20
    40
    60
    80
    100
    pred_deal
    pred_no_deal
    pred_remain
    pred_choice deal no_deal remain alpha 0.01
    Hypothetical Brexit Choices based on the Modelled Population
    1925
    1950
    1975
    2000
    0.00 0.25 0.50 0.75 1.00
    annual_share
    oscars_year
    result
    N
    W

    View Slide

  43. Happiness: GDP per person vs. self−reported happiness
    43
    3
    4
    5
    6
    7
    8
    1 10 100
    GDP per person, $'000, at purchasing−power parity, log scale
    Happiness, 0−10 scale
    Happiness and GDP per person:
    same direction opposite directions
    Population, m
    5−25 25−100 100−5000 500+
    85 countries with adult population over 5m
    GDP per person v self−reported happiness
    https://www.economist.com/graphic-detail/2019/03/21/
    economic-growth-does-not-guarantee-rising-happiness

    View Slide

  44. Intersection: Use Case where Color is not needed!
    44
    7674
    2809
    1458
    1246 1187 1151
    827 769 759 685
    547
    467 402 387 368
    258 206 206 190 155 149 113 105 80 71 64 62 54 49 49 42 40 36 35 32 29 28 28 25 24
    0
    2000
    4000
    6000
    8000
    Intersection Size
    O.sativa
    S.bicolor
    B.distachyon
    M.acuminata
    A.thaliana
    P.dactylifera
    0
    5000
    10000
    15000
    Set Size
    UpSet chart showing the distribution of shared gene families (sequence clusters)
    D’hont, A., Denoeud, F., Aury, J. M., Baurens, F. C., Carreel, F.,
    Garsmeur, O., ... & Wincker, P. (2012). The banana (Musa
    acuminata) genome and the evolution of monocotyledonous
    plants. Nature, 488(7410), 213-217.

    View Slide

  45. RNAseq: Use Case with Domain Conventions for Color Usage
    45
    LogFC: DANG_REGULATED_BY_MYC_UP
    Statistic
    Down
    Up
    −6.07
    −0.72
    −0.45
    −0.28
    −0.14
    −0.02
    0.13
    0.30
    0.52
    0.92
    6.75
    0 2.1
    Enrichment
    T−statistic: DANG_REGULATED_BY_MYC_UP
    0 3.3
    Enrichment
    Statistic
    Down
    Up
    −6.07
    −0.72
    −0.45
    −0.28
    −0.14
    −0.02
    0.13
    0.30
    0.52
    0.92
    6.75
    0 Enrichment
    T−statistic: DANG_REGULATED_BY_MYC_UP
    Statistic
    Down
    Up
    −11.50
    −2.04
    −1.24
    −0.74
    −0.35
    −0.04
    0.30
    0.68
    1.22
    2.20
    10.70
    0 3.3
    Enrichment

    View Slide

  46. ▪ Updated and extended 3:4 and
    16:9 Presentation templates


    ▪ Availability in both White and
    Black Backgrounds


    ▪ All proposed Colors Palettes are
    Colorblind Safe


    ▪ Internal Confluence


    ▪ External visualization.group
    Outcomes and Availability
    46

    View Slide

  47. The beginning and the End! Pantone 300 C


    Careful going to print! Colorspace changes to CMYK!
    47

    View Slide