Upgrade to Pro — share decks privately, control downloads, hide ads and more …

Exploring approaches to time-aware test suite prioritization

Exploring approaches to time-aware test suite prioritization

Interested in learning more about this topic? Visit this web site to see related presentations: https://www.gregorykapfhammer.com/research/presentations/

Gregory Kapfhammer

July 09, 2007
Tweet

More Decks by Gregory Kapfhammer

Other Decks in Technology

Transcript

  1. Mary Lou Soffa University of Virginia Collaborators: Kristen Walcott Gregory

    M. Kapfhammer, Allegheny College Exploring Time­Aware Test Suite Prioritization
  2. Regression testing Software constantly modified  Bug fixes  Addition

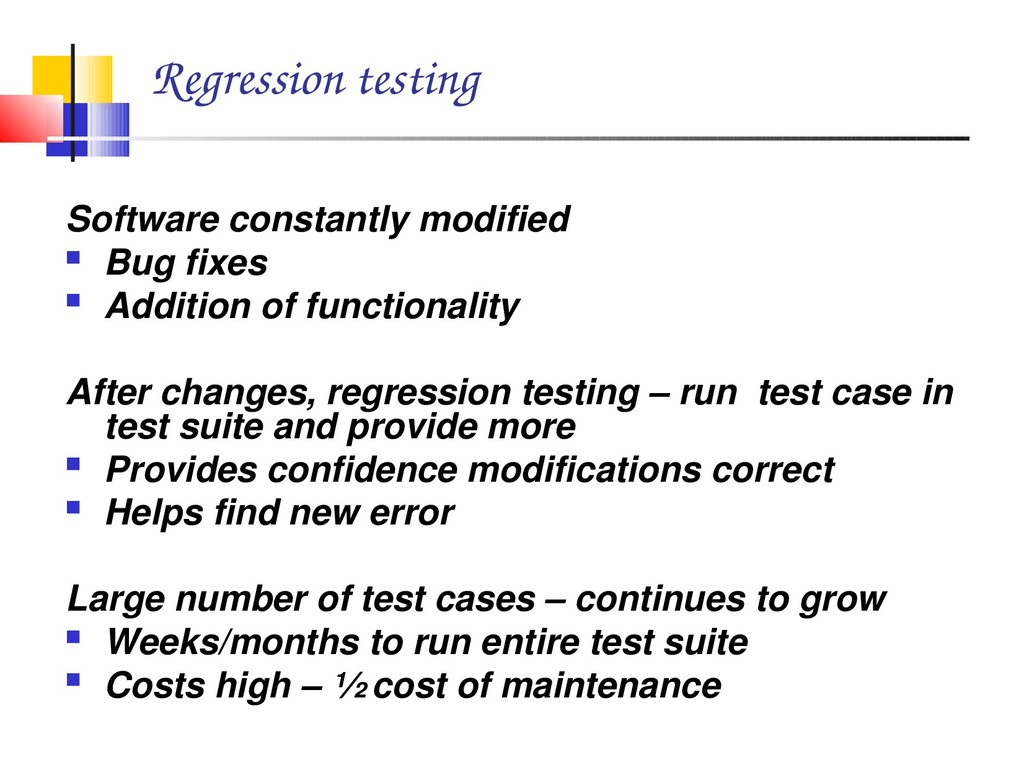
    of functionality After changes, regression testing – run test case in test suite and provide more  Provides confidence modifications correct  Helps find new error Large number of test cases – continues to grow  Weeks/months to run entire test suite  Costs high – ½ cost of maintenance
  3. Reducing cost regression testing  To reduce cost, do not

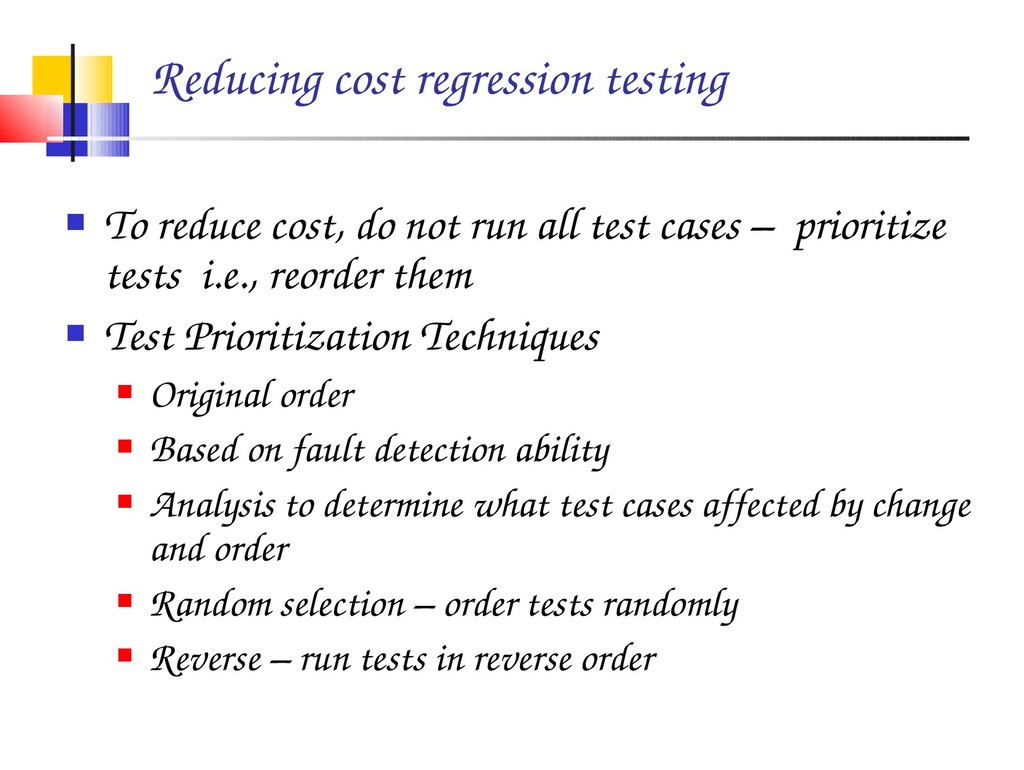
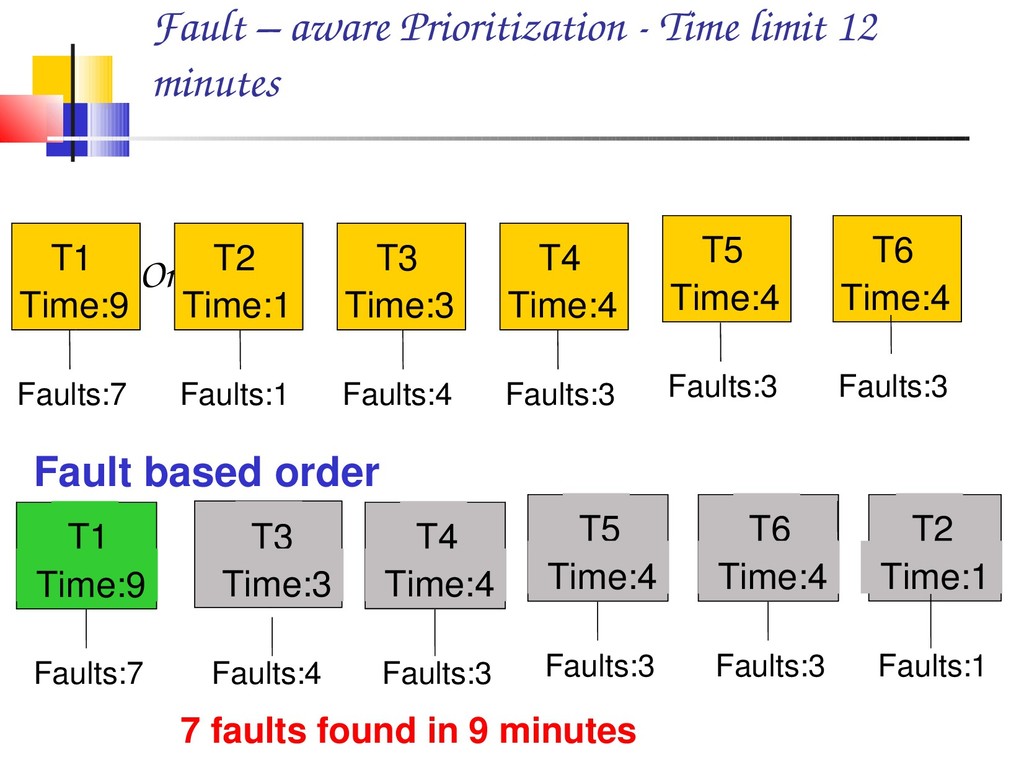
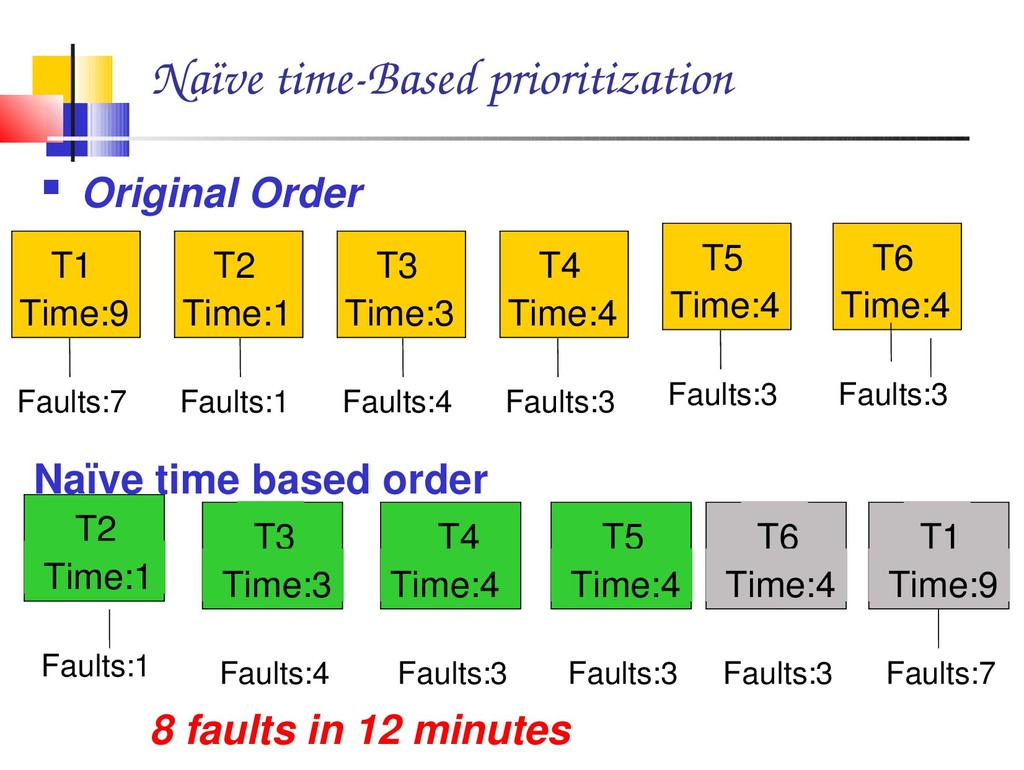
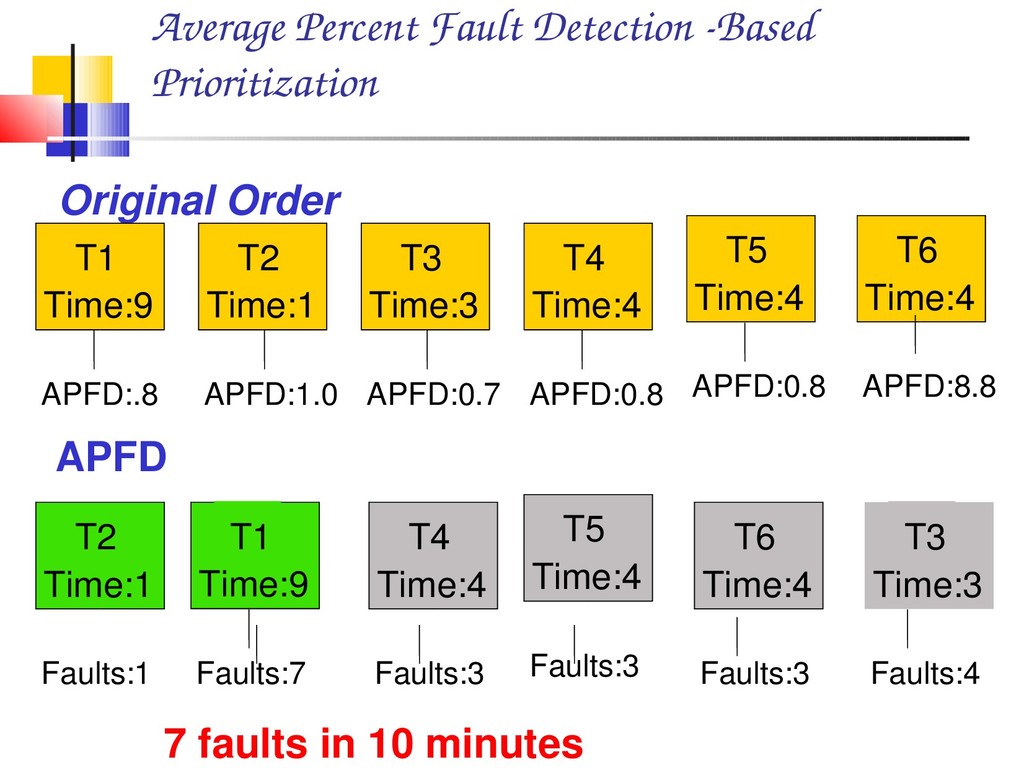
    run all test cases – prioritize tests i.e., reorder them  Test Prioritization Techniques  Original order  Based on fault detection ability  Analysis to determine what test cases affected by change and order  Random selection – order tests randomly  Reverse – run tests in reverse order
  4. Example – after prioritization But, retesting usually has a time

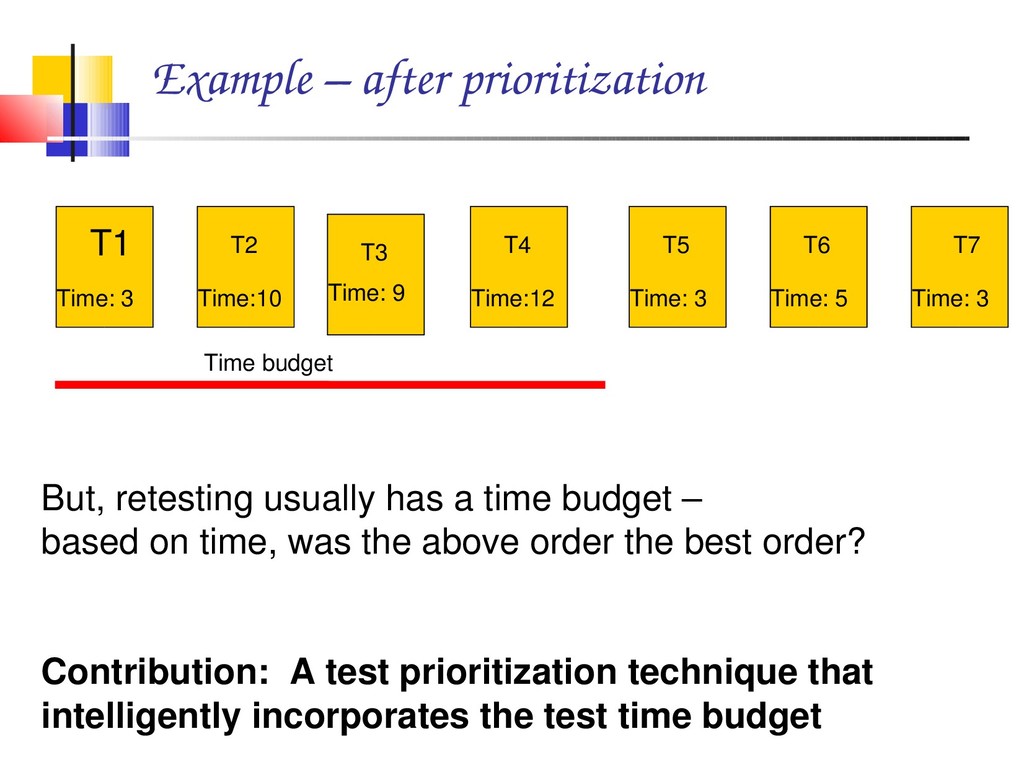
    budget – based on time, was the above order the best order? Contribution: A test prioritization technique that intelligently incorporates the test time budget Time budget T1 Time: 3 T2 Time:10 T3 Time: 9 T4 Time:12 T5 Time: 3 T6 Time: 5 T7 Time: 3
  5. Fault Matrix Example X X X T6 X X T5

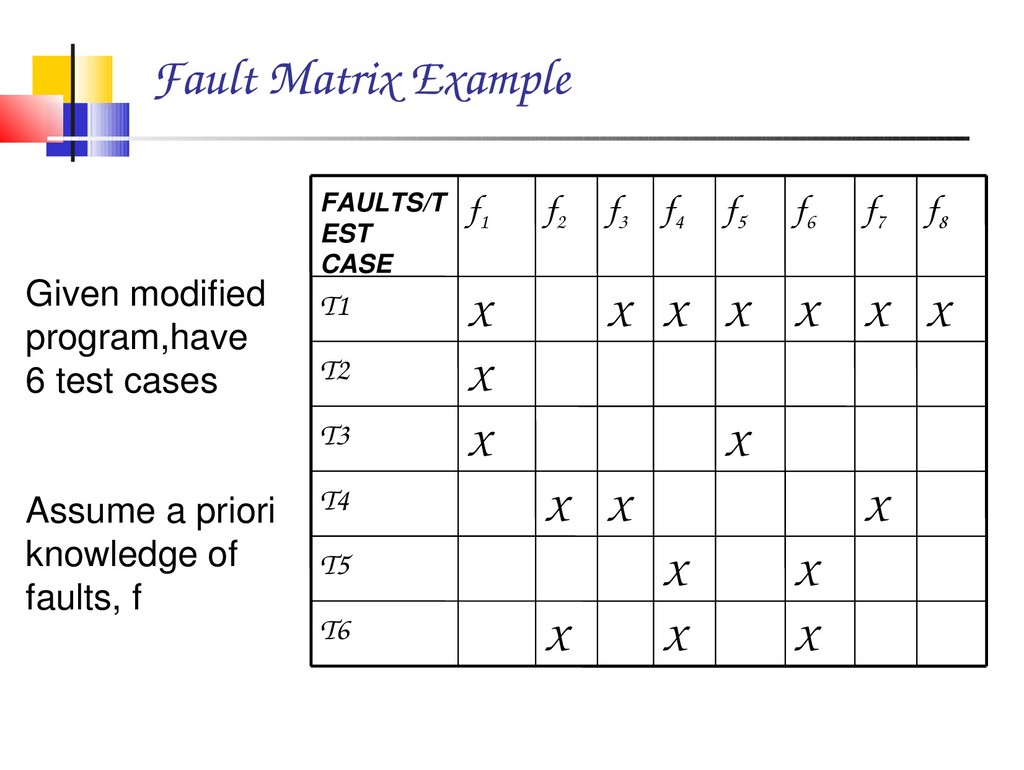
    X X X T4 X X T3 X T2 X X X X X X X T1 f 8 f 7 f 6 f 5 f 4 f 3 f 2 f 1 FAULTS/T EST CASE Given modified program,have 6 test cases Assume a priori knowledge of faults, f
  6. Test Suite Faults and Time O.75 4 3 T6 0.75

    4 3 T5 0.75 4 3 T4 0.667 3 2 T3 1.0 1 1 T2 0.778 9 7 T1 avg faults/min Time costs #faults Tests vary according to the time overhead and their ability to reveal faults GOAL: When testing, find as many
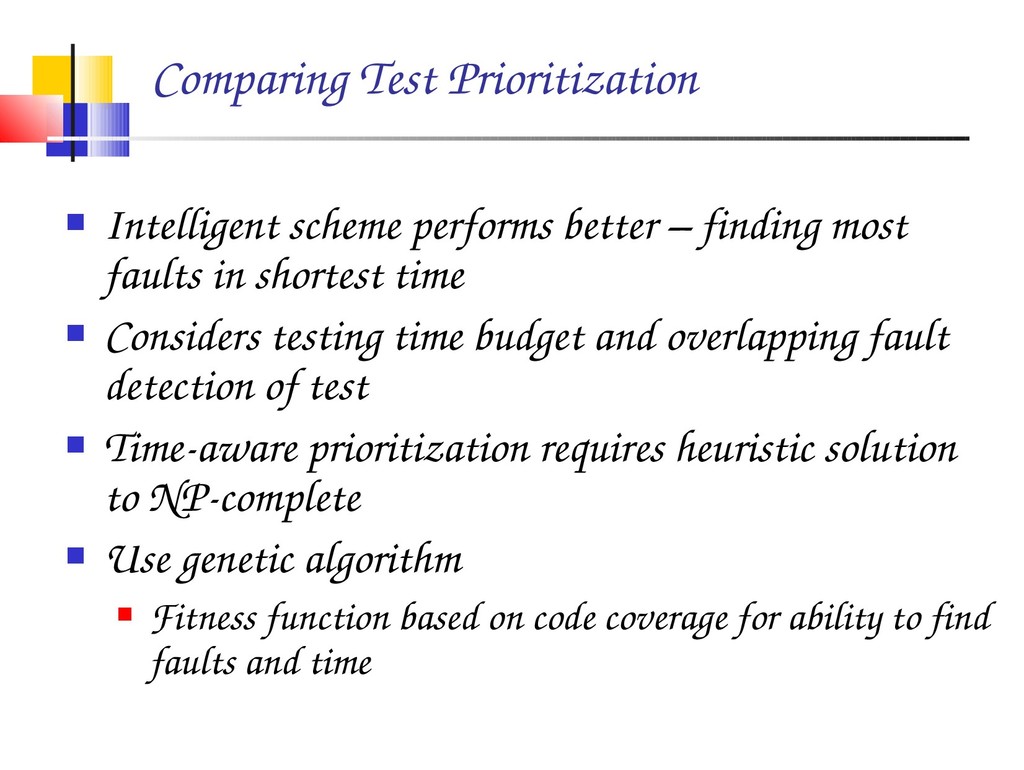
  7. Fault – aware Prioritization ­ Time limit 12 minutes Original

    Order T1 Time:9 Faults:7 T5 Time:4 Faults:3 T4 Time:4 Faults:3 T3 Time:3 Faults:4 T2 Time:1 Faults:1 T6 Time:4 Faults:3 T6 Time:4 Faults:3 T5 Time:4 Faults:3 T4 Time:4 Faults:3 T3 Time:3 Faults:4 T2 Time:1 Faults:1 T1 Time:9 Faults:7 Fault based order 7 faults found in 9 minutes
  8. Naïve time­Based prioritization  Original Order 8 faults in 12

    minutes T6 Time:4 Faults:3 T5 Time:4 Faults:3 T4 Time:4 Faults:3 T3 Time:3 Faults:4 T2 Time:1 Faults:1 T1 Time:9 Faults:7 Naïve time based order T6 Time:4 Faults:3 T5 Time:4 Faults:3 T4 Time:4 Faults:3 T3 Time:3 Faults:4 T2 Time:1 Faults:1 T1 Time:9 Faults:7
  9. Average Percent Fault Detection ­Based Prioritization Original Order T6 Time:4

    APFD:8.8 T5 Time:4 APFD:0.8 T4 Time:4 APFD:0.8 T3 Time:3 APFD:0.7 T2 Time:1 APFD:1.0 T1 Time:9 APFD:.8 T6 Time:4 Faults:3 T5 Time:4 Faults:3 T4 Time:4 Faults:3 T3 Time:3 Faults:4 T2 Time:1 Faults:1 T1 Time:9 Faults:7 APFD 7 faults in 10 minutes
  10. Intelligent Time­aware prioritization  Original order T6 Time:4 Faults:3 T5

    Time:4 Faults:3 T4 Time:4 Faults:3 T3 Time:3 Faults:4 T2 Time:1 Faults:1 T1 Time:9 Faults:7 8 faults in 11 minutes T5 Time:4 Faults:3 T4 Time:4 Faults:3 T3 Time:3 Faults:4 • Intelligent Time­aware prioritization T6 Time:4 Faults:3 T1 Time:9 Faults:7 T2 Time:1 Faults:1
  11. Comparing Test Prioritization  Intelligent scheme performs better – finding

    most faults in shortest time  Considers testing time budget and overlapping fault detection of test  Time­aware prioritization requires heuristic solution to NP­complete  Use genetic algorithm  Fitness function based on code coverage for ability to find faults and time
  12. Infrastructure Test Suite Coverage Calculator New Test suite Fitness Value

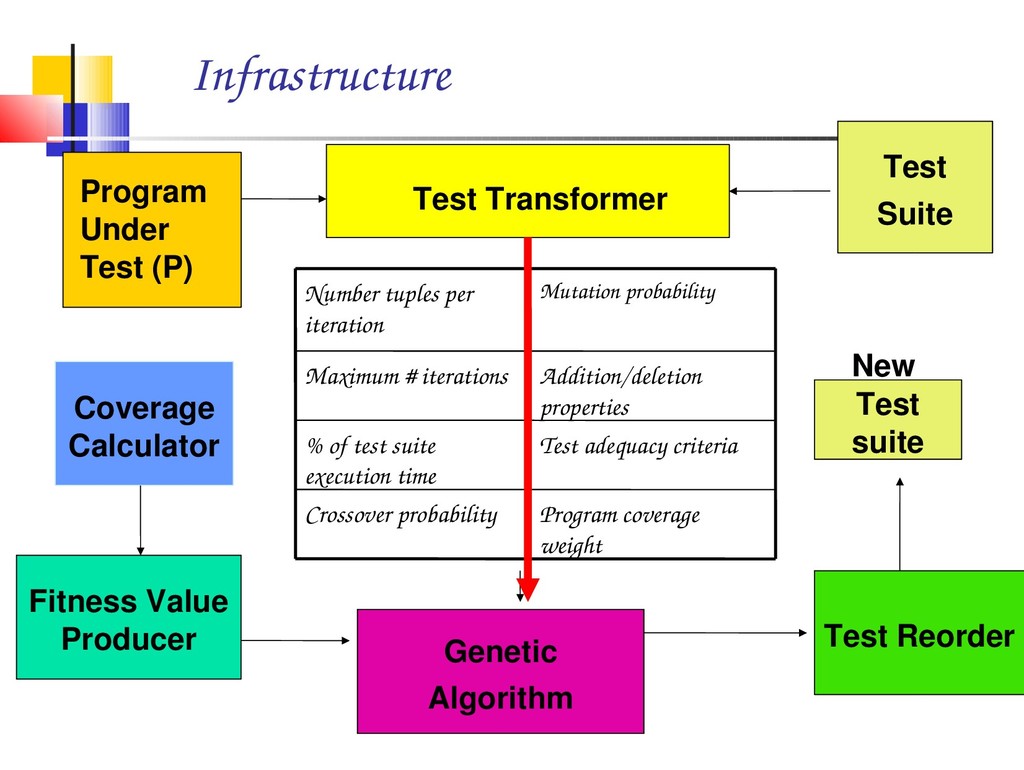
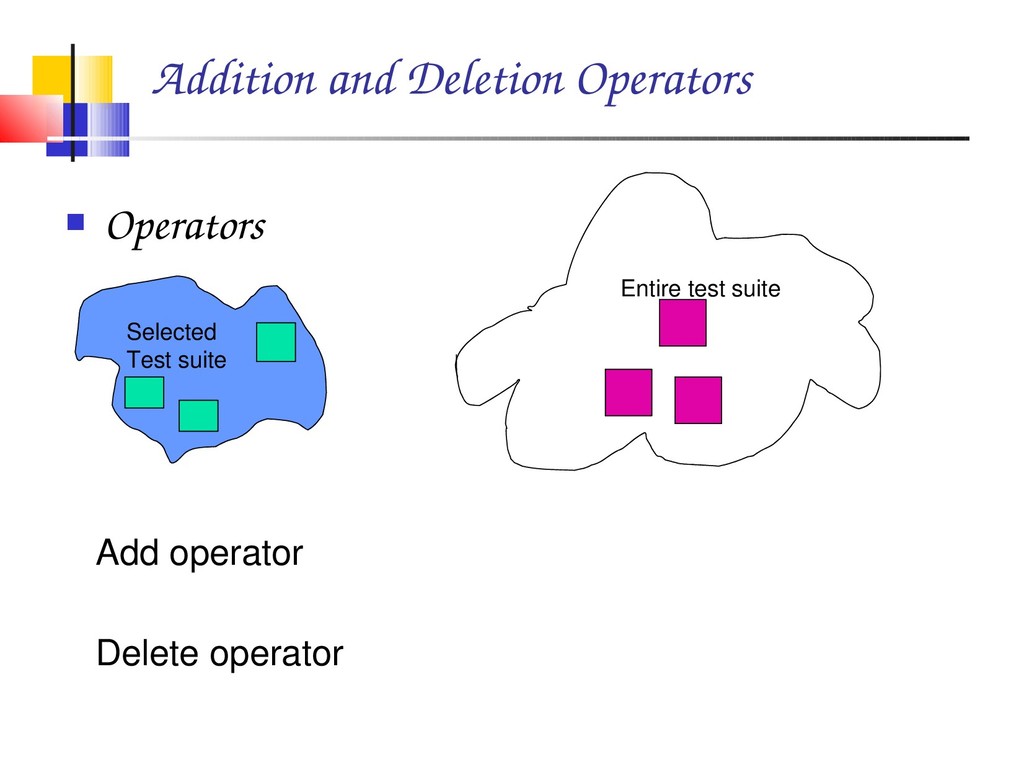
    Producer Genetic Algorithm Test Reorder Program Under Test (P) Test Transformer Program coverage weight Crossover probability Test adequacy criteria % of test suite execution time Addition/deletion properties Maximum # iterations Mutation probability Number tuples per iteration
  13. Fitness Function  Since fault information unknown, use method and

    block coverage to measure test suite potential  Coverage is aggregated for entire test suite  Test prioritization fitness measures  The percentage of P’s code that is covered by Ti  The time at which each test case covers code within P – can use percentages of code coverage
  14. Change the order of test cases  Develop smaller test

    suites based on operators that change  Order  Test cases included Fitness evaluation determines goodness of the changed suite.
  15. Mutation Operators  Another way to add variation to create

    new population  Test cases are mutated –  replaced by an unused test case  Swap test cases if no unused test case
  16. Experiment Goals and Design  Determine if the GA­produced prioritizations,

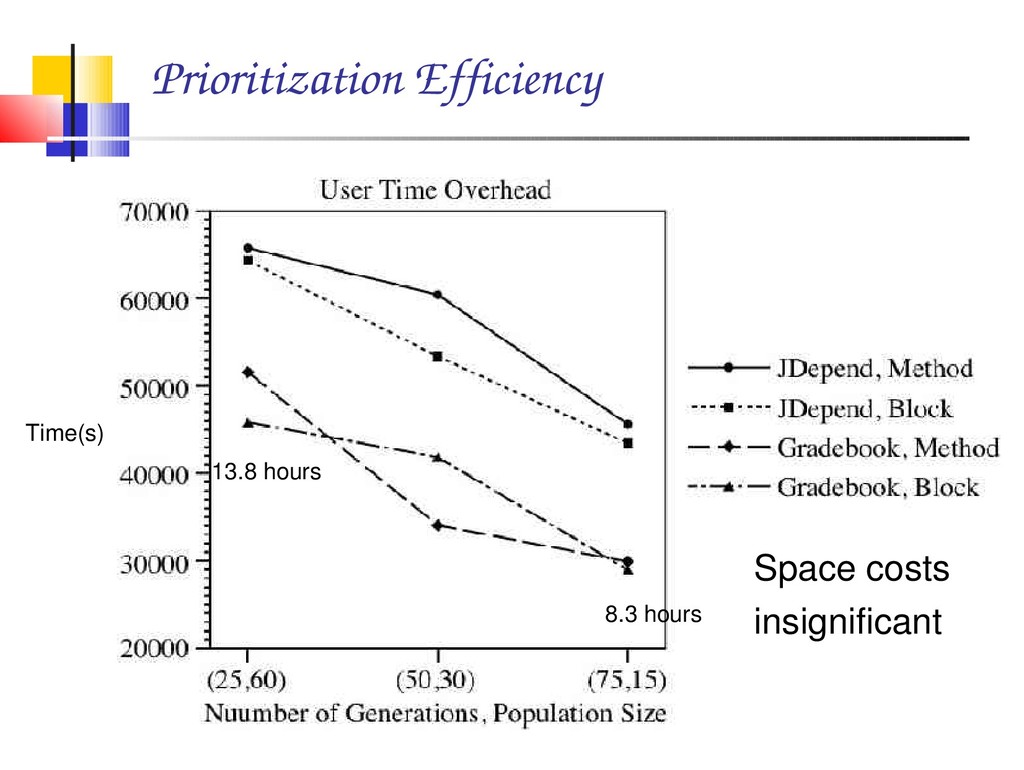
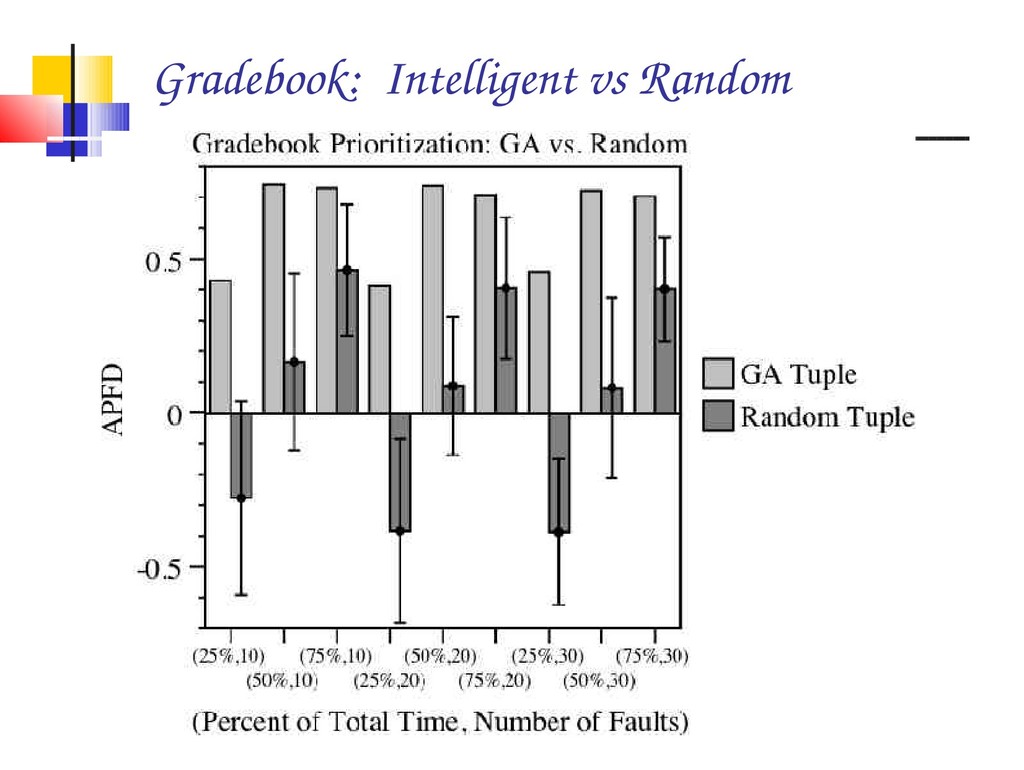
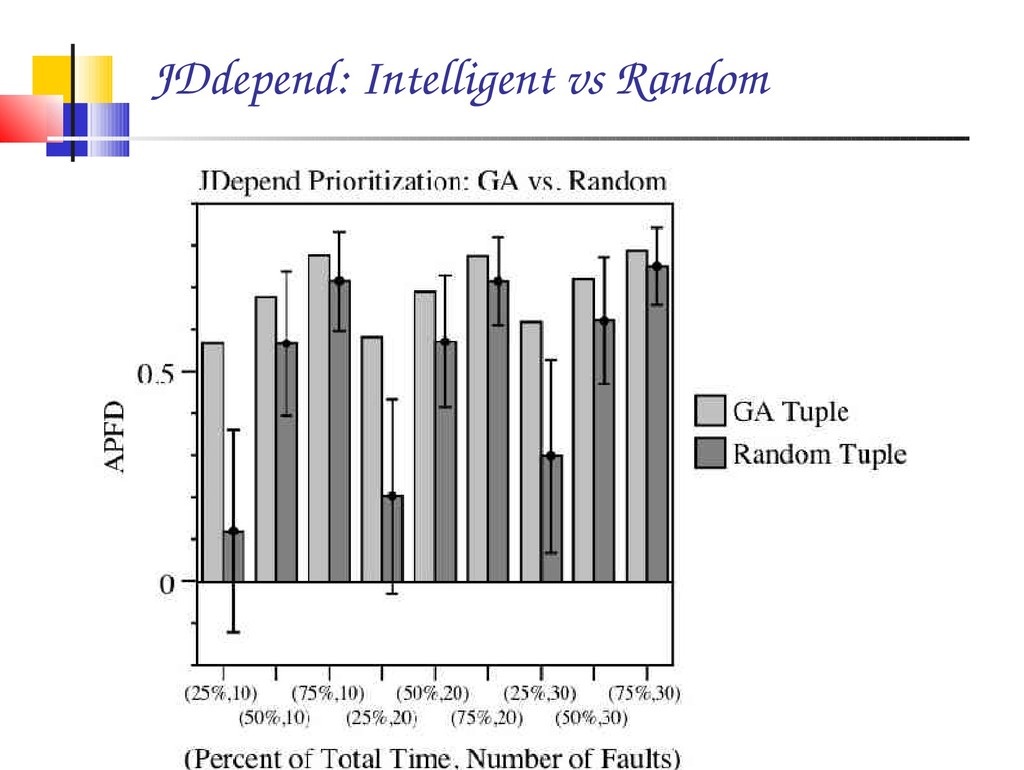
    on average, outperform a selected set of other prioritizations  Identify overhead ­ time and space ­ associated with the creation of the prioritized test suite
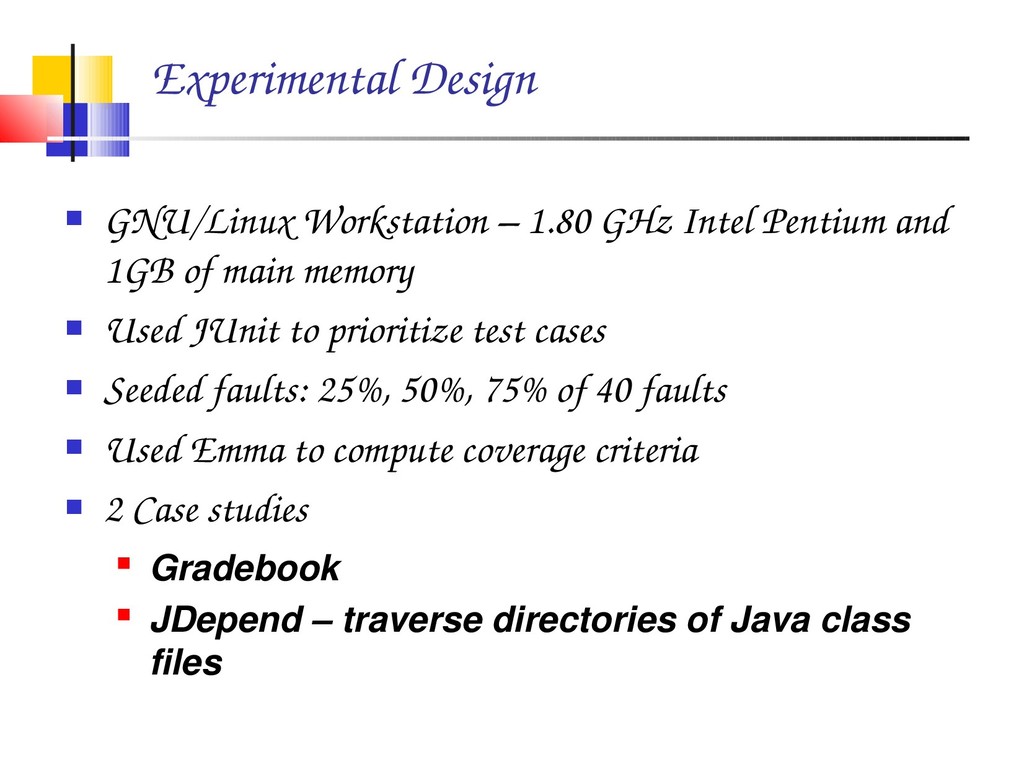
  17. Experiments  Block or method coverage  Order  Initial

    order  Reverse order  Random order  Fault­aware prioritization
  18. Experimental Design  GNU/Linux Workstation – 1.80 GHz Intel Pentium

    and 1GB of main memory  Used JUnit to prioritize test cases  Seeded faults: 25%, 50%, 75% of 40 faults  Used Emma to compute coverage criteria  2 Case studies  Gradebook  JDepend – traverse directories of Java class files
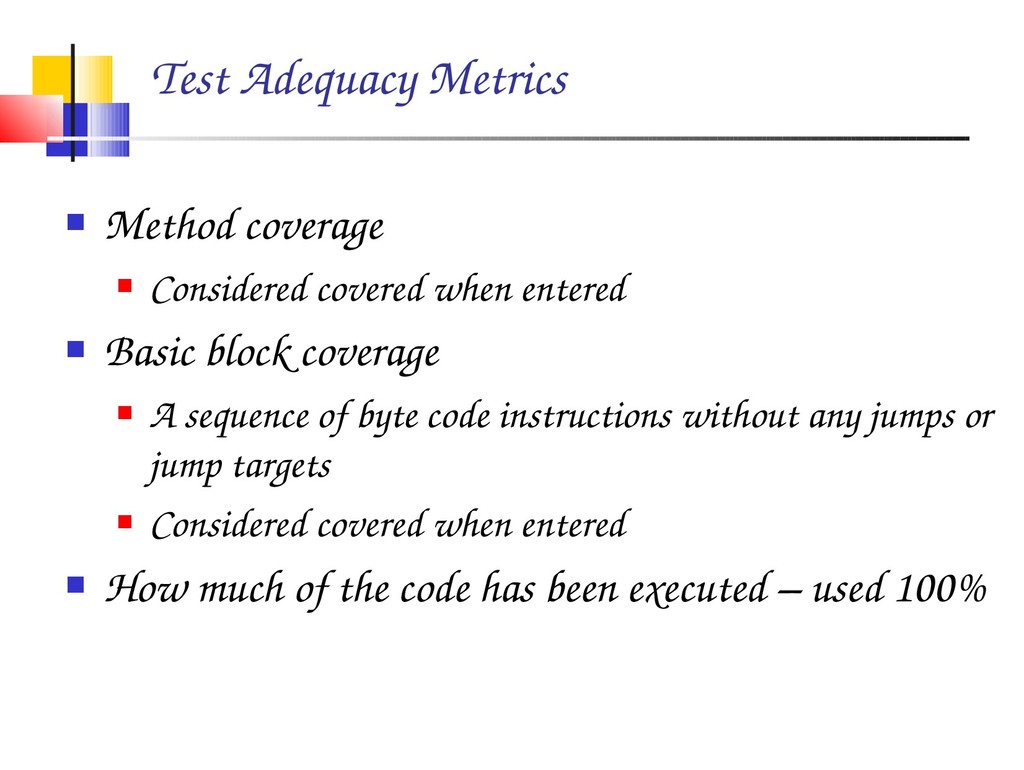
  19. Test Adequacy Metrics  Method coverage  Considered covered when

    entered  Basic block coverage  A sequence of byte code instructions without any jumps or jump targets  Considered covered when entered  How much of the code has been executed – used 100%
  20. Comparisons with other orders  Experiments to compare with other

    types of prioritizations  Original  Reverse  Fault aware (impossible to implement)  Time aware
  21. Gradebook: Alternative Prioritizations 0.7 0.9 0.5 0.04 30 0.75 0.7

    0.9 0.4 0.1 20 0.75 0.9 0.9 0.5 0.3 10 0.75 0.7 0.8 0.3 ­0.3 30 0.50 0.7 0.9 0.2 ­0.2 20 0.50 0.7 0.9 0.1 ­0.04 10 0.50 0.6 0.5 ­0.0 ­0.9 30 0.25 0.4 0.7 ­0.2 ­0.9 20 0.25 0.4 0.7 ­0.2 ­0.6 10 0.25 GA Fault aware Reverse Initial Fi Pi
  22. Results  Comparison of  Original  Fault­aware (impossible to

    implement)  Reverse  Gradebook  120% better than original  Time aware better than original  JDepend  Produced better results
  23. Technique Enhancements  Make fitness calculation faster  Eliminate the

    majority of coverage cover overlap by reducing the test suite  Record coverage on a per­test basis  Distribute execution of fitness function  Exploit test execution histories and favor tests that have recently revealed faults  Terminate the genetic algorithm when it achieves fitness equivalent to previous prioritizations
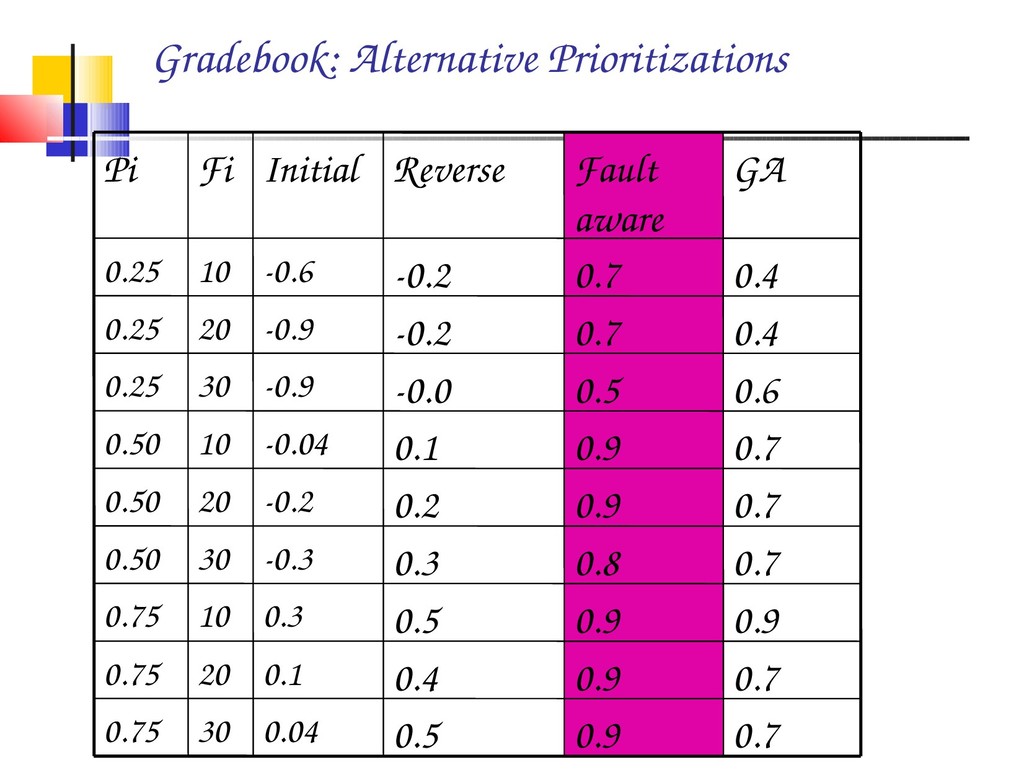
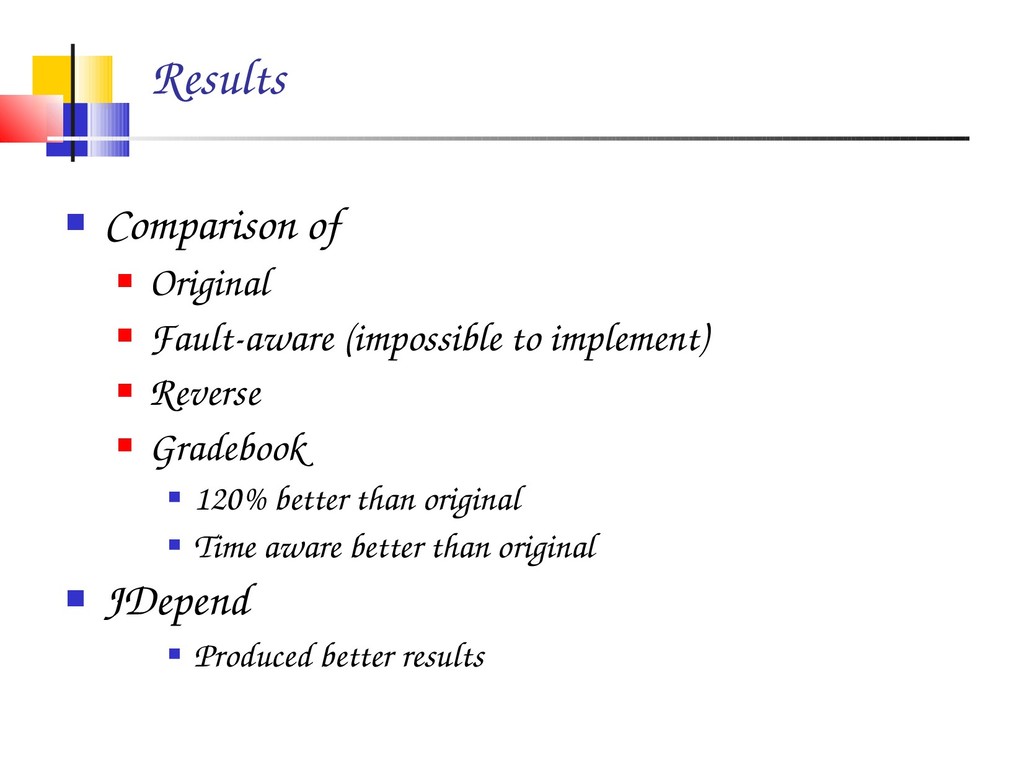
  24. Conclusions and Future Work  Contribution: a test prioritization technique

    that includes the testing time budget  Time­aware prioritization can yield a 120% improvement in APFD when compared to alternative prioritizations  Different heuristics ­ analysis