Upgrade to Pro — share decks privately, control downloads, hide ads and more …

introduction to dtrace

introduction to dtrace

Introduction to dtrace

Hemant Kumar

March 18, 2013
Tweet

More Decks by Hemant Kumar

Other Decks in Programming

Transcript

  1. What is DTrace • It is a sampling profiler. •

    Works on Solaris, Mac OSX, *BSD and Oracle Linux. Monday, 18 March 13
  2. Sampling profiler? • A sampling profiler probes the target program's

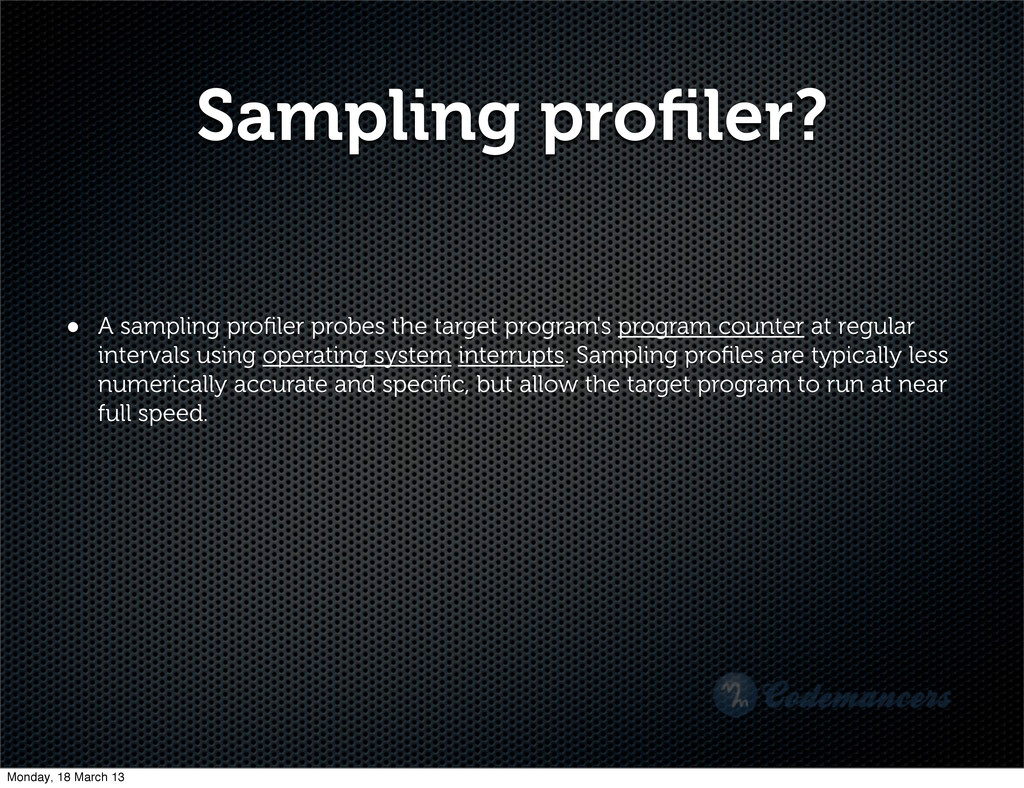
    program counter at regular intervals using operating system interrupts. Sampling profiles are typically less numerically accurate and specific, but allow the target program to run at near full speed. Monday, 18 March 13
  3. Advantages • Low overhead. • When turned off zero overhead.

    • No compilatin flags necessary. Monday, 18 March 13
  4. Anatomy of a Probe • ID - Internal ID of

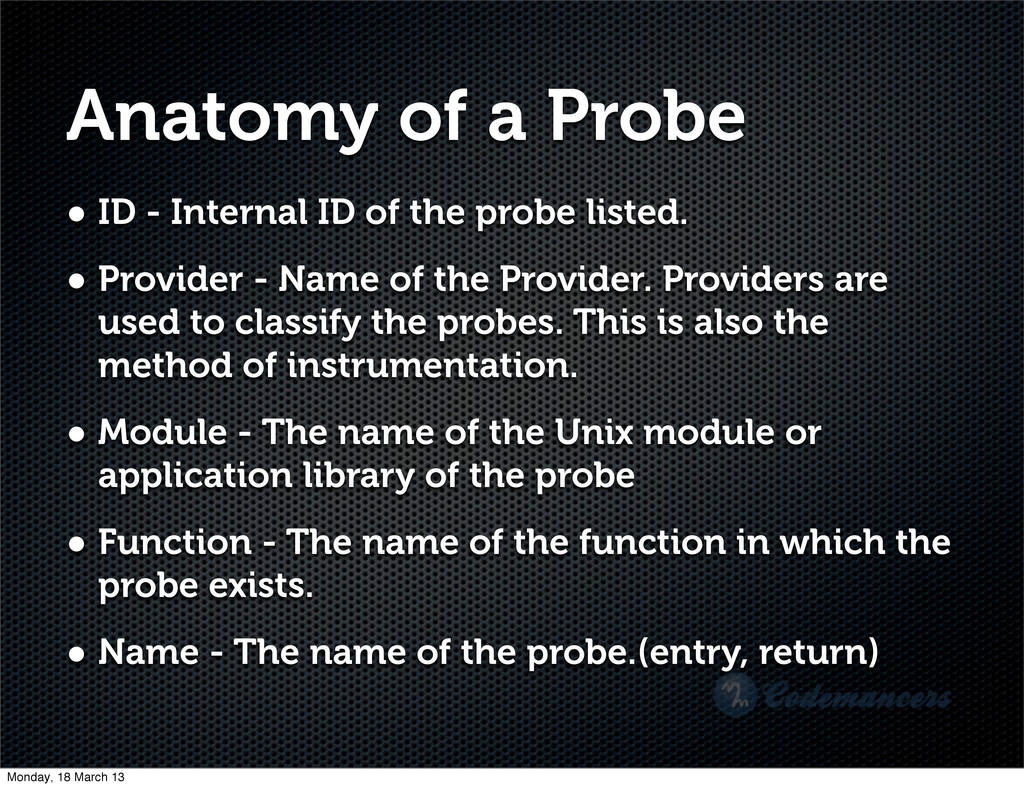
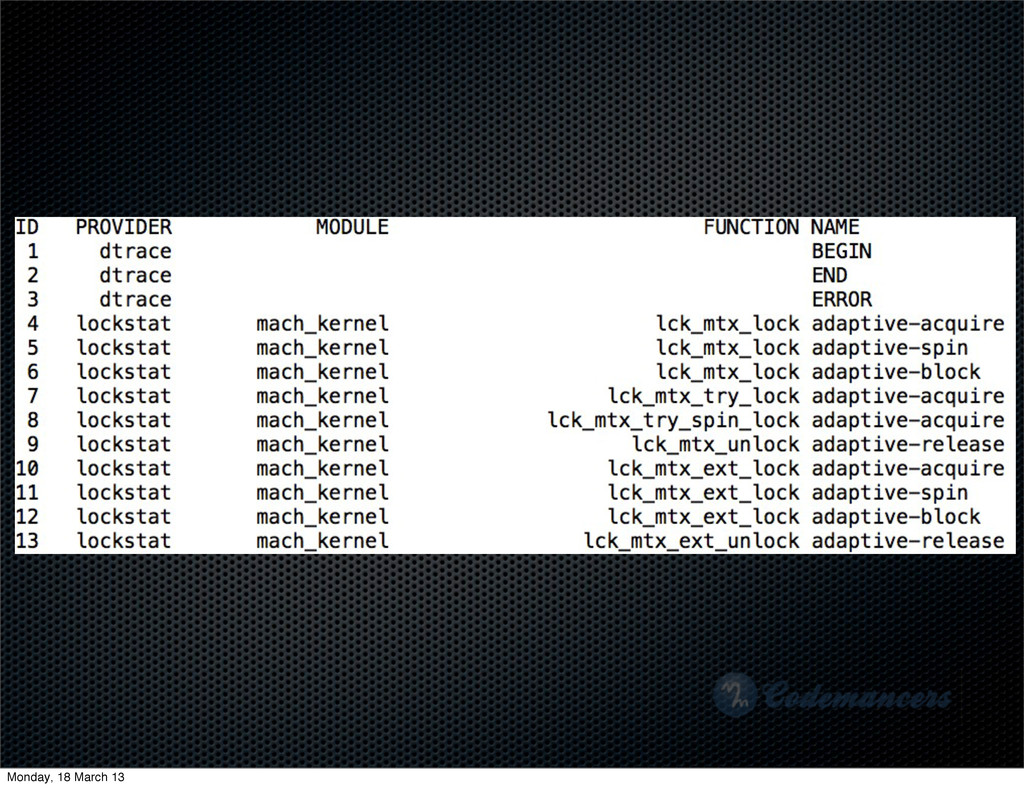
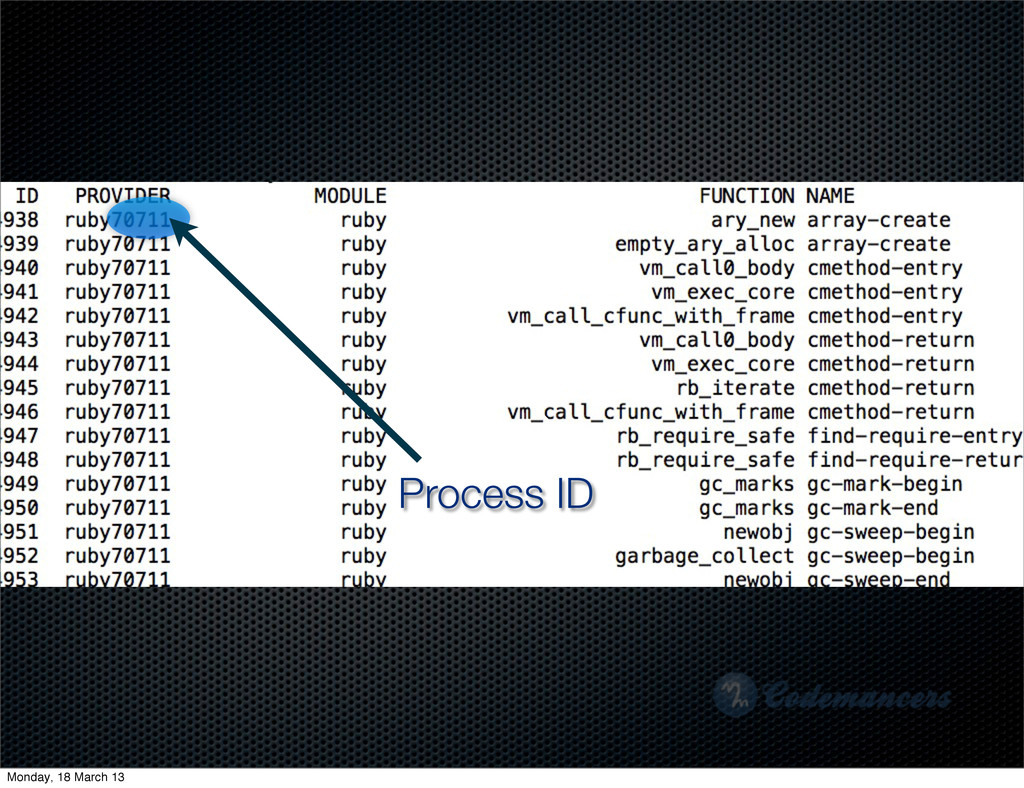
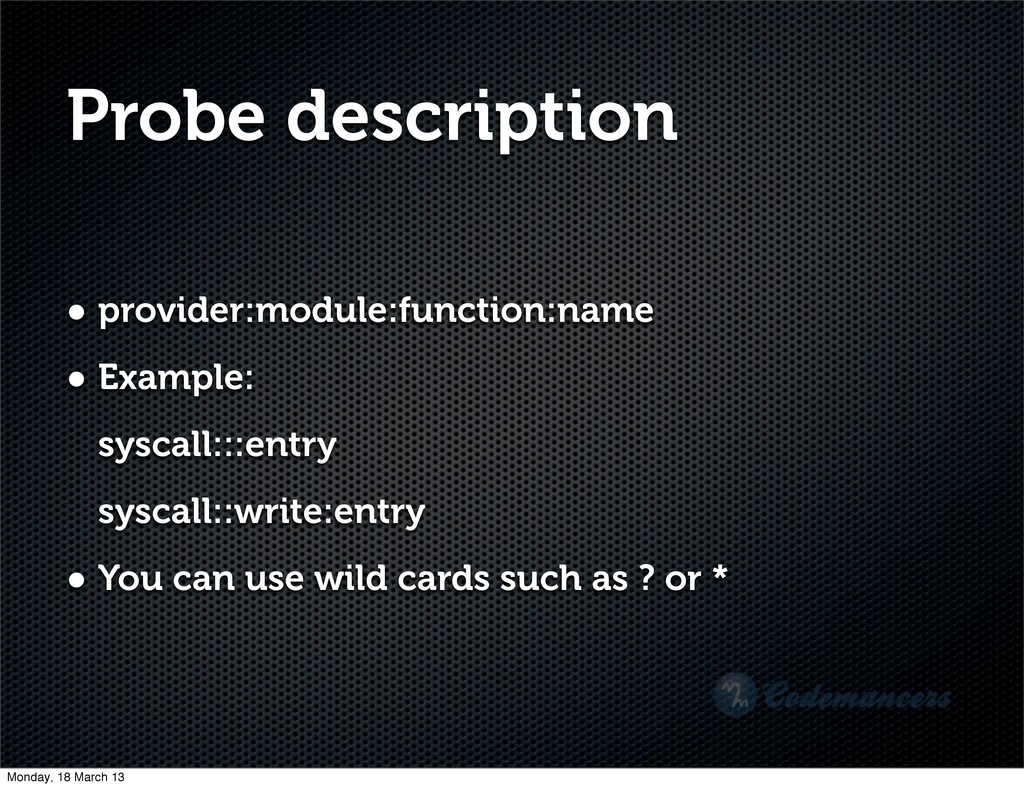
    the probe listed. • Provider - Name of the Provider. Providers are used to classify the probes. This is also the method of instrumentation. • Module - The name of the Unix module or application library of the probe • Function - The name of the function in which the probe exists. • Name - The name of the probe.(entry, return) Monday, 18 March 13
  5. Exploring existing probes ~> sudo dtrace -l -P syscall ~>

    sudo dtrace -l -f open ~> sudo dtrace -l -m mach_kernel Monday, 18 March 13
  6. Show me the Ruby probes • You must already have

    a program already running in target runtime. • ~> sudo dtrace -l -P ruby* Monday, 18 March 13
  7. Few example probes ~> sudo dtrace -f open ~> sudo

    dtrace -P syscall -f write Monday, 18 March 13
  8. D Programming Language • A subset of C and closer

    to awk etc. Can we run as scripts. Monday, 18 March 13
  9. Using D script language /* * Probe when any function

    is entered within syscall provider */ syscall:::entry { ! printf("%s(%d) called %s\n", execname, pid, probefunc); } Monday, 18 March 13
  10. /* * Probe when any function is entered within syscall

    provider */ syscall:::entry { ! printf("%s(%d) called %s\n", execname, pid, probefunc); } Probe description Monday, 18 March 13
  11. /* * Probe when any function is entered within syscall

    provider */ syscall:::entry { ! printf("%s(%d) called %s\n", execname, pid, probefunc); } Monday, 18 March 13
  12. Script variables 1. execname - Name of current process 2.

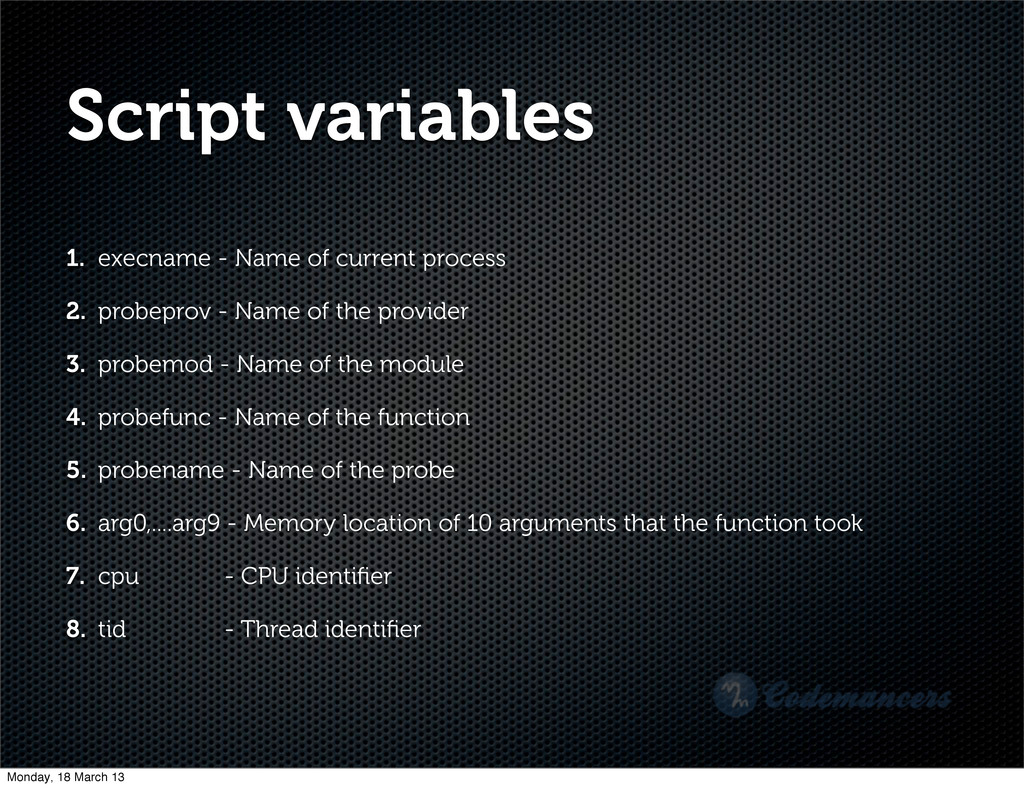
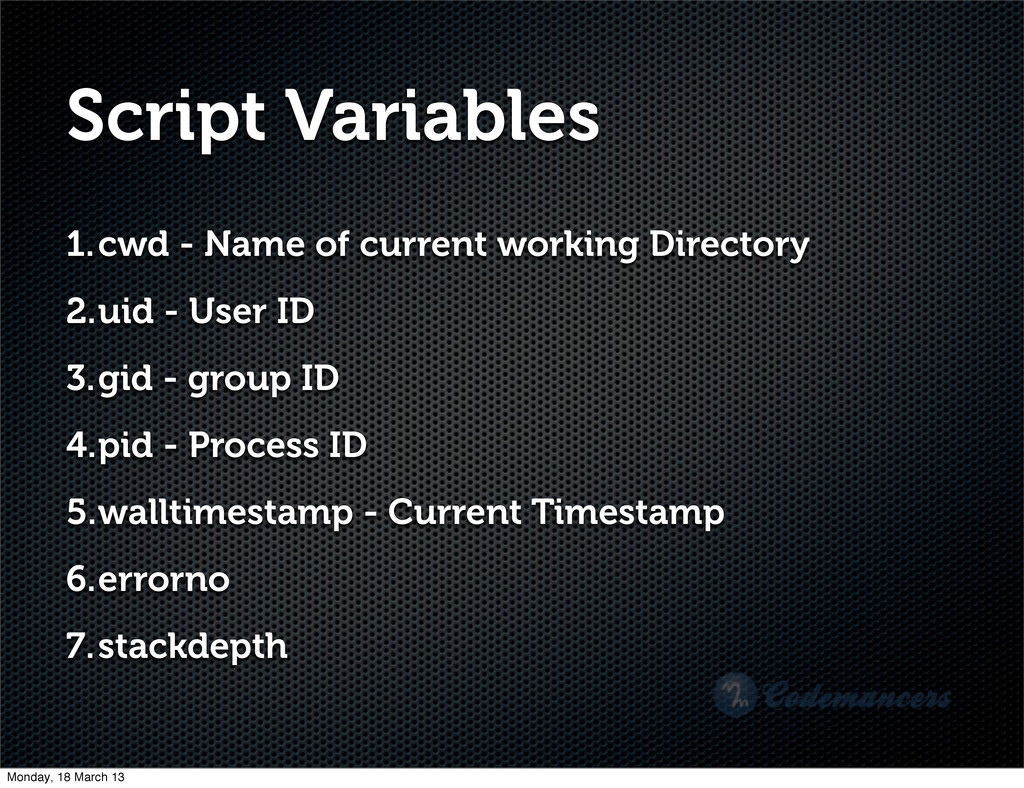
    probeprov - Name of the provider 3. probemod - Name of the module 4. probefunc - Name of the function 5. probename - Name of the probe 6. arg0,....arg9 - Memory location of 10 arguments that the function took 7. cpu - CPU identifier 8. tid - Thread identifier Monday, 18 March 13
  13. Script Variables 1.cwd - Name of current working Directory 2.uid

    - User ID 3.gid - group ID 4.pid - Process ID 5.walltimestamp - Current Timestamp 6.errorno 7.stackdepth Monday, 18 March 13
  14. Action /* * Probe when any function is entered within

    syscall provider */ syscall:::entry { ! printf("%s(%d) called %s\n", execname, pid, probefunc); } Monday, 18 March 13
  15. Goal • Print number of total bytes written by all

    currently running programs Monday, 18 March 13
  16. total_bytes.d /* * Probe when any function is entered within

    syscall provider */ syscall::write:entry { @bytes_written[execname] = sum(arg2); } END { printa(@bytes_written); } Monday, 18 March 13
  17. total_bytes.d /* * Probe when any function is entered within

    syscall provider */ syscall::write:entry { @bytes_written[execname] = sum(arg2); } END { printa(@bytes_written); } Monday, 18 March 13
  18. Makes sense? /* * Probe when any function is entered

    within syscall provider */ syscall::write:entry { @bytes_written[execname] = sum(arg2); } END { printa(@bytes_written); } Monday, 18 March 13
  19. Output formatting • printf() more or less same as C

    version. • printa() aggregate formatting • trace() • https://wikis.oracle.com/display/DTrace/Output +Formatting Monday, 18 March 13
  20. END Probe /* * Probe when any function is entered

    within syscall provider */ syscall::write:entry { @bytes_written[execname] = sum(arg2); } END { printa(@bytes_written); } Wont fire Monday, 18 March 13
  21. Goal • Print all class instances(with their count) created by

    currently running Ruby program. Monday, 18 March 13