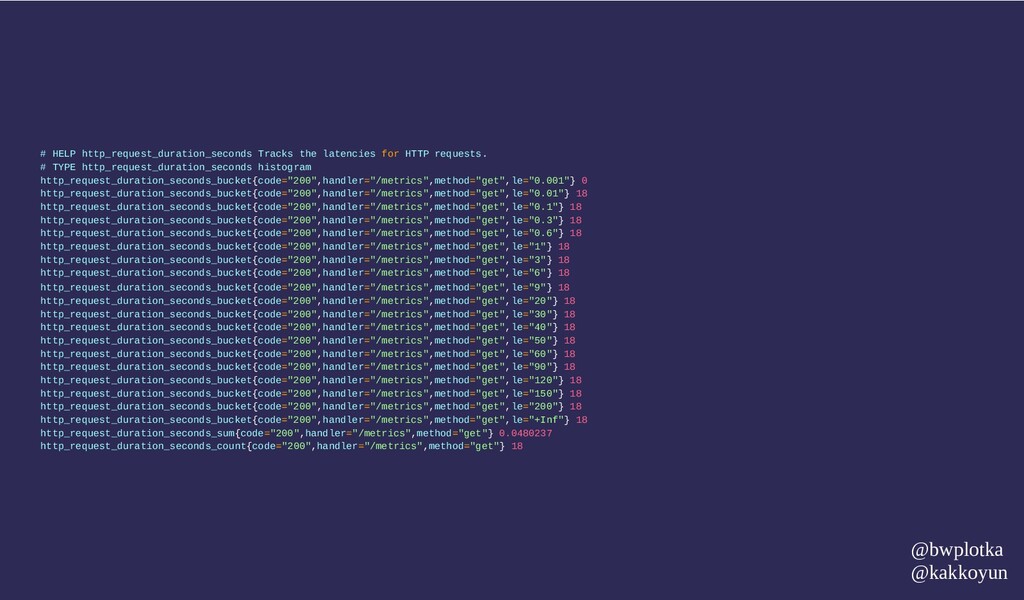
TYPE http_request_duration_seconds histogram http_request_duration_seconds_bucket{code="200",handler="/lb",method="post",le="0.001"} 0 http_request_duration_seconds_bucket{code="200",handler="/lb",method="post",le="0.01"} 2 http_request_duration_seconds_bucket{code="200",handler="/lb",method="post",le="0.1"} 2 http_request_duration_seconds_bucket{code="200",handler="/lb",method="post",le="0.3"} 2 http_request_duration_seconds_bucket{code="200",handler="/lb",method="post",le="0.6"} 2 http_request_duration_seconds_bucket{code="200",handler="/lb",method="post",le="1"} 2 http_request_duration_seconds_bucket{code="200",handler="/lb",method="post",le="3"} 2 http_request_duration_seconds_bucket{code="200",handler="/lb",method="post",le="6"} 2 http_request_duration_seconds_bucket{code="200",handler="/lb",method="post",le="9"} 2 http_request_duration_seconds_bucket{code="200",handler="/lb",method="post",le="20"} 2 http_request_duration_seconds_bucket{code="200",handler="/lb",method="post",le="30"} 2 http_request_duration_seconds_bucket{code="200",handler="/lb",method="post",le="40"} 2 http_request_duration_seconds_bucket{code="200",handler="/lb",method="post",le="50"} 2 http_request_duration_seconds_bucket{code="200",handler="/lb",method="post",le="60"} 2 http_request_duration_seconds_bucket{code="200",handler="/lb",method="post",le="90"} 2 http_request_duration_seconds_bucket{code="200",handler="/lb",method="post",le="120"} 2 http_request_duration_seconds_bucket{code="200",handler="/lb",method="post",le="150"} 2 http_request_duration_seconds_bucket{code="200",handler="/lb",method="post",le="200"} 2 http_request_duration_seconds_bucket{code="200",handler="/lb",method="post",le="+Inf"} 2 http_request_duration_seconds_sum{code="200",handler="/lb",method="post"} 0.0026940999999999996 http_request_duration_seconds_count{code="200",handler="/lb",method="post"} 2 http_request_duration_seconds_bucket{code="200",handler="/metrics",method="get",le="0.001"} 0 http_request_duration_seconds_bucket{code="200",handler="/metrics",method="get",le="0.01"} 146 http_request_duration_seconds_bucket{code="200",handler="/metrics",method="get",le="0.1"} 146 http_request_duration_seconds_bucket{code="200",handler="/metrics",method="get",le="0.3"} 146 http_request_duration_seconds_bucket{code="200",handler="/metrics",method="get",le="0.6"} 146 http_request_duration_seconds_bucket{code="200",handler="/metrics",method="get",le="1"} 146 http_request_duration_seconds_bucket{code="200",handler="/metrics",method="get",le="3"} 146 http_request_duration_seconds_bucket{code="200",handler="/metrics",method="get",le="6"} 146 http_request_duration_seconds_bucket{code="200",handler="/metrics",method="get",le="9"} 146 http_request_duration_seconds_bucket{code="200",handler="/metrics",method="get",le="20"} 146 http_request_duration_seconds_bucket{code="200",handler="/metrics",method="get",le="30"} 146 http_request_duration_seconds_bucket{code="200",handler="/metrics",method="get",le="40"} 146 http_request_duration_seconds_bucket{code="200",handler="/metrics",method="get",le="50"} 146 http_request_duration_seconds_bucket{code="200",handler="/metrics",method="get",le="60"} 146 http_request_duration_seconds_bucket{code="200",handler="/metrics",method="get",le="90"} 146 http_request_duration_seconds_bucket{code="200",handler="/metrics",method="get",le="120"} 146 http_request_duration_seconds_bucket{code="200",handler="/metrics",method="get",le="150"} 146 http_request_duration_seconds_bucket{code="200",handler="/metrics",method="get",le="200"} 146 http_request_duration_seconds_bucket{code="200",handler="/metrics",method="get",le="+Inf"} 146 http_request_duration_seconds_sum{code="200",handler="/metrics",method="get"} 0.3082099000000001 http_request_duration_seconds_count{code="200",handler="/metrics",method="get"} 146 http_request_duration_seconds_bucket{code="200",handler="demo-500-sometimes",method="post",le="0.001"} 1 http_request_duration_seconds_bucket{code="200",handler="demo-500-sometimes",method="post",le="0.01"} 1 http_request_duration_seconds_bucket{code="200",handler="demo-500-sometimes",method="post",le="0.1"} 1 http_request_duration_seconds_bucket{code="200",handler="demo-500-sometimes",method="post",le="0.3"} 1 http_request_duration_seconds_bucket{code="200",handler="demo-500-sometimes",method="post",le="0.6"} 1 http_request_duration_seconds_bucket{code="200",handler="demo-500-sometimes",method="post",le="1"} 1 http_request_duration_seconds_bucket{code="200",handler="demo-500-sometimes",method="post",le="3"} 1 http_request_duration_seconds_bucket{code="200",handler="demo-500-sometimes",method="post",le="6"} 1 http_request_duration_seconds_bucket{code="200",handler="demo-500-sometimes",method="post",le="9"} 1 http_request_duration_seconds_bucket{code="200",handler="demo-500-sometimes",method="post",le="20"} 1 http_request_duration_seconds_bucket{code="200",handler="demo-500-sometimes",method="post",le="30"} 1 http_request_duration_seconds_bucket{code="200",handler="demo-500-sometimes",method="post",le="40"} 1 http_request_duration_seconds_bucket{code="200",handler="demo-500-sometimes",method="post",le="50"} 1 http_request_duration_seconds_bucket{code="200",handler="demo-500-sometimes",method="post",le="60"} 1 http_request_duration_seconds_bucket{code="200",handler="demo-500-sometimes",method="post",le="90"} 1 http_request_duration_seconds_bucket{code="200",handler="demo-500-sometimes",method="post",le="120"} 1 http_request_duration_seconds_bucket{code="200",handler="demo-500-sometimes",method="post",le="150"} 1 http_request_duration_seconds_bucket{code="200",handler="demo-500-sometimes",method="post",le="200"} 1 http_request_duration_seconds_bucket{code="200",handler="demo-500-sometimes",method="post",le="+Inf"} 1 http_request_duration_seconds_sum{code="200",handler="demo-500-sometimes",method="post"} 4.01e-05 http_request_duration_seconds_count{code="200",handler="demo-500-sometimes",method="post"} 1 http_request_duration_seconds_bucket{code="200",handler="demo-refused-conn-sometimes",method="post",le="0.001"} 1 http_request_duration_seconds_bucket{code="200",handler="demo-refused-conn-sometimes",method="post",le="0.01"} 1 http_request_duration_seconds_bucket{code="200",handler="demo-refused-conn-sometimes",method="post",le="0.1"} 1 http_request_duration_seconds_bucket{code="200",handler="demo-refused-conn-sometimes",method="post",le="0.3"} 1 http_request_duration_seconds_bucket{code="200",handler="demo-refused-conn-sometimes",method="post",le="0.6"} 1 http_request_duration_seconds_bucket{code="200",handler="demo-refused-conn-sometimes",method="post",le="1"} 1 http_request_duration_seconds_bucket{code="200",handler="demo-refused-conn-sometimes",method="post",le="3"} 1 http_request_duration_seconds_bucket{code="200",handler="demo-refused-conn-sometimes",method="post",le="6"} 1 http_request_duration_seconds_bucket{code="200",handler="demo-refused-conn-sometimes",method="post",le="9"} 1 http_request_duration_seconds_bucket{code="200",handler="demo-refused-conn-sometimes",method="post",le="20"} 1 http_request_duration_seconds_bucket{code="200",handler="demo-refused-conn-sometimes",method="post",le="30"} 1 http_request_duration_seconds_bucket{code="200",handler="demo-refused-conn-sometimes",method="post",le="40"} 1 http_request_duration_seconds_bucket{code="200",handler="demo-refused-conn-sometimes",method="post",le="50"} 1 http_request_duration_seconds_bucket{code="200",handler="demo-refused-conn-sometimes",method="post",le="60"} 1 http_request_duration_seconds_bucket{code="200",handler="demo-refused-conn-sometimes",method="post",le="90"} 1 http_request_duration_seconds_bucket{code="200",handler="demo-refused-conn-sometimes",method="post",le="120"} 1 http_request_duration_seconds_bucket{code="200",handler="demo-refused-conn-sometimes",method="post",le="150"} 1 http_request_duration_seconds_bucket{code="200",handler="demo-refused-conn-sometimes",method="post",le="200"} 1 http_request_duration_seconds_bucket{code="200",handler="demo-refused-conn-sometimes",method="post",le="+Inf"} 1 http_request_duration_seconds_sum{code="200",handler="demo-refused-conn-sometimes",method="post"} 4.46e-05 http_request_duration_seconds_count{code="200",handler="demo-refused-conn-sometimes",method="post"} 1 @bwplotka @kakkoyun