$30 off During Our Annual Pro Sale. View Details »

Data Tests

Data Tests

Abstract

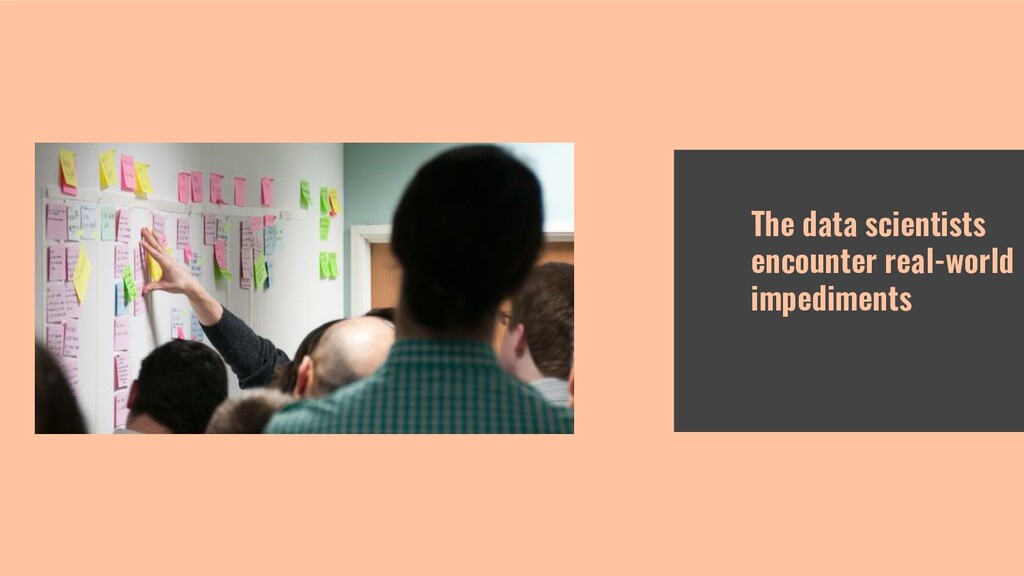
Data science projects in commercial companies often experience a challenge arising from evolving data sources. As the project progresses, new signals and information sources are added incrementally. In practice, when the data source changes, it creates a need to change the application source code.

With no design up front, some application modules, such as a dashboard or a machine learning model, unwittingly become dependent on the data source. In this case, accommodating the evolving data source is not simply a matter of changing the code related to the data source. Rather, preserving the rest of the existing application in a working condition involves further code changes in distant elements of the application.

An alternative way of dealing with evolving data sources is to introduce a small design up front. Such design lets programmers manage the source code dependencies throughout the project life-cycle.

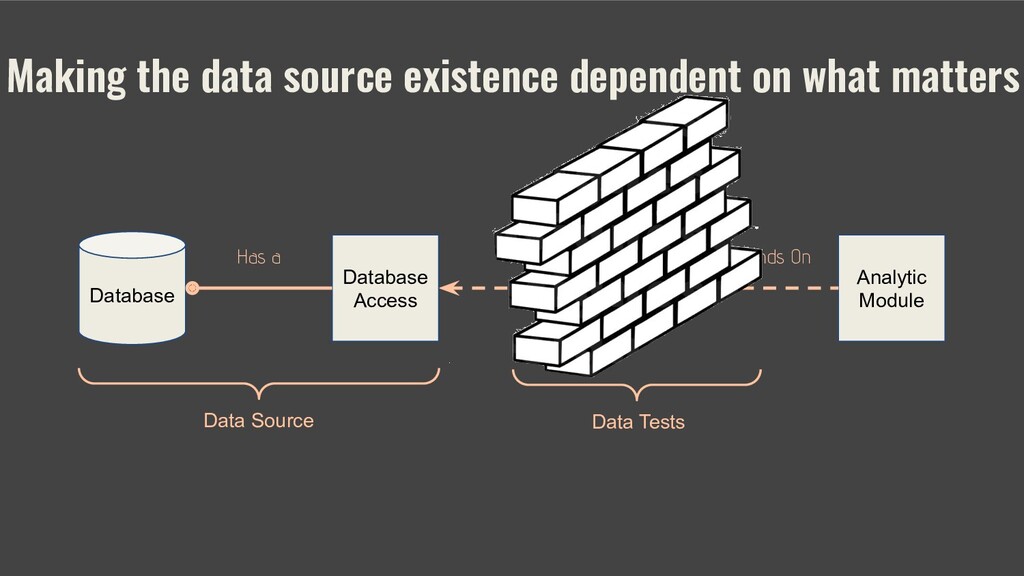
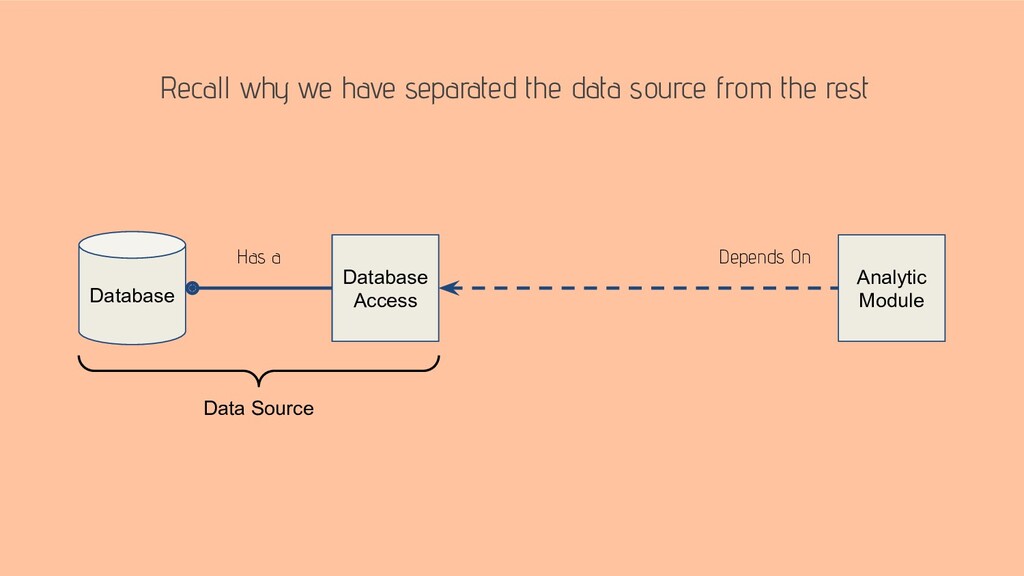
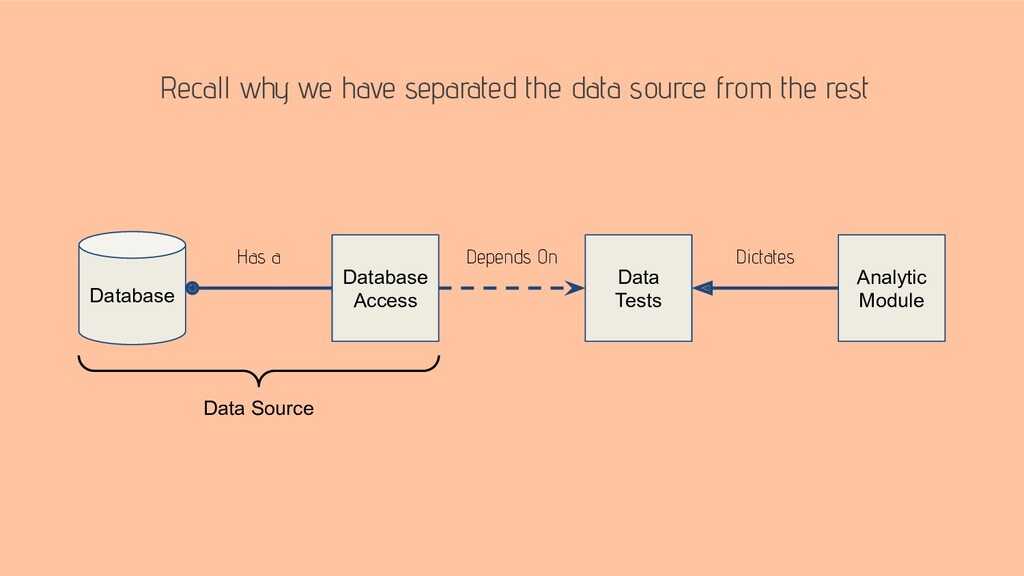
This talk suggests a design that (1) separates data sources from analytic applications and (2) restricts analytic applications from knowing about the data sources.

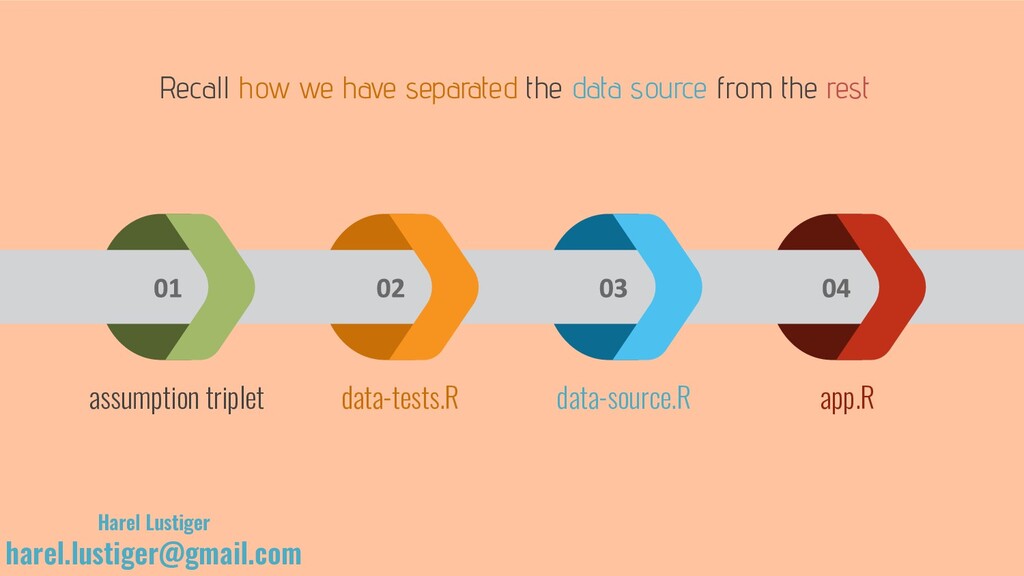
While the evolving data sources challenge is programming language agnostic, this talk demonstrates an implementation of the suggested design in R.

The takeaway of this talk is a design of a system, where data sources are plugins to the system’s analytic modules.

---

This presentation was given at satRday Auckland, February 2020.
See event details at https://auckland2020.satrdays.org/#portfolioModal7

Harel Lustiger

February 22, 2020
Tweet

More Decks by Harel Lustiger

Other Decks in Programming

Transcript

  1. Data Tests
    Separating between Data Sources and the Rest
    satRday, February 2020
    Harel Lustiger
    Data Scientist, Harmonic Analytics

    View Slide

  2. What are we doing?
    We are separating between the data source and the rest

    View Slide

  3. Insert 500 hundred lines here
    ggplot(Tog3[-c(1,28),], aes(Date,Rec2All, colour = isChina))+
    geom_line(size = 2.2, alpha = 0.5)+
    data <- read.csv("../input/novel-corona-virus-2019-dataset.csv")
    data <- data[,c(1:2,4,6:8)]
    data$isChina <- ifelse(data$Country %in% c("Mainland China",
    "China"),"China", "Not China")
    data$Date <- as.Date(data$Date, format = "%m/%d/%y")
    Insert 100 hundred lines here
    # main.R
    Dividing the analytic application into modules
    analytic module
    data source

    View Slide

  4. Making the data source existence dependent on what matters
    Analytic
    Module
    Depends On
    Database
    Database
    Access
    Has a
    Data Source Data Tests

    View Slide

  5. What’s the Story?
    We are helping our clients by fitting a solution to their needs

    View Slide

  6. Getting to know our
    client
    Euel Cheatam the
    Mercedes dealership
    manager

    View Slide

  7. The proposed
    solution is a weekly
    fact sheet with
    popular Q&A

    View Slide

  8. The data scientists
    encounter real-world
    impediments

    View Slide

  9. Iteration Zero
    developing a data-driven app without real data

    View Slide

  10. Generate dataset assumption triplet
    01

    View Slide

  11. The analytic application expects tidy-data1 as its input
    1 https://r4ds.had.co.nz/tidy-data.html

    View Slide

  12. Observation Unique
    Identifier (UID)
    Target variable
    Salient features
    We formulate a tidy dataset by making three assumptions

    View Slide

  13. Convert assumptions to assertions with data-tests
    02

    View Slide

  14. ## 1. Check if the dataset exists
    stopifnot(exist("cars_data"), is.data.frame(cars_data))
    # data-tests.R
    ## 2. Check if the necessary columns exist
    expected_cols <- c("car_model", "price", "gear", "mpg")
    stopifnot(all(expected_cols %in% colnames(cars_data)))
    ## 3. Check if the records are unique
    is.distinct <- function(x) dplyr::n_distinct(x) == length(x)
    stopifnot(is.distinct(cars_data$car_model))

    View Slide

  15. Implement a data source plugin
    03

    View Slide

  16. Quick glimpse over dataset::mtcars
    Observation
    Unique Identifier
    Salient Feature
    Salient Feature

    View Slide

  17. # data-source.R
    get_cars_data <- function(){
    ## 1. Generate records
    data(mtcars, package = "datasets")
    cars_data <- mtcars %>% tibble::rownames_to_column("car_model")
    ## 2. Generate price
    set.seed(2020)
    price <- runif(n = nrow(cars_data), min = 41, max = 75)
    cars_data <- cars_data %>% tibble::add_column(price = price)
    ## Run data-tests
    source("data-tests.R")
    return(cars_data)
    }
    ## 1. Generate records
    data(mtcars, package = "datasets")
    cars_data <- mtcars %>% tibble::rownames_to_column("car_model")
    ## 2. Generate price
    set.seed(2020)
    price <- runif(n = nrow(cars_data), min = 41, max = 75)
    cars_data <- cars_data %>% tibble::add_column(price = price)

    View Slide

  18. Develop an analytic module
    04

    View Slide

  19. # app.R
    ## 1. Get the data
    source("data-source.R")
    cars_data <- get_cars_data()
    ## 2. Render booklet
    print(cars_data %>% dplyr::select(car_model, mpg, gear, price))
    boxplot(price ~ gear, cars_data)
    lm(price ~ mpg + gear, cars_data) %>% summary()

    View Slide

  20. Conclusion
    Why and how we separate the data source from the rest

    View Slide

  21. Recall why we have separated the data source from the rest
    Database
    Database
    Access
    Analytic
    Module
    Depends On
    Has a
    Data Source

    View Slide

  22. Recall why we have separated the data source from the rest
    Database
    Database
    Access
    Data
    Tests
    Analytic
    Module
    Depends On Dictates
    Has a
    Data Source

    View Slide

  23. Recall how we have separated the data source from the rest
    Harel Lustiger
    [email protected]
    assumption triplet data-tests.R data-source.R app.R

    View Slide