Tableau Public公式サンプルの「Titanic Passenger List」(1,309人の乗船記録)を題材にした、2時間のハンズオン勉強会の進行スライドです。
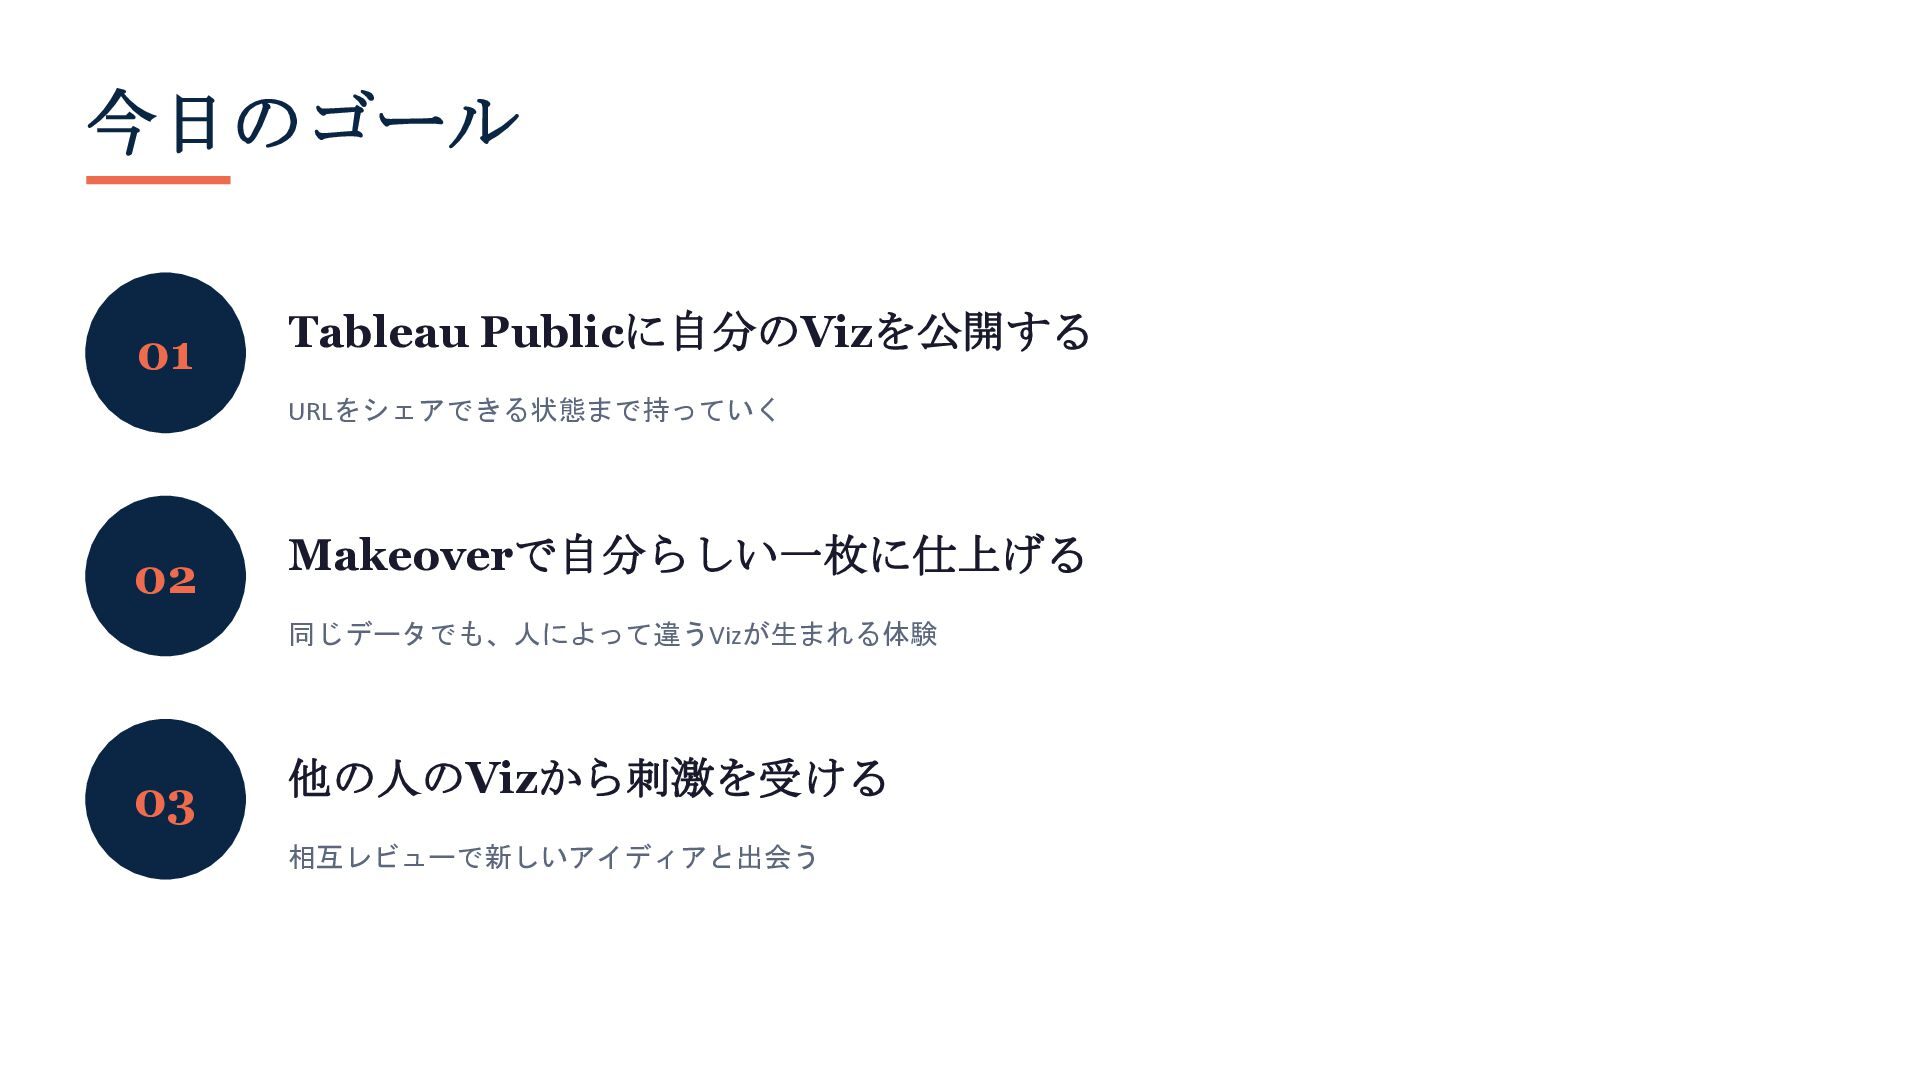
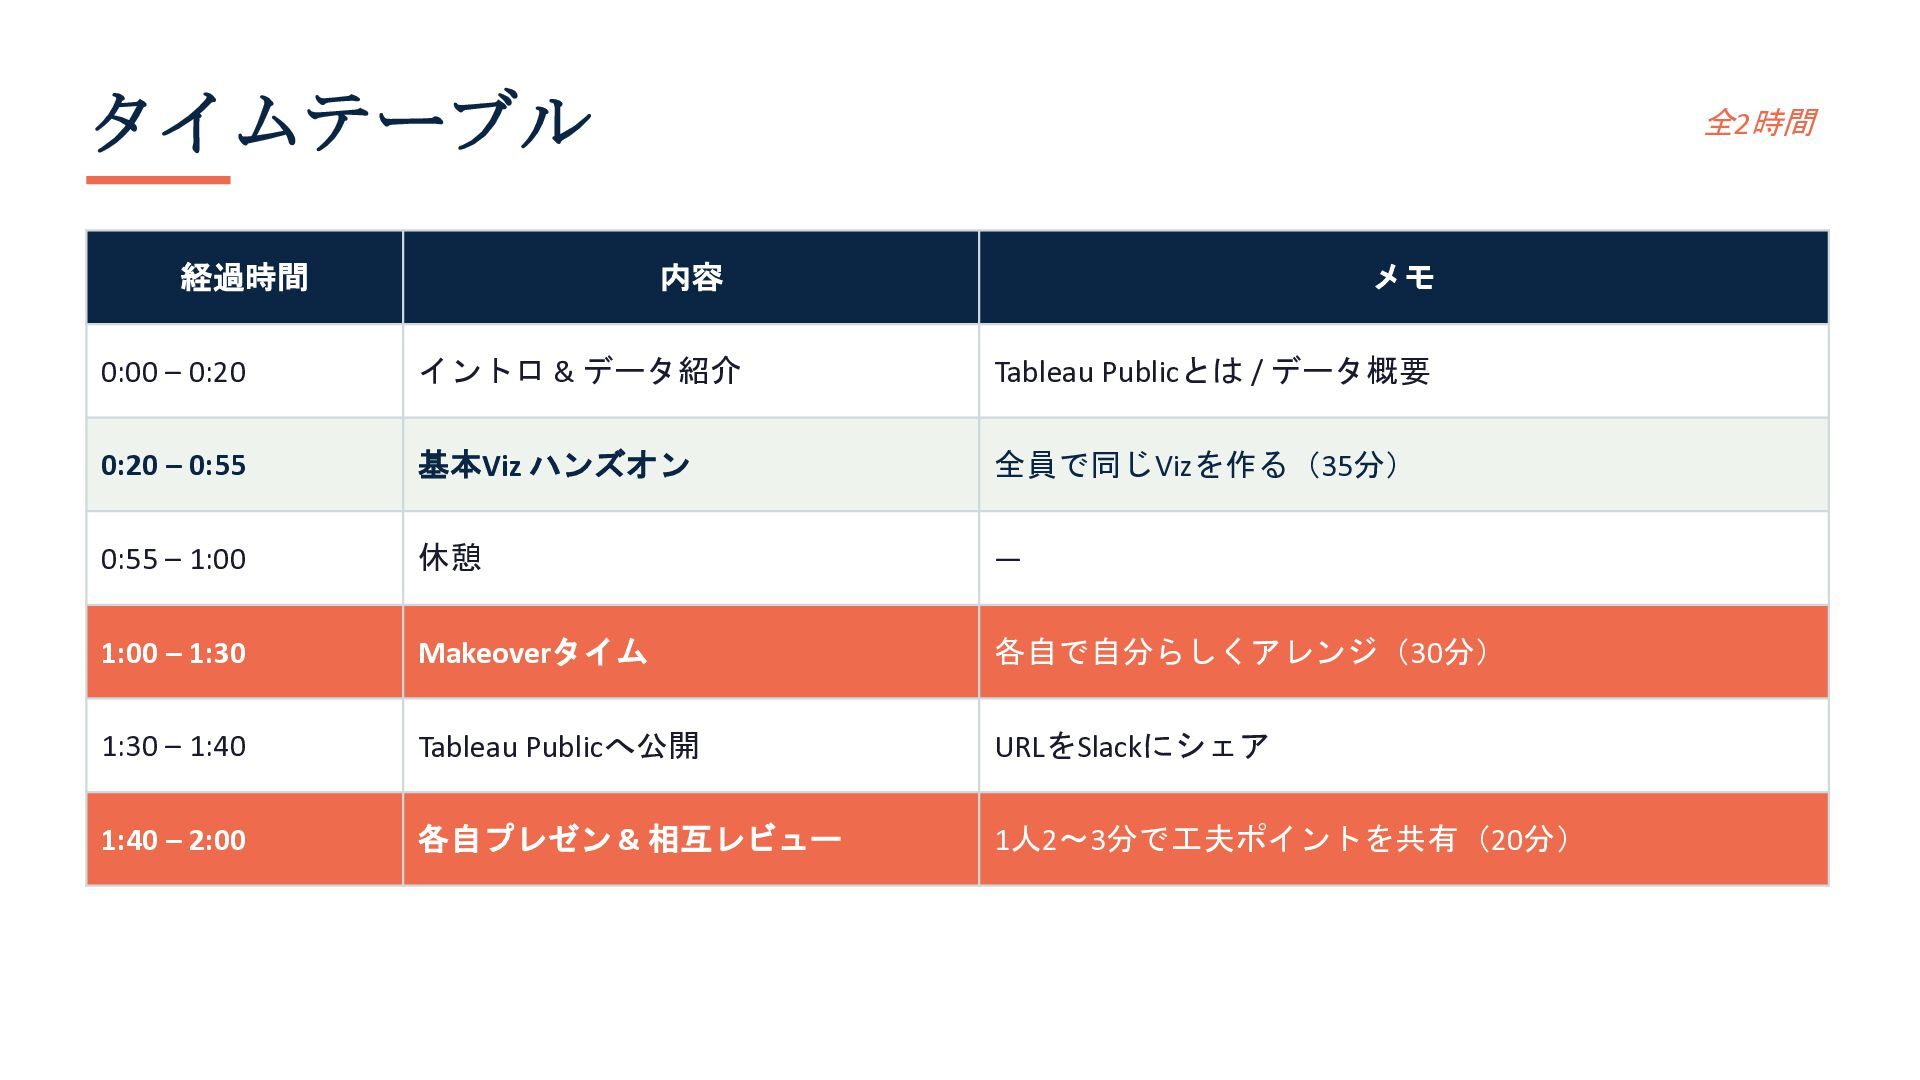
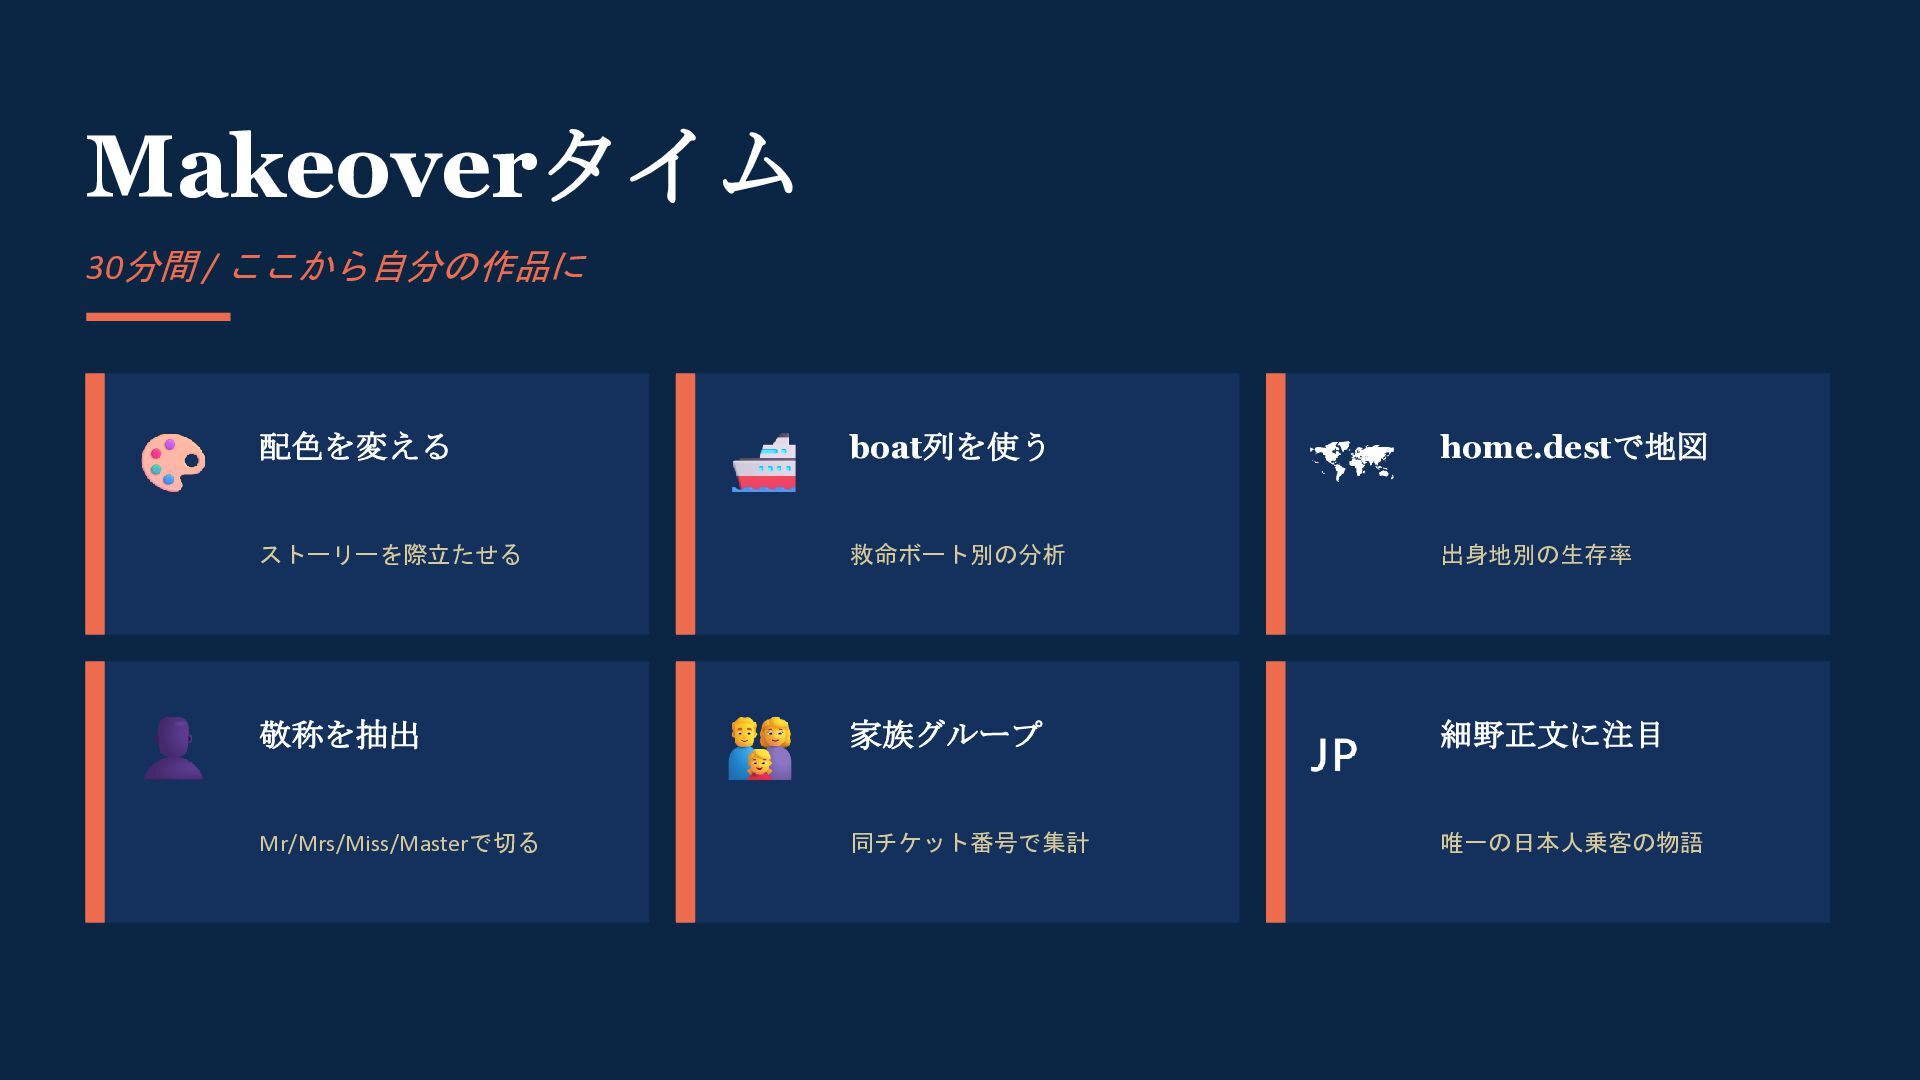
データの取得からViz作成、ダッシュボード構築、Tableau Publicへの公開までを一気通貫で扱います。「全員で同じ基本Vizを作る → 各自で自由にMakeover → 公開してプレゼン」というMakeover方式で、同じデータから一人ひとり違うVizが生まれる体験を設計しました。
【内容】
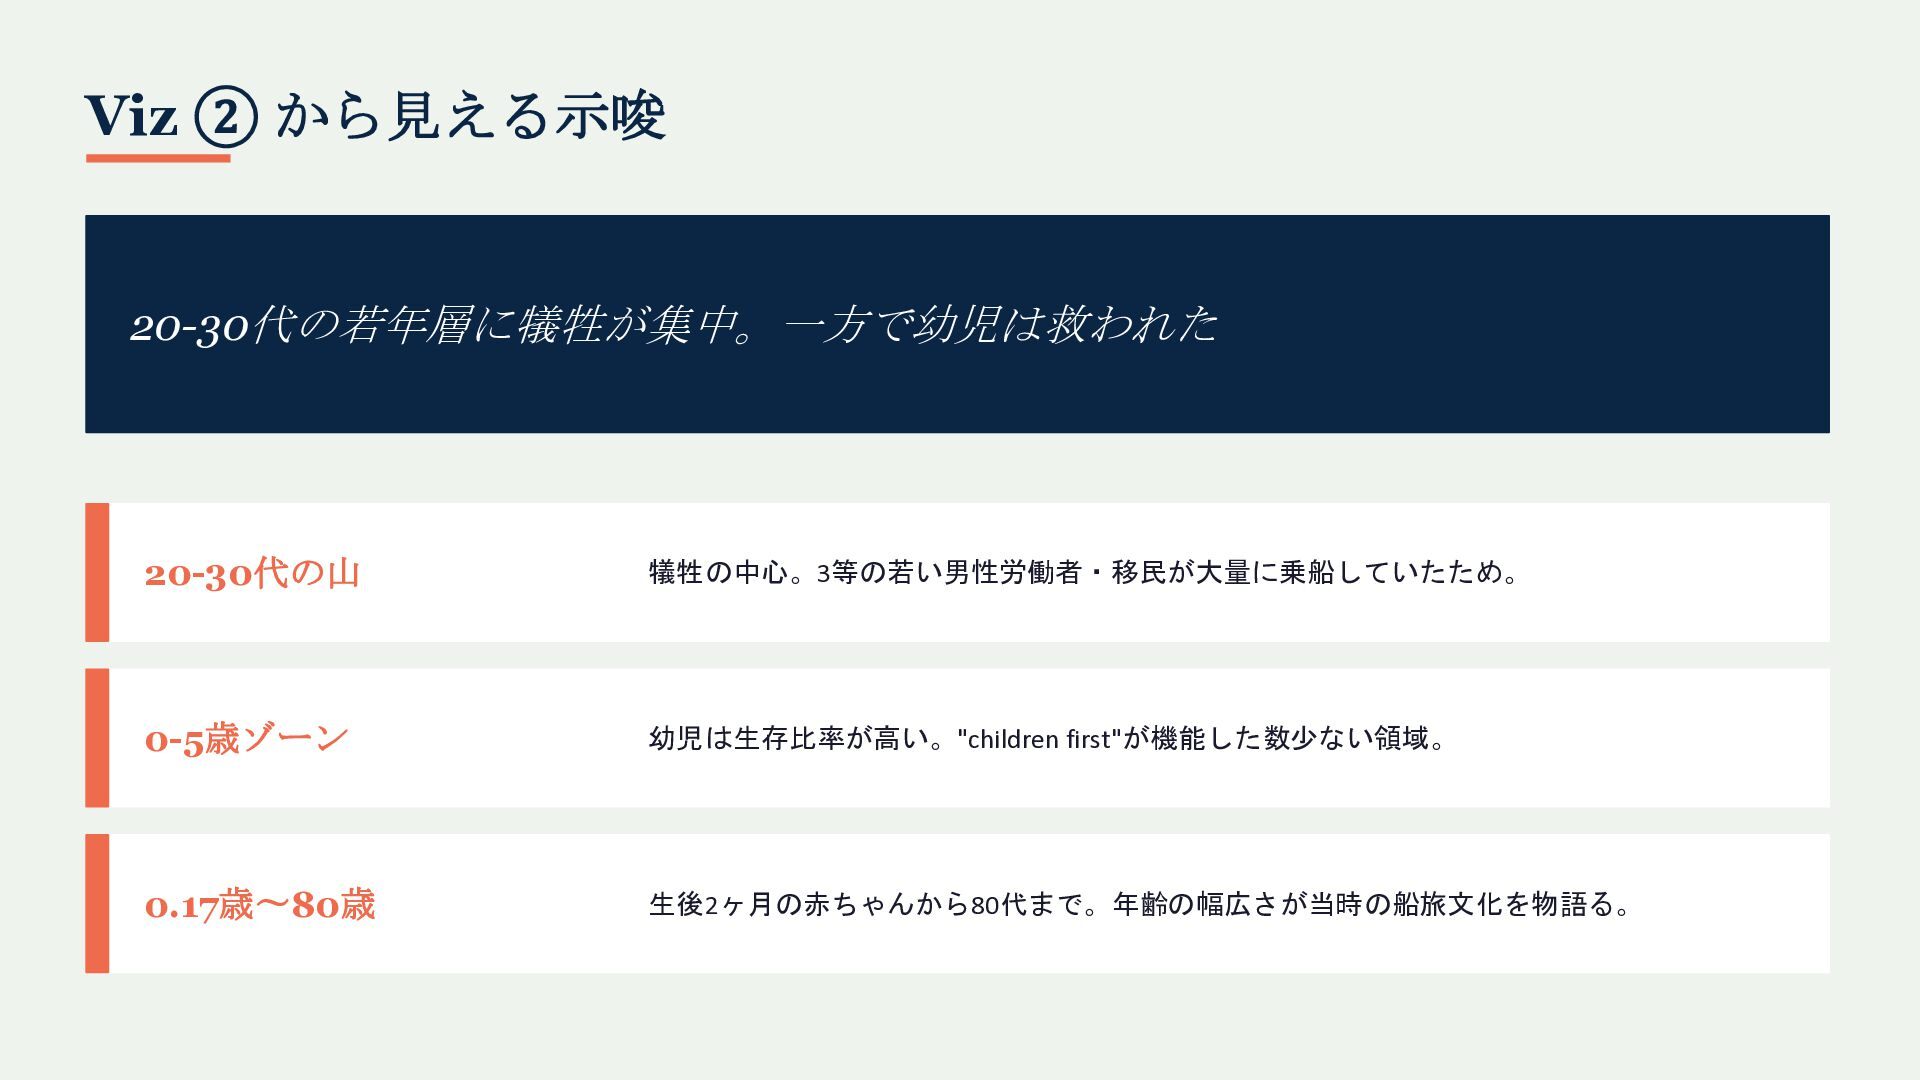
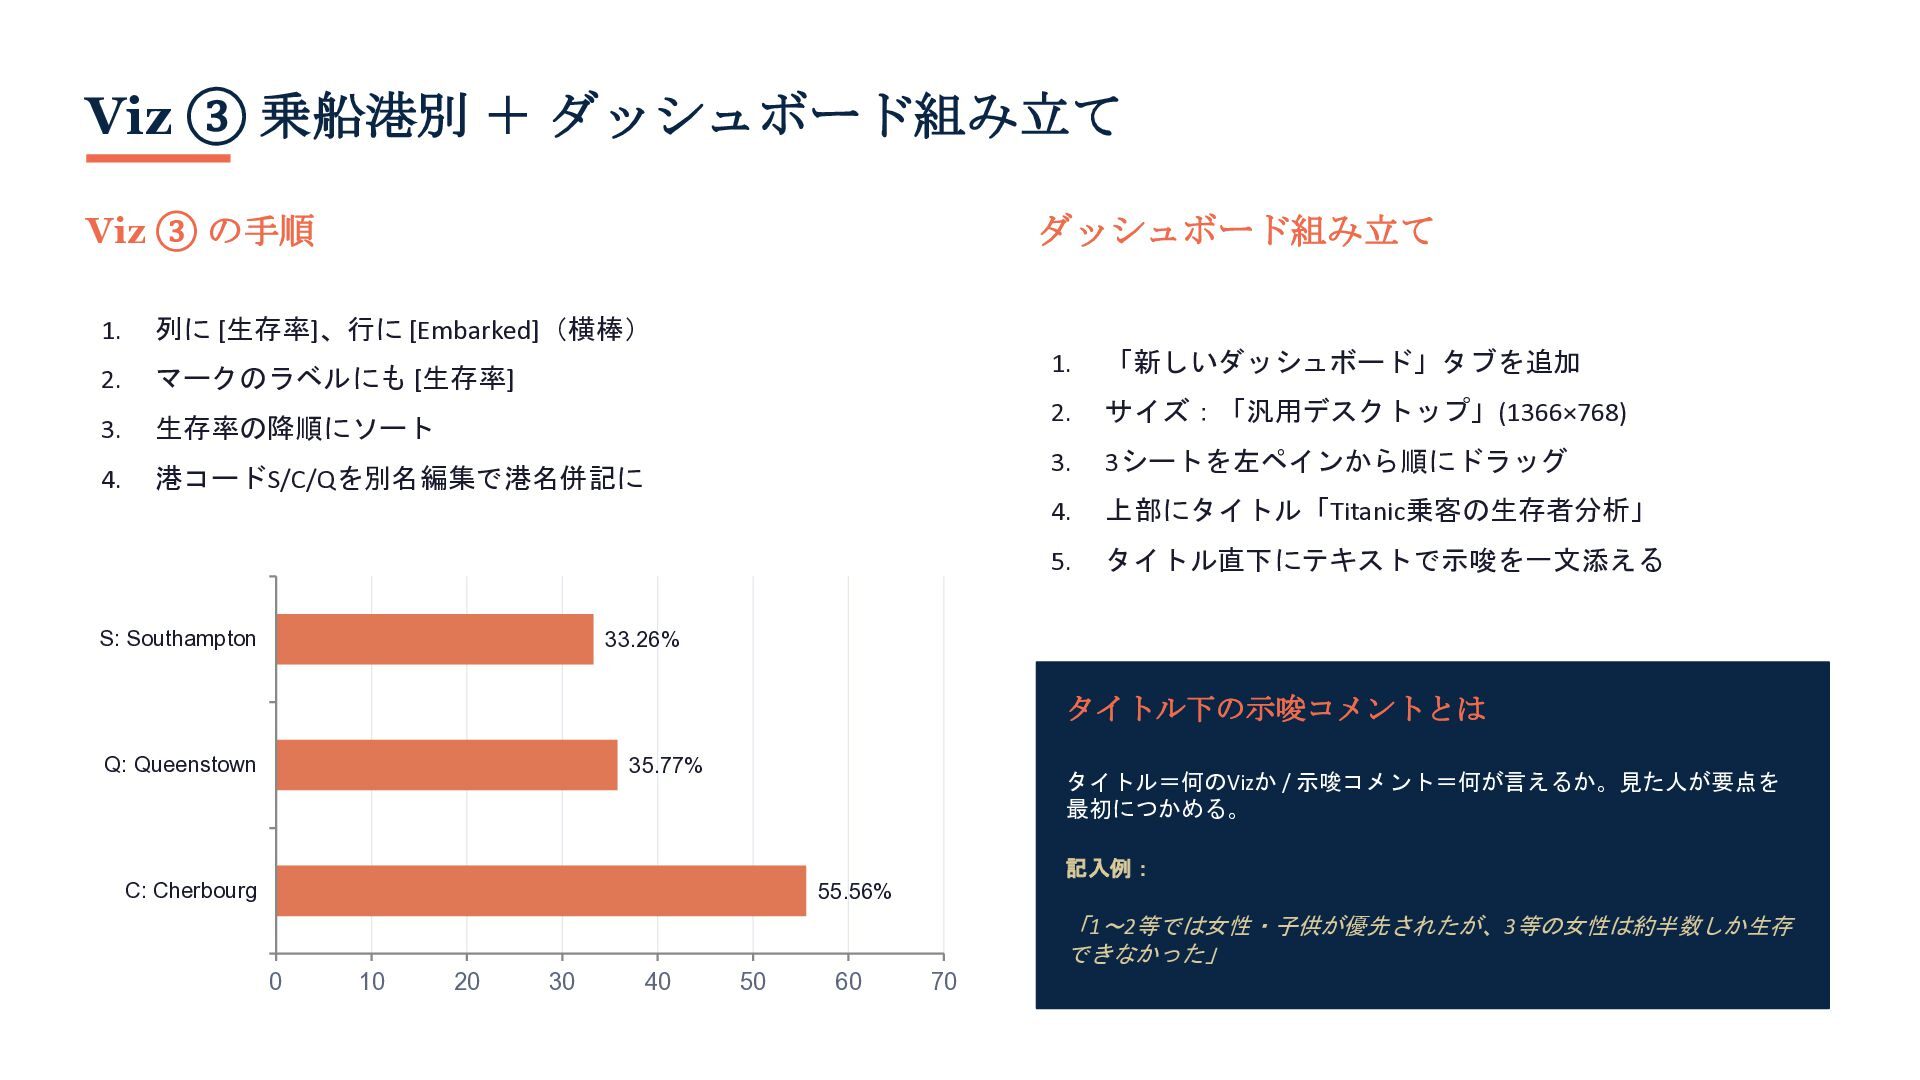
・基本Viz 3枚(クラス×性別の生存率マトリクス/年齢分布ヒストグラム/乗船港別生存率)の作成手順
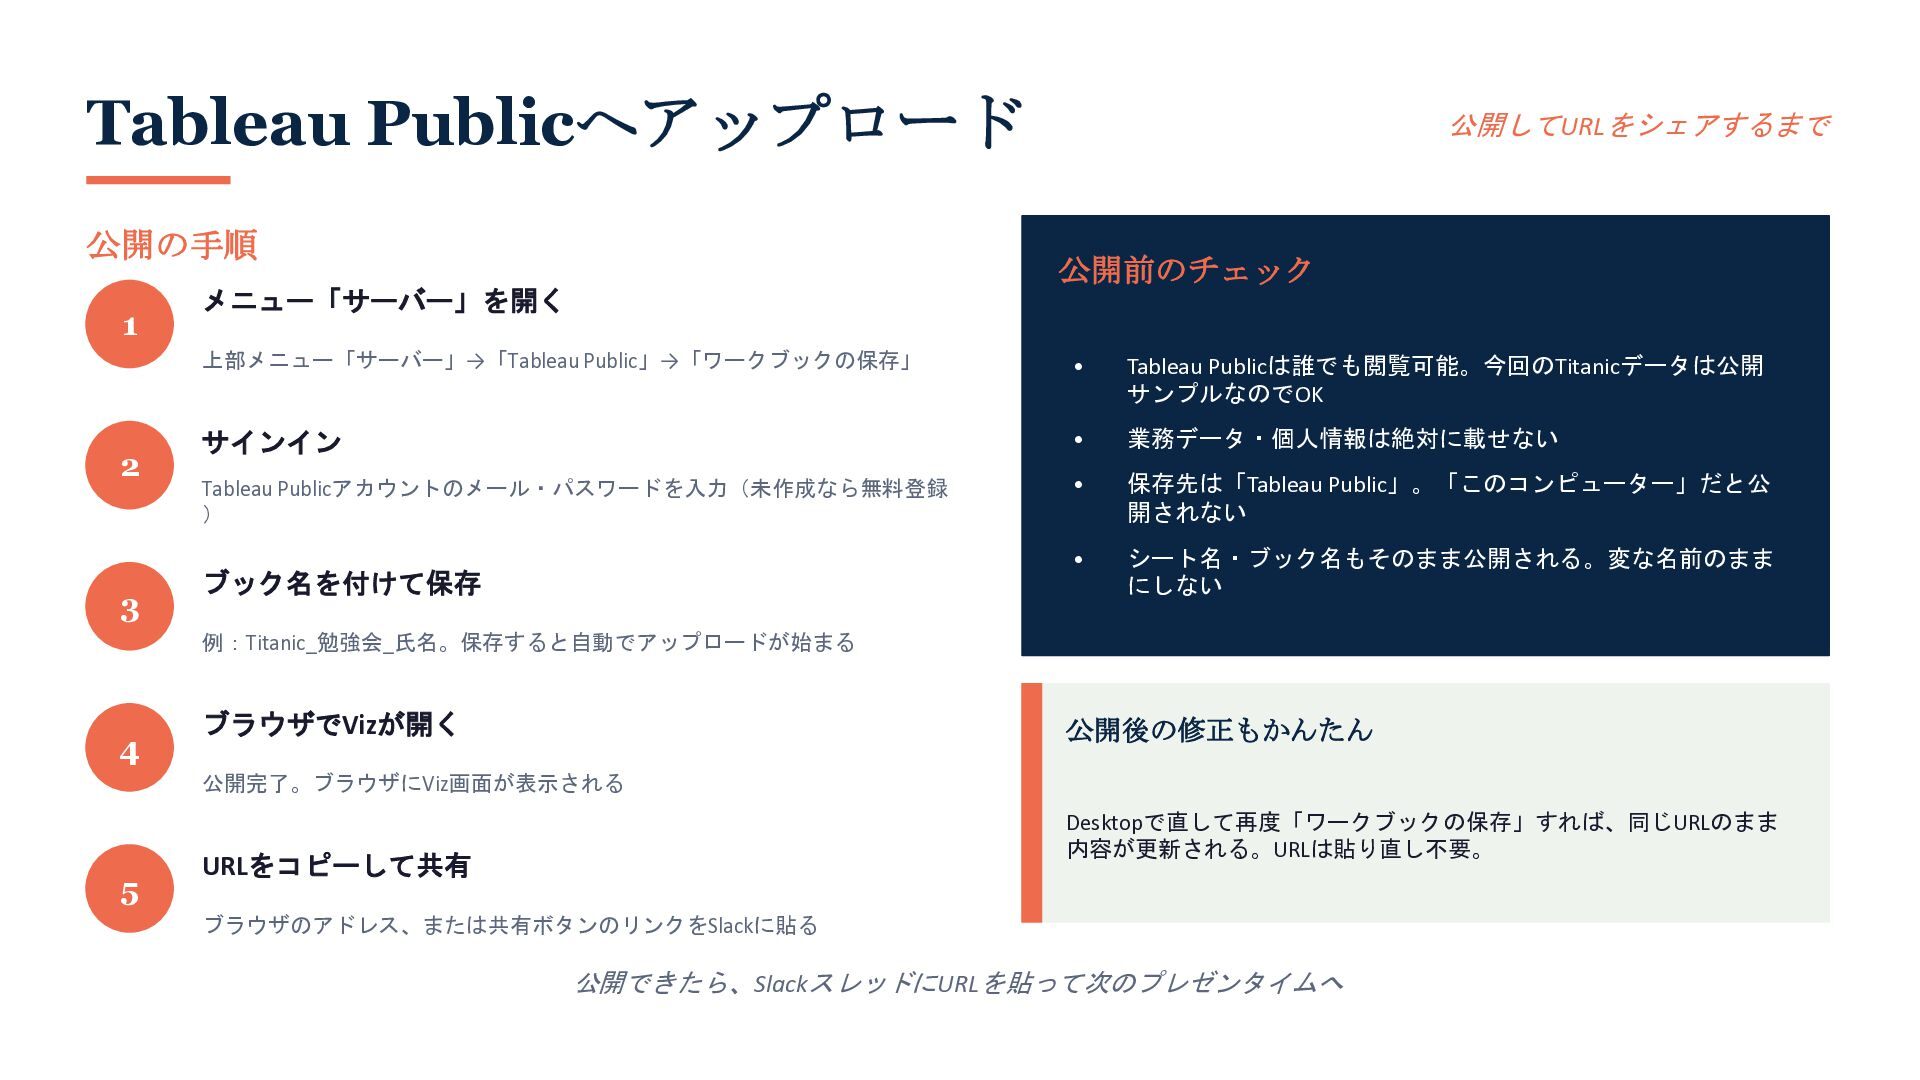
・ダッシュボードの組み立てとTableau Publicへの公開方法
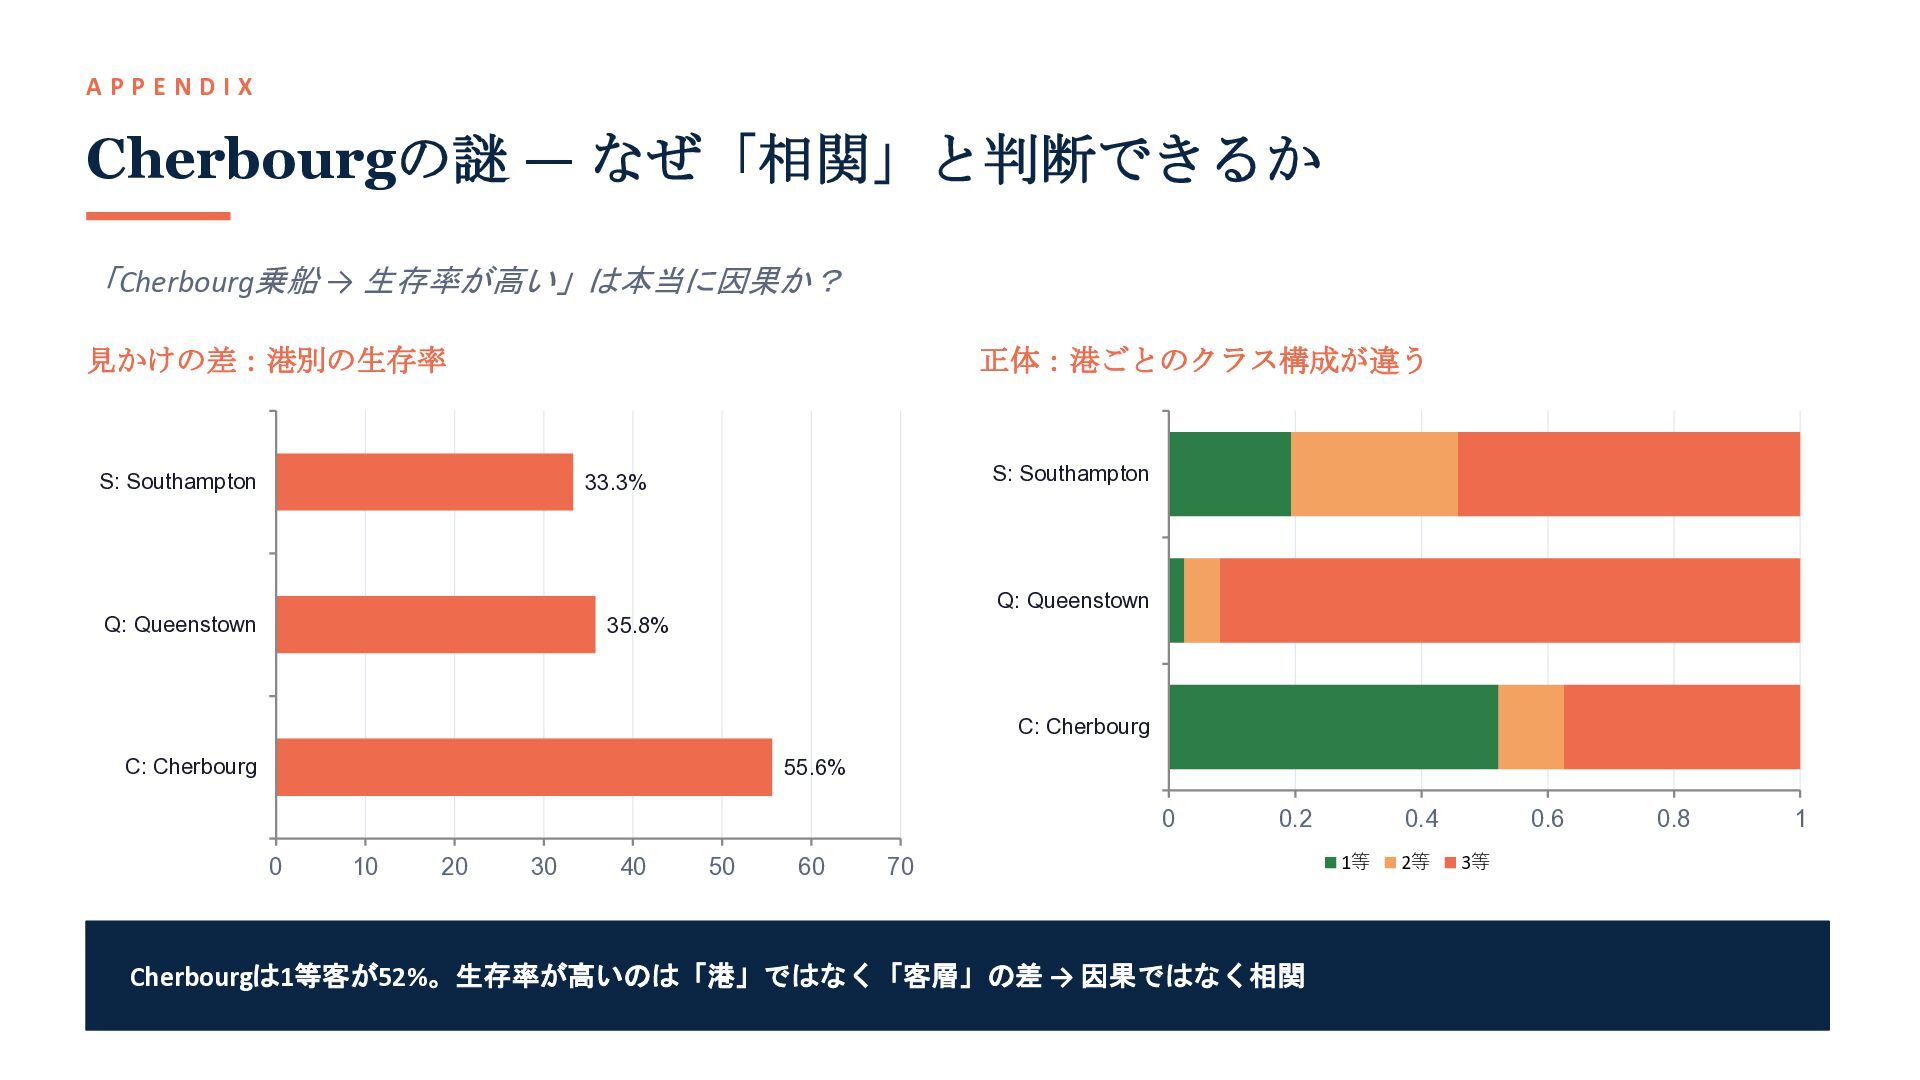
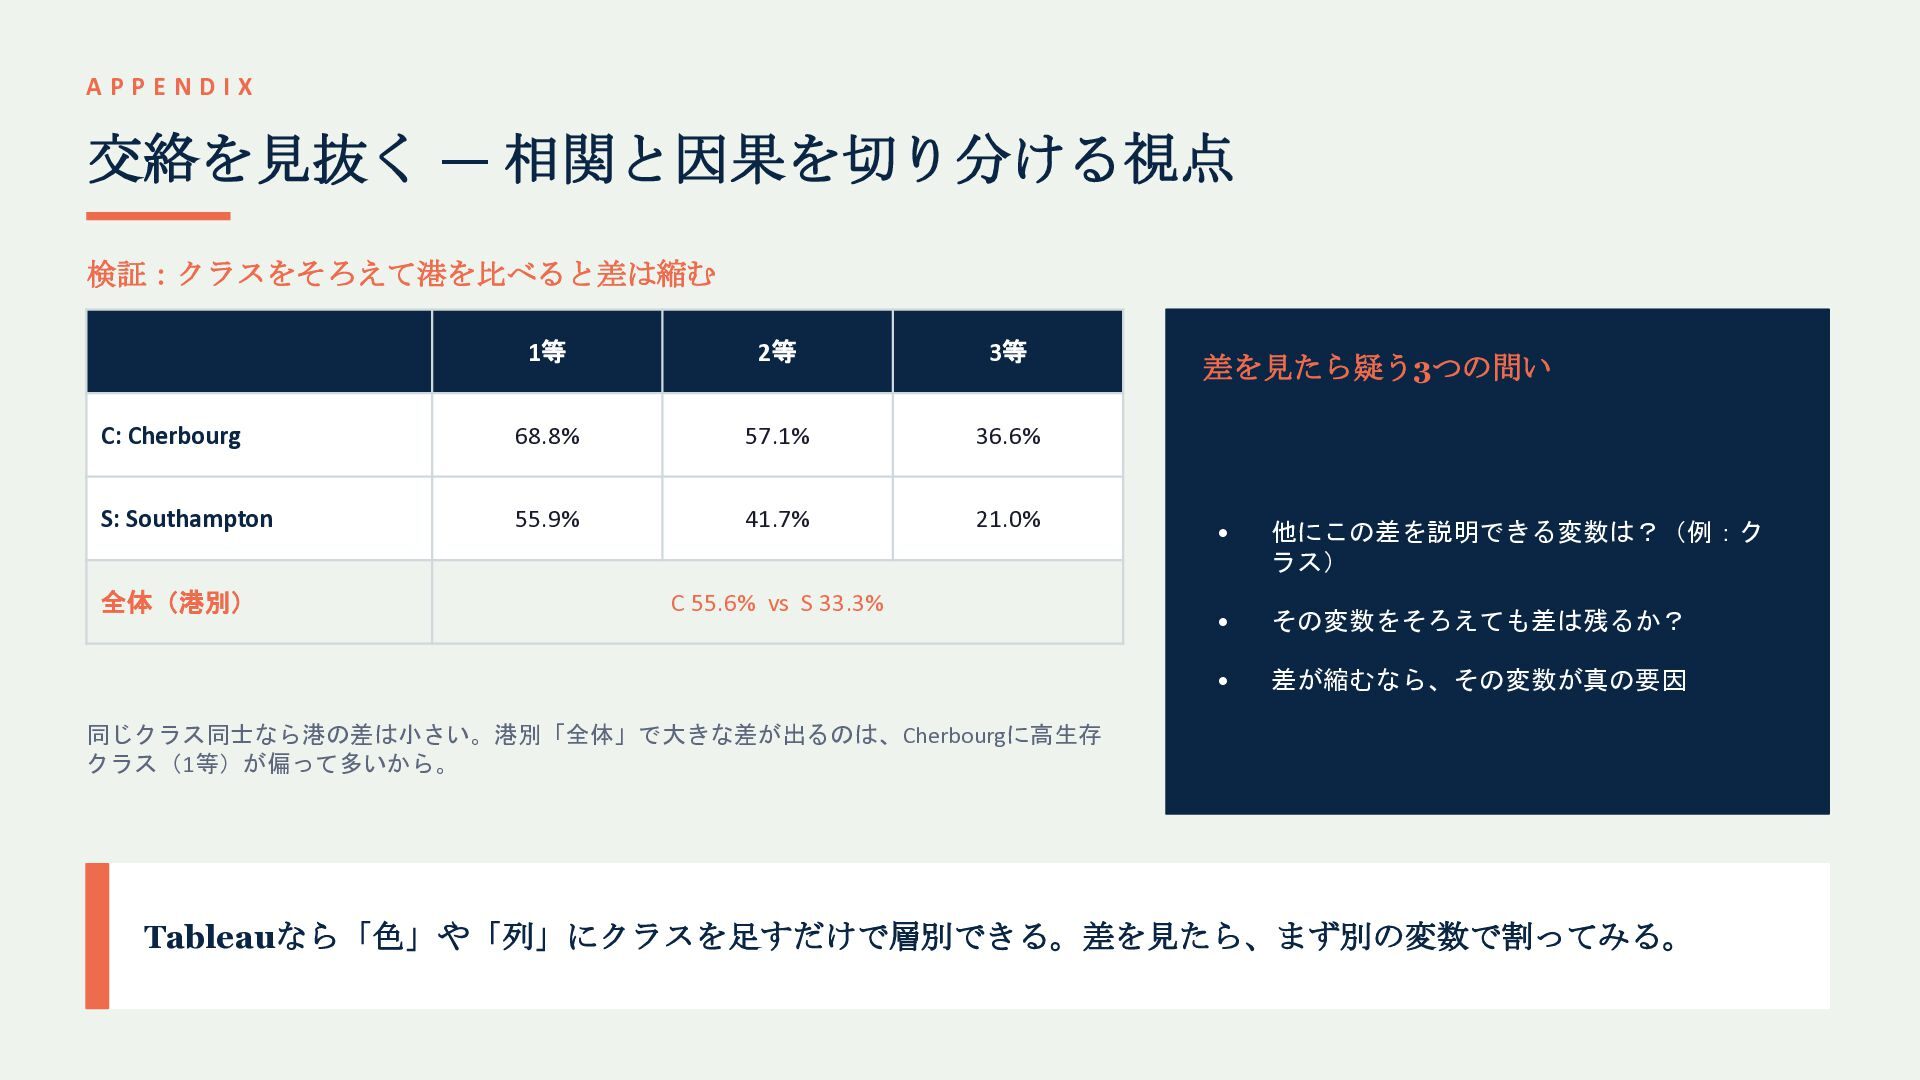
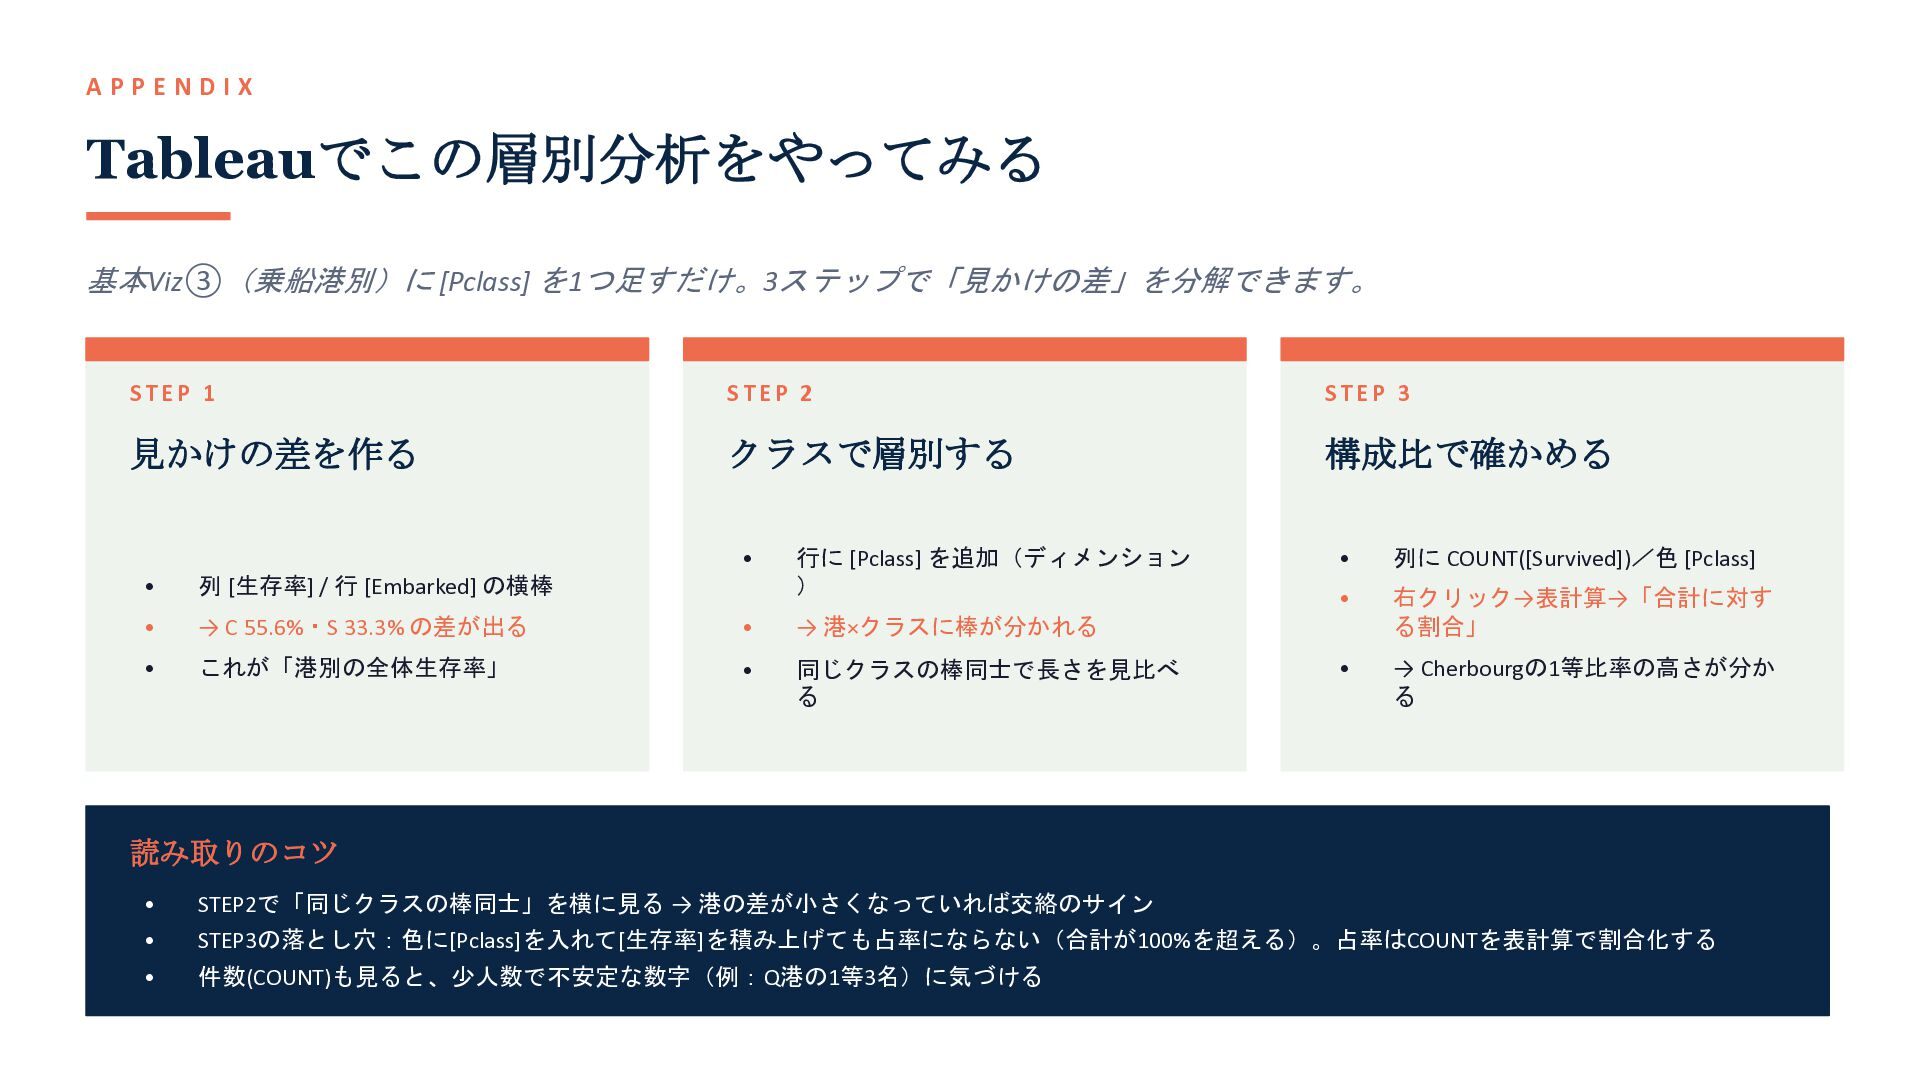
・Appendix:乗船港別生存率の「相関と因果」を層別分析で読み解く
Tableau初心者〜中級者、Tableau PublicにVizを投稿してみたい方、DATA Saber取得を目指す方におすすめです。
===
Please note: the slides themselves are written in Japanese.
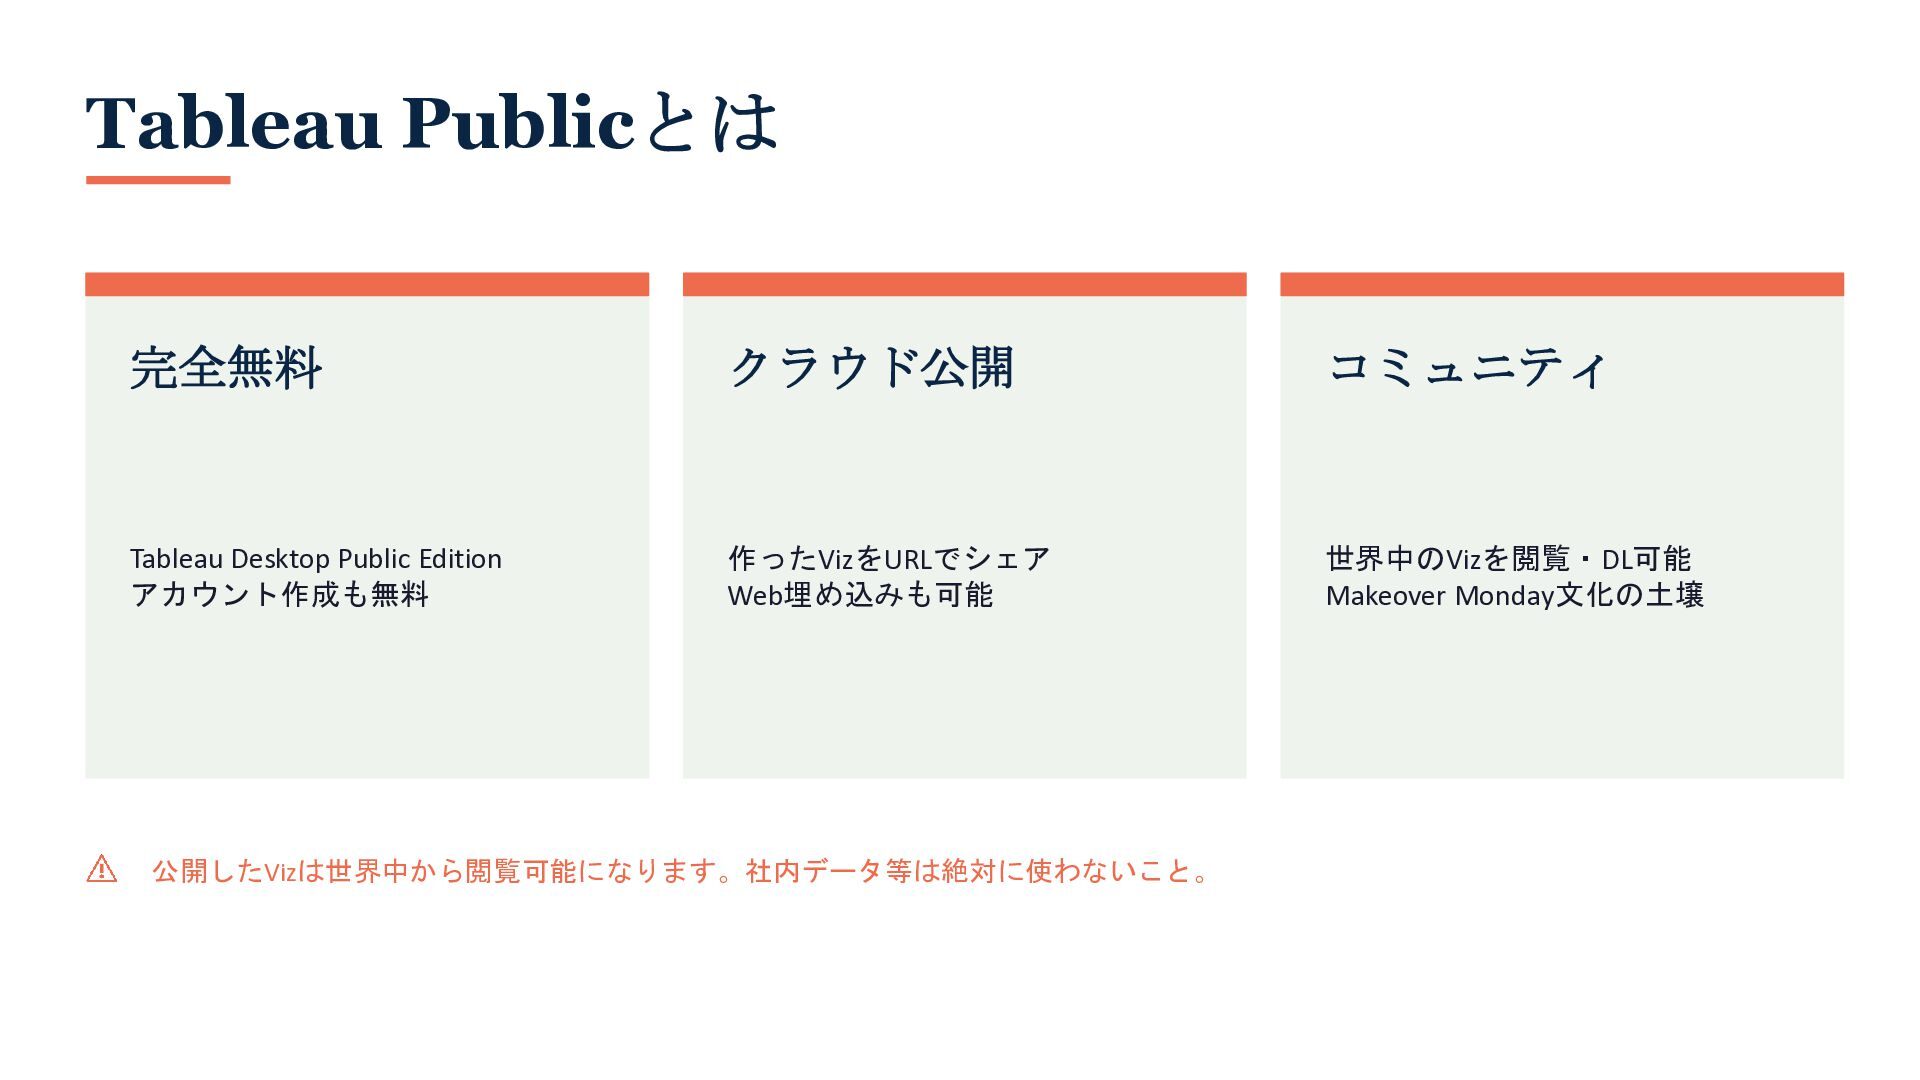
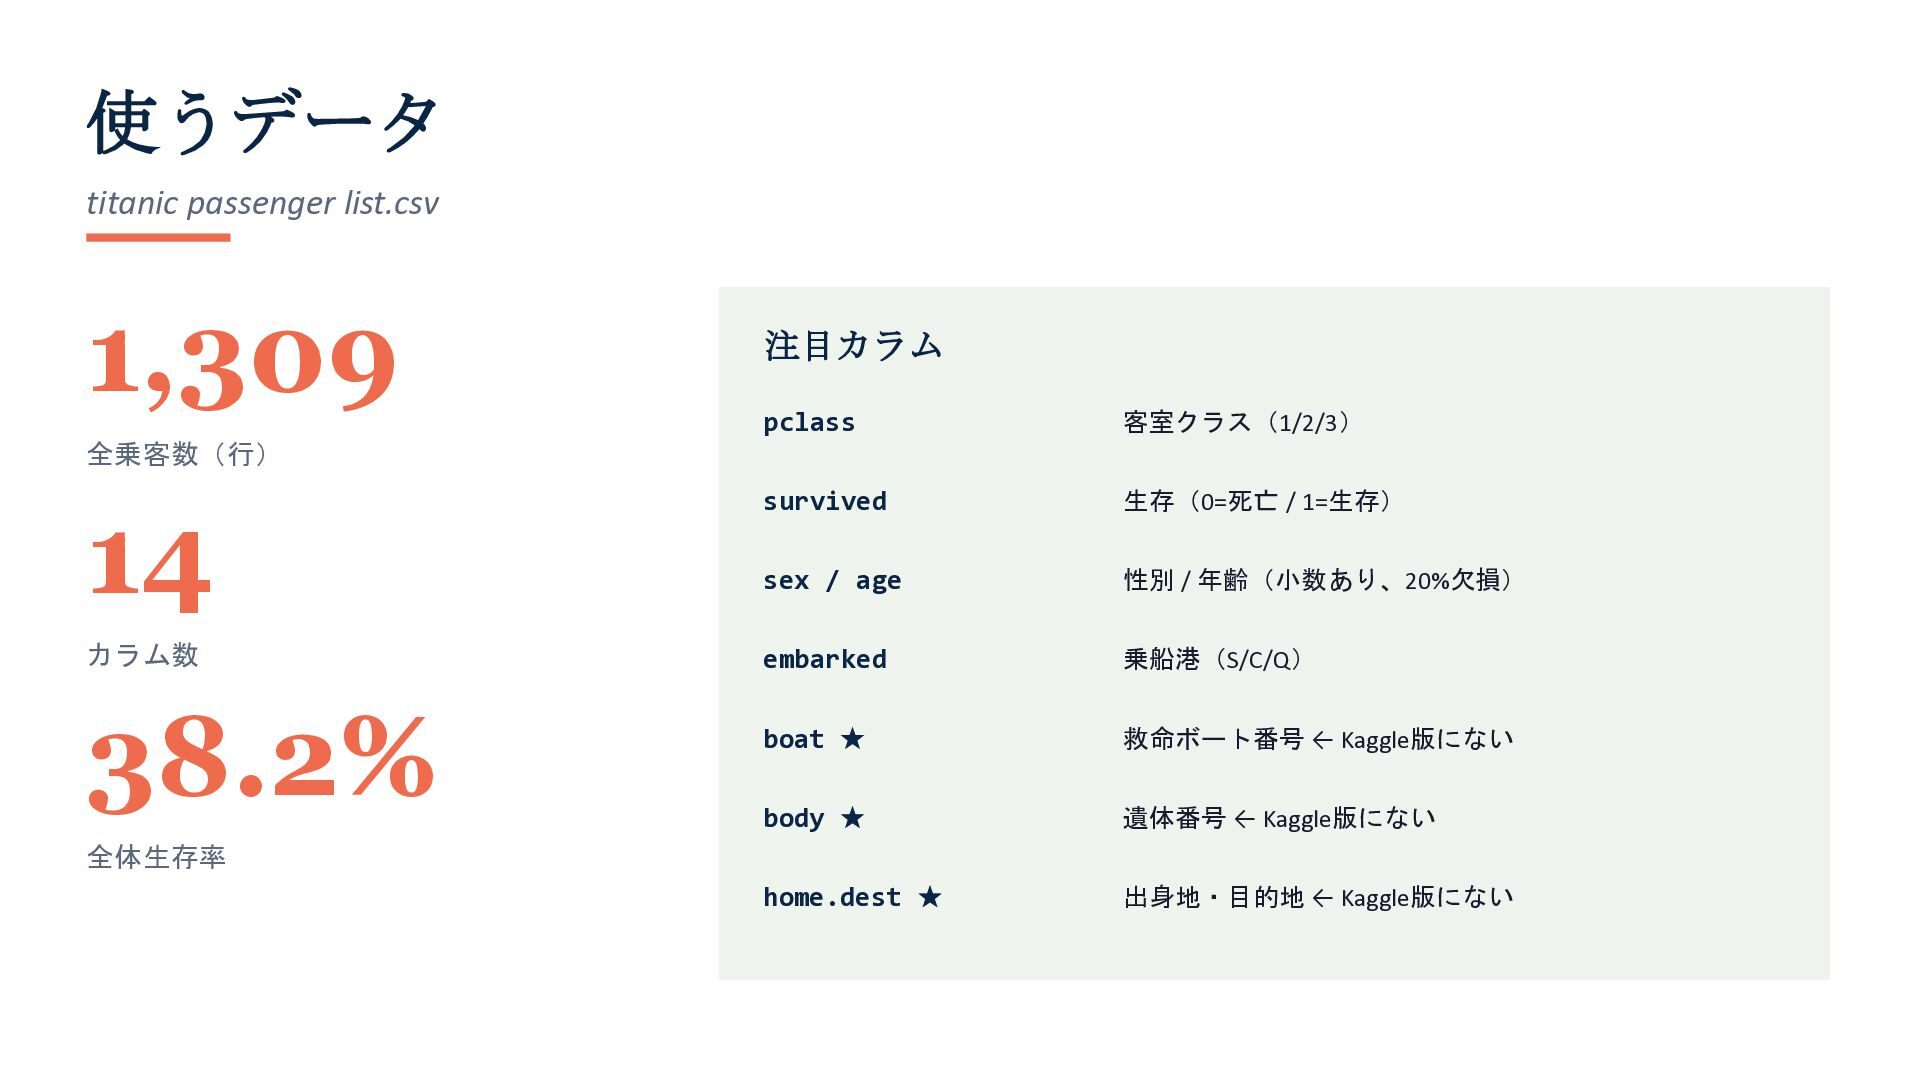
This is the presentation deck for a 2-hour hands-on Tableau workshop, based on the "Titanic Passenger List" (1,309 passenger records) from Tableau Public's official sample data.
It covers the entire workflow — from obtaining the data, to building Vizzes, assembling a dashboard, and publishing to Tableau Public. The session follows a "Makeover" format: everyone first builds the same basic Viz, then freely customizes it, and finally publishes and presents their own version. This design lets each participant create a distinctly different Viz from the very same dataset.
[Contents]
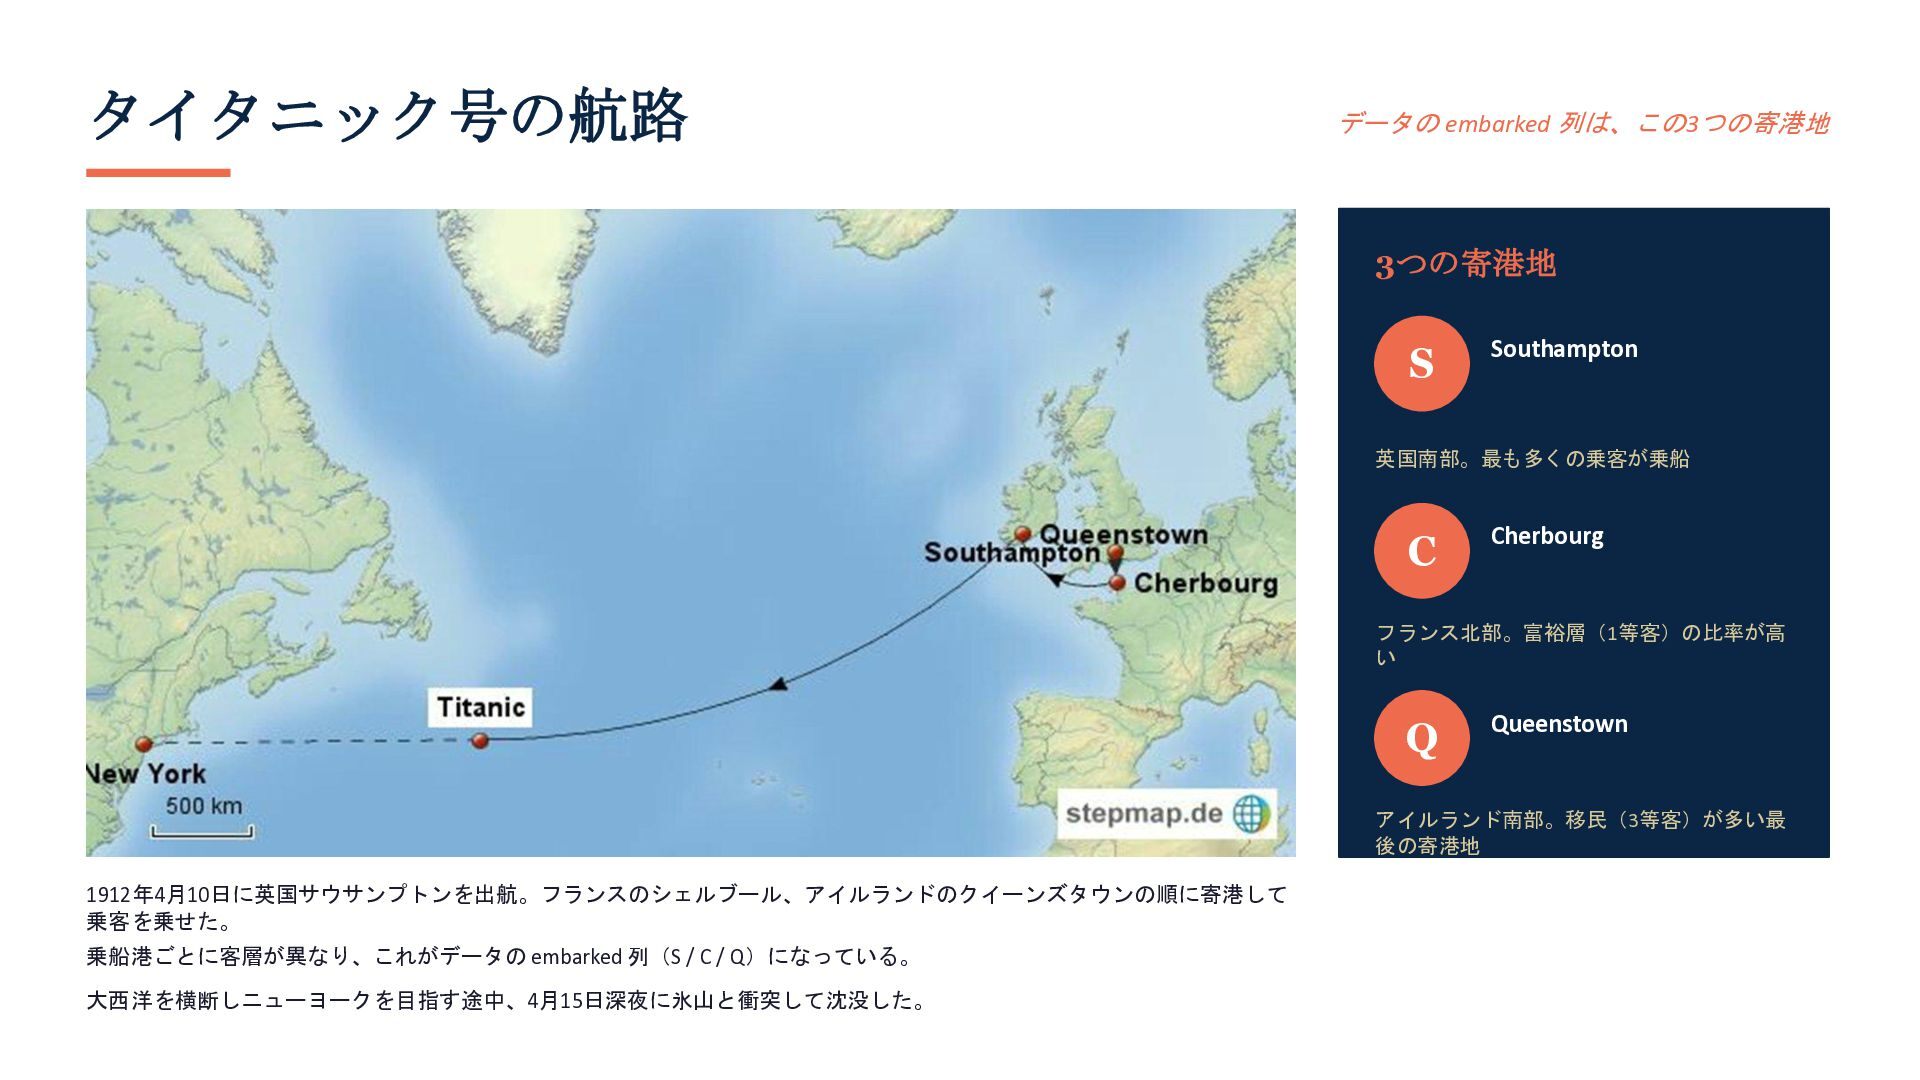
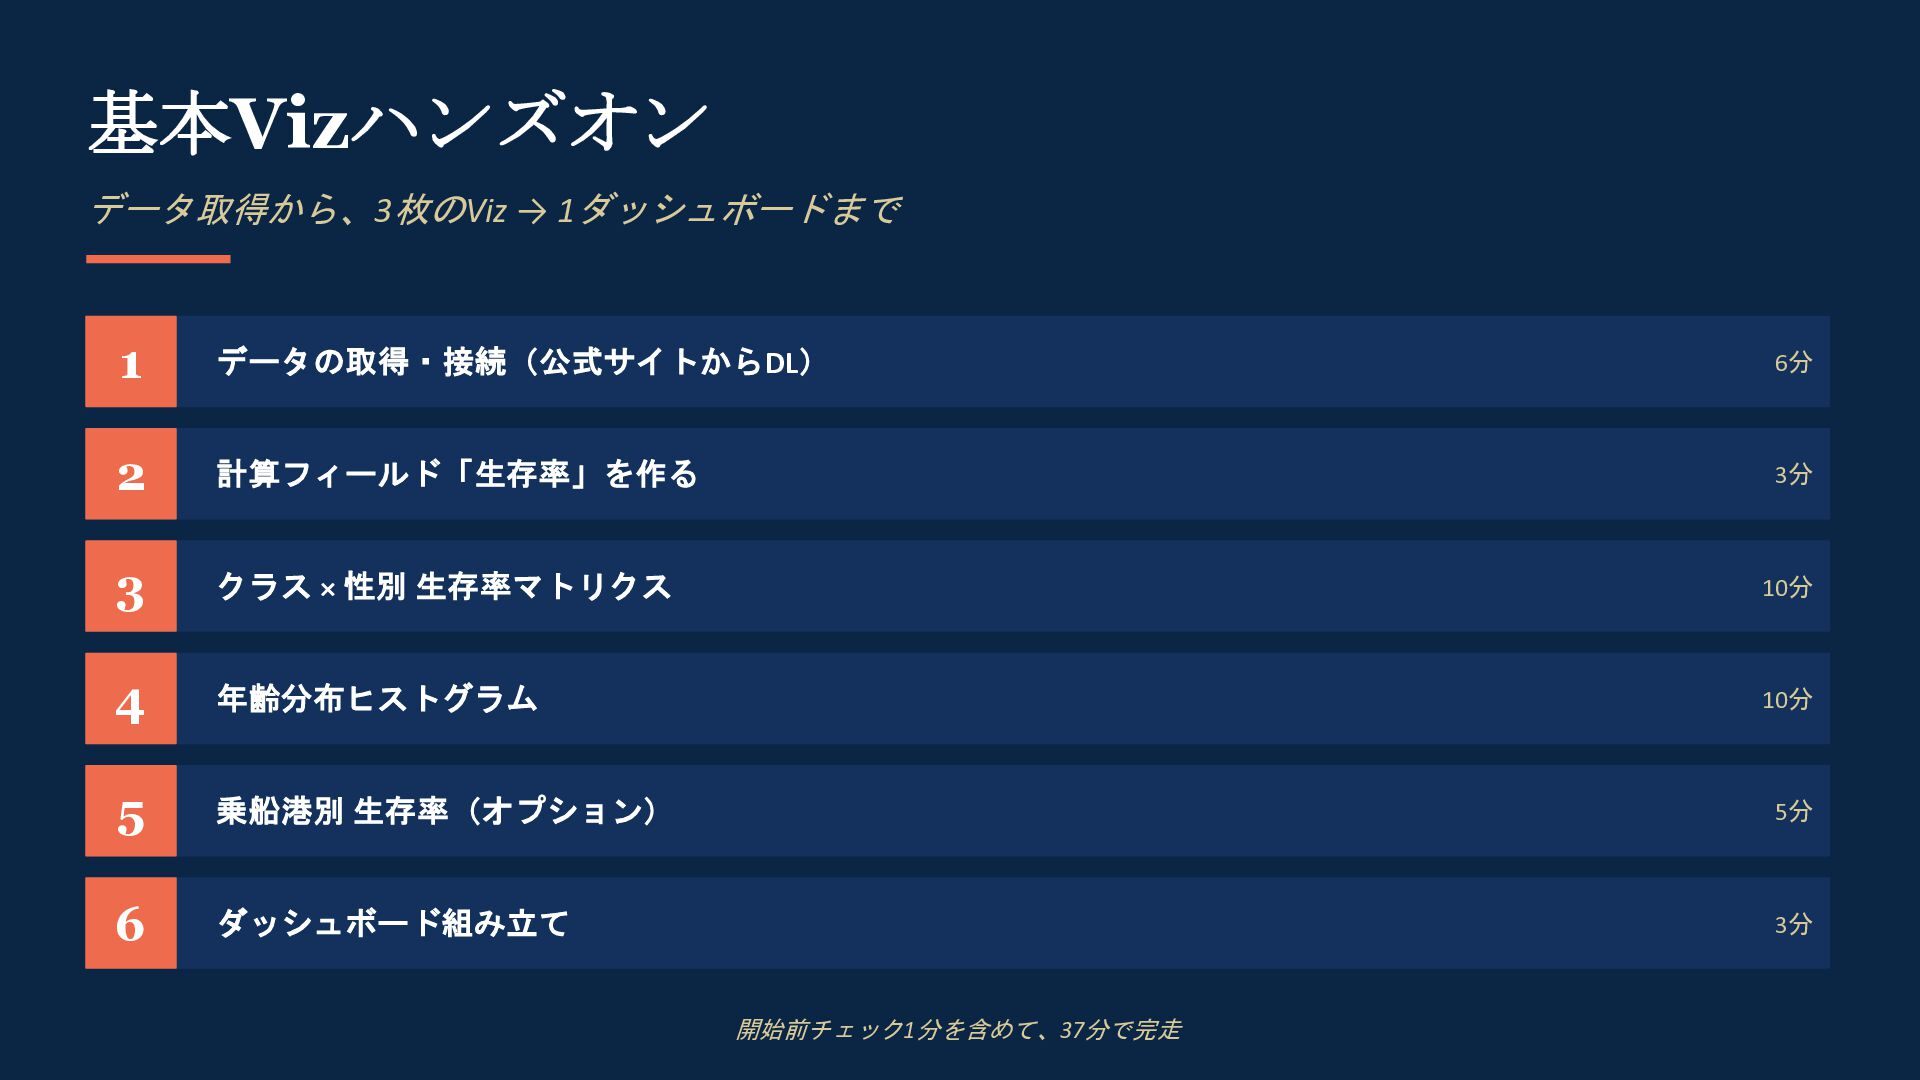
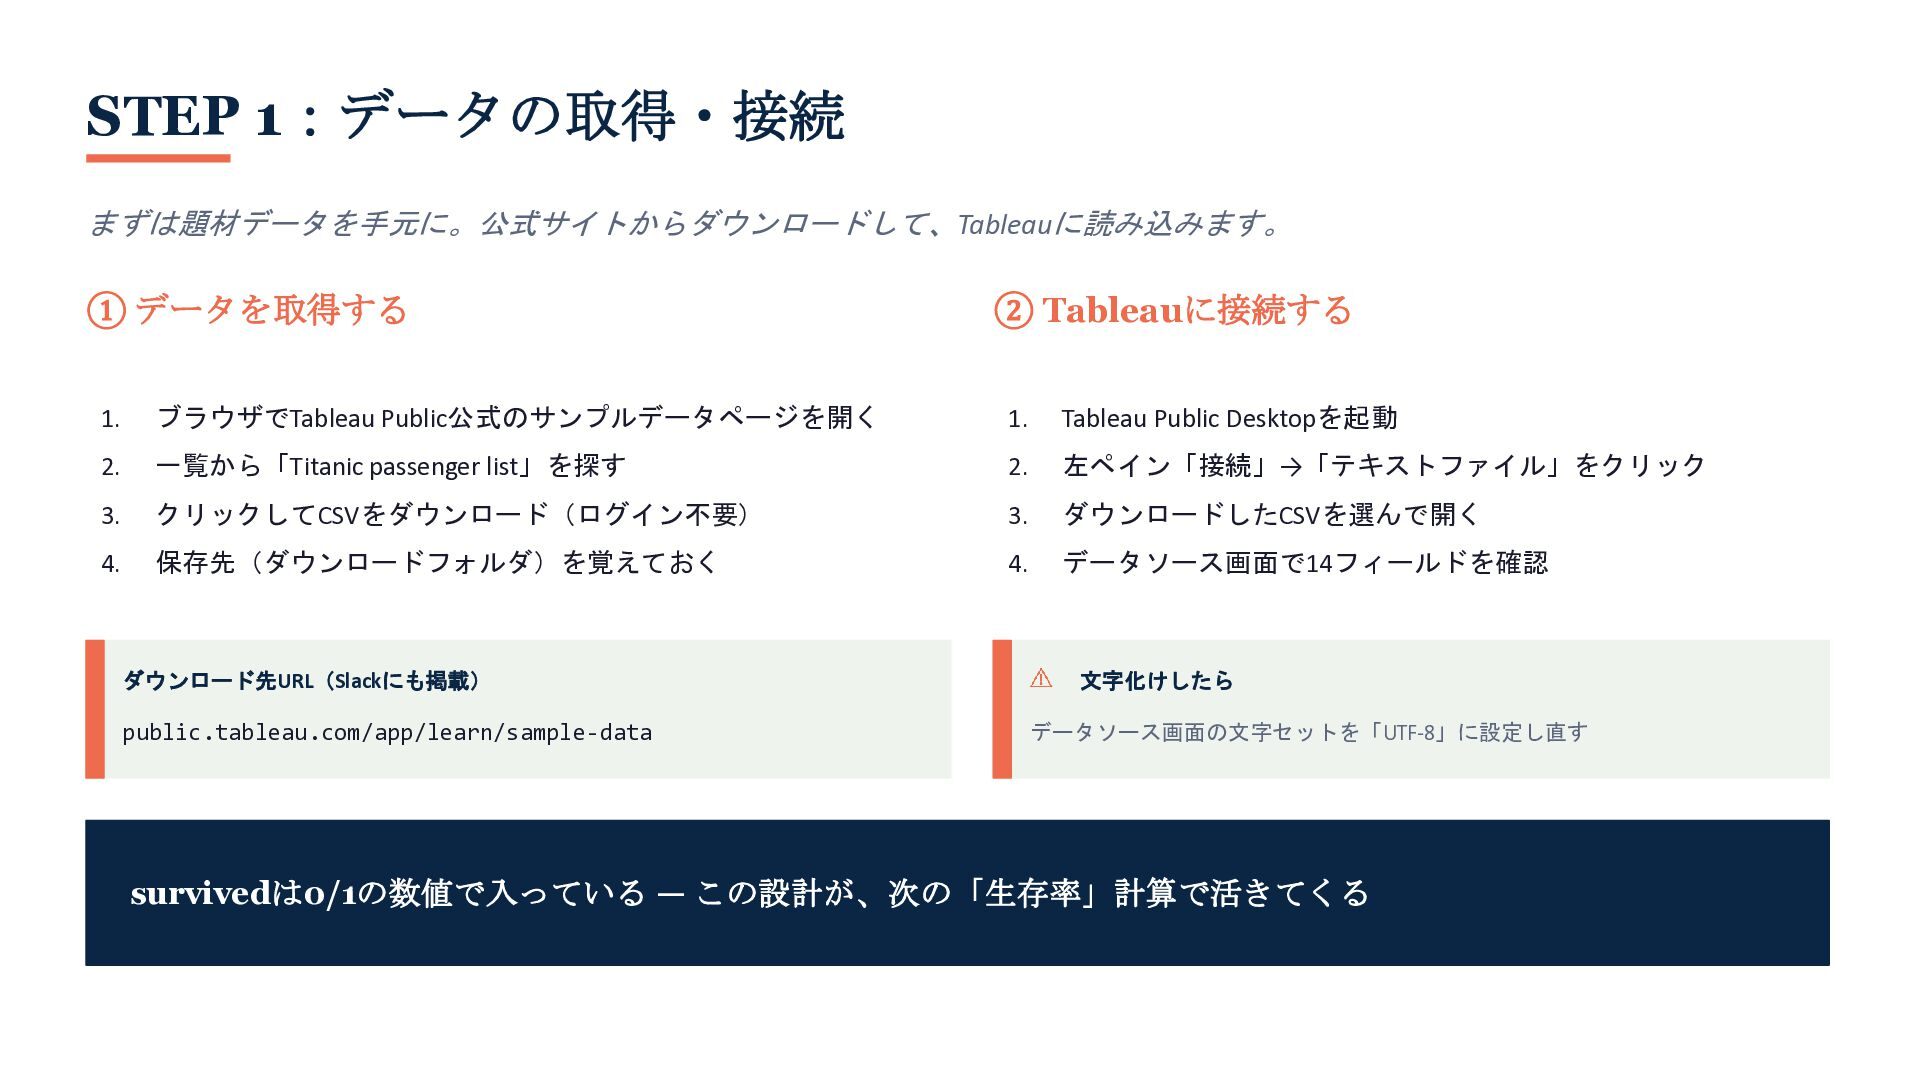
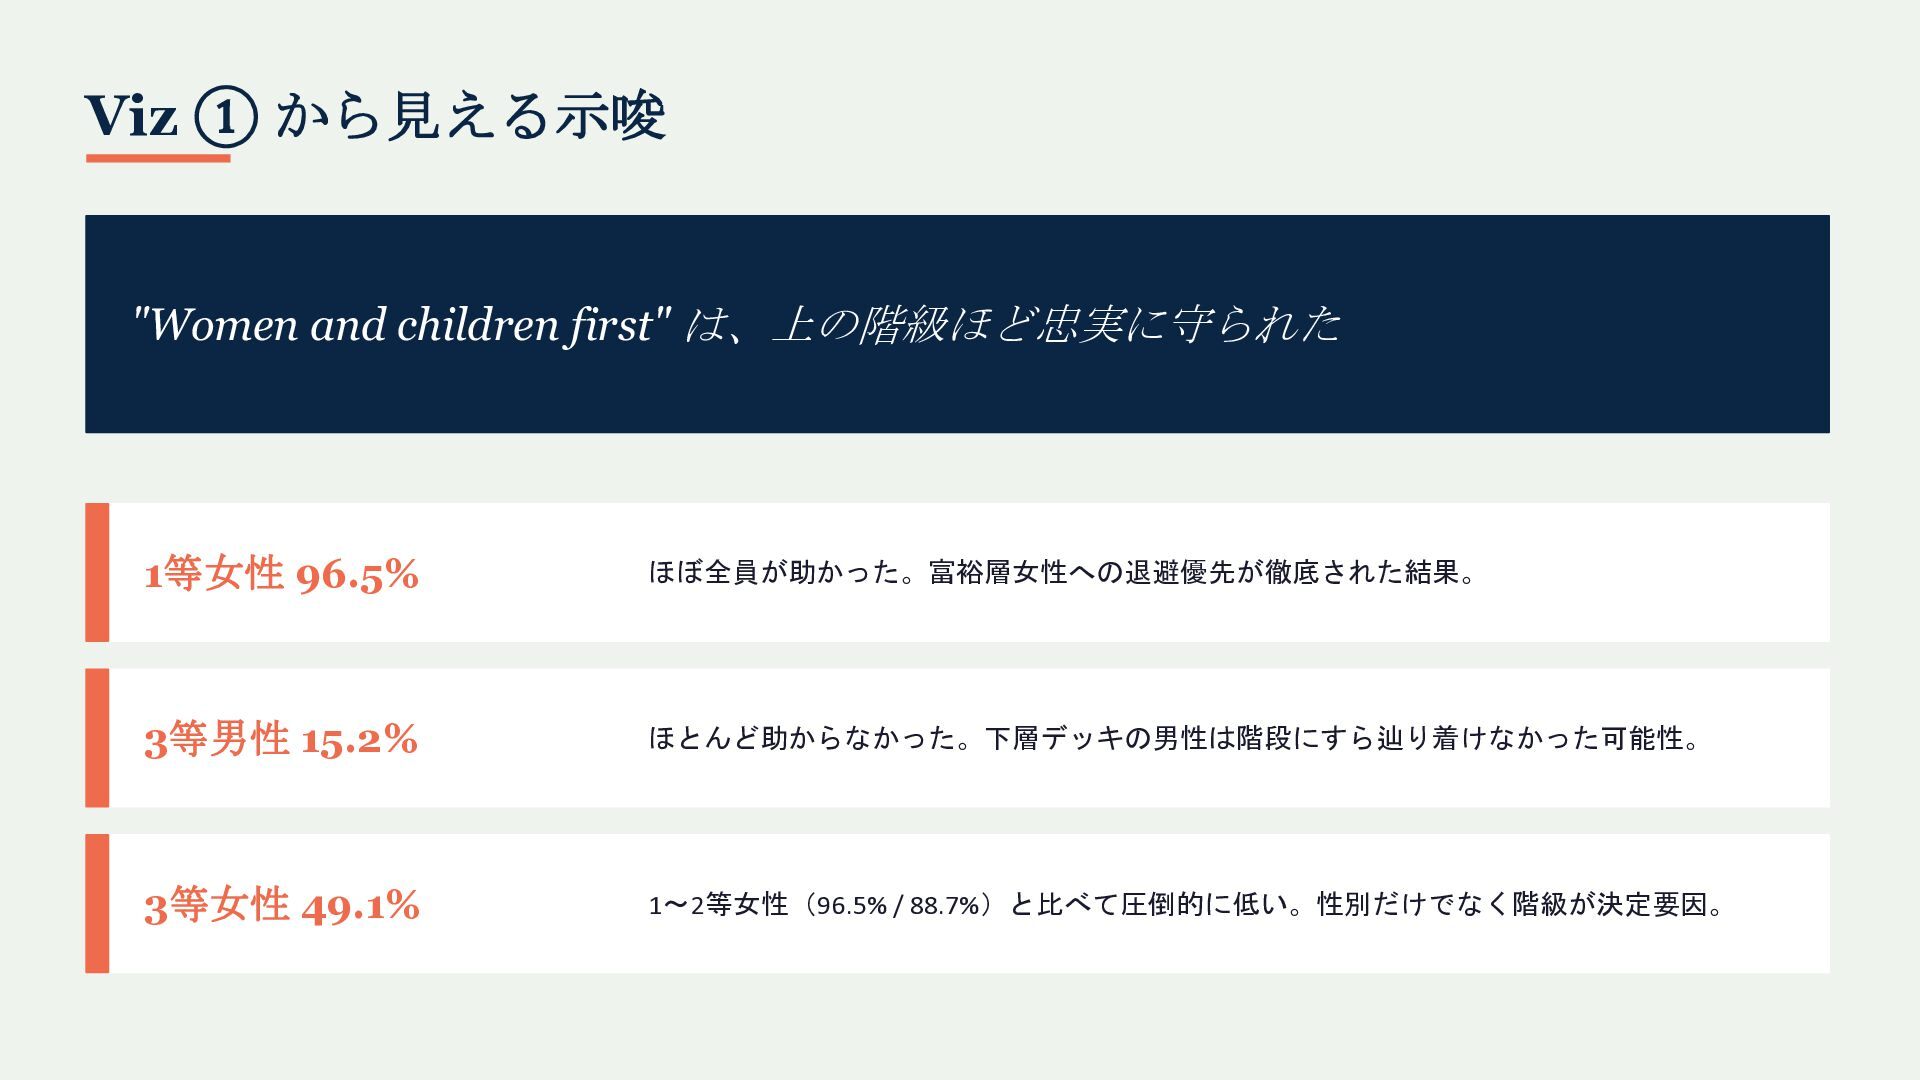
Step-by-step creation of 3 basic Vizzes (survival-rate matrix by class and sex / age-distribution histogram / survival rate by port of embarkation)
How to assemble a dashboard and publish it to Tableau Public
Appendix: reading "correlation vs. causation" in port-level survival rates through stratified analysis
Recommended for beginner-to-intermediate Tableau users, anyone wanting to publish a Viz on Tableau Public, and those working toward DATA Saber certification.
![Viz ① クラス × 性別 生存率マトリクス 手順 1. 計算フィールド「生存率」= AVG([Survived])](https://files.speakerdeck.com/presentations/cabe4edbe4f34675988b862407a3f906/slide_8.jpg)
![Viz ② 年齢分布ヒストグラム 手順 1. [Age] を右クリック →「作成」→「ビン」 2. ビンサイズ:5(0〜4歳,](https://files.speakerdeck.com/presentations/cabe4edbe4f34675988b862407a3f906/slide_10.jpg)