Tableau巣鴨会でLightning Talkをしました。
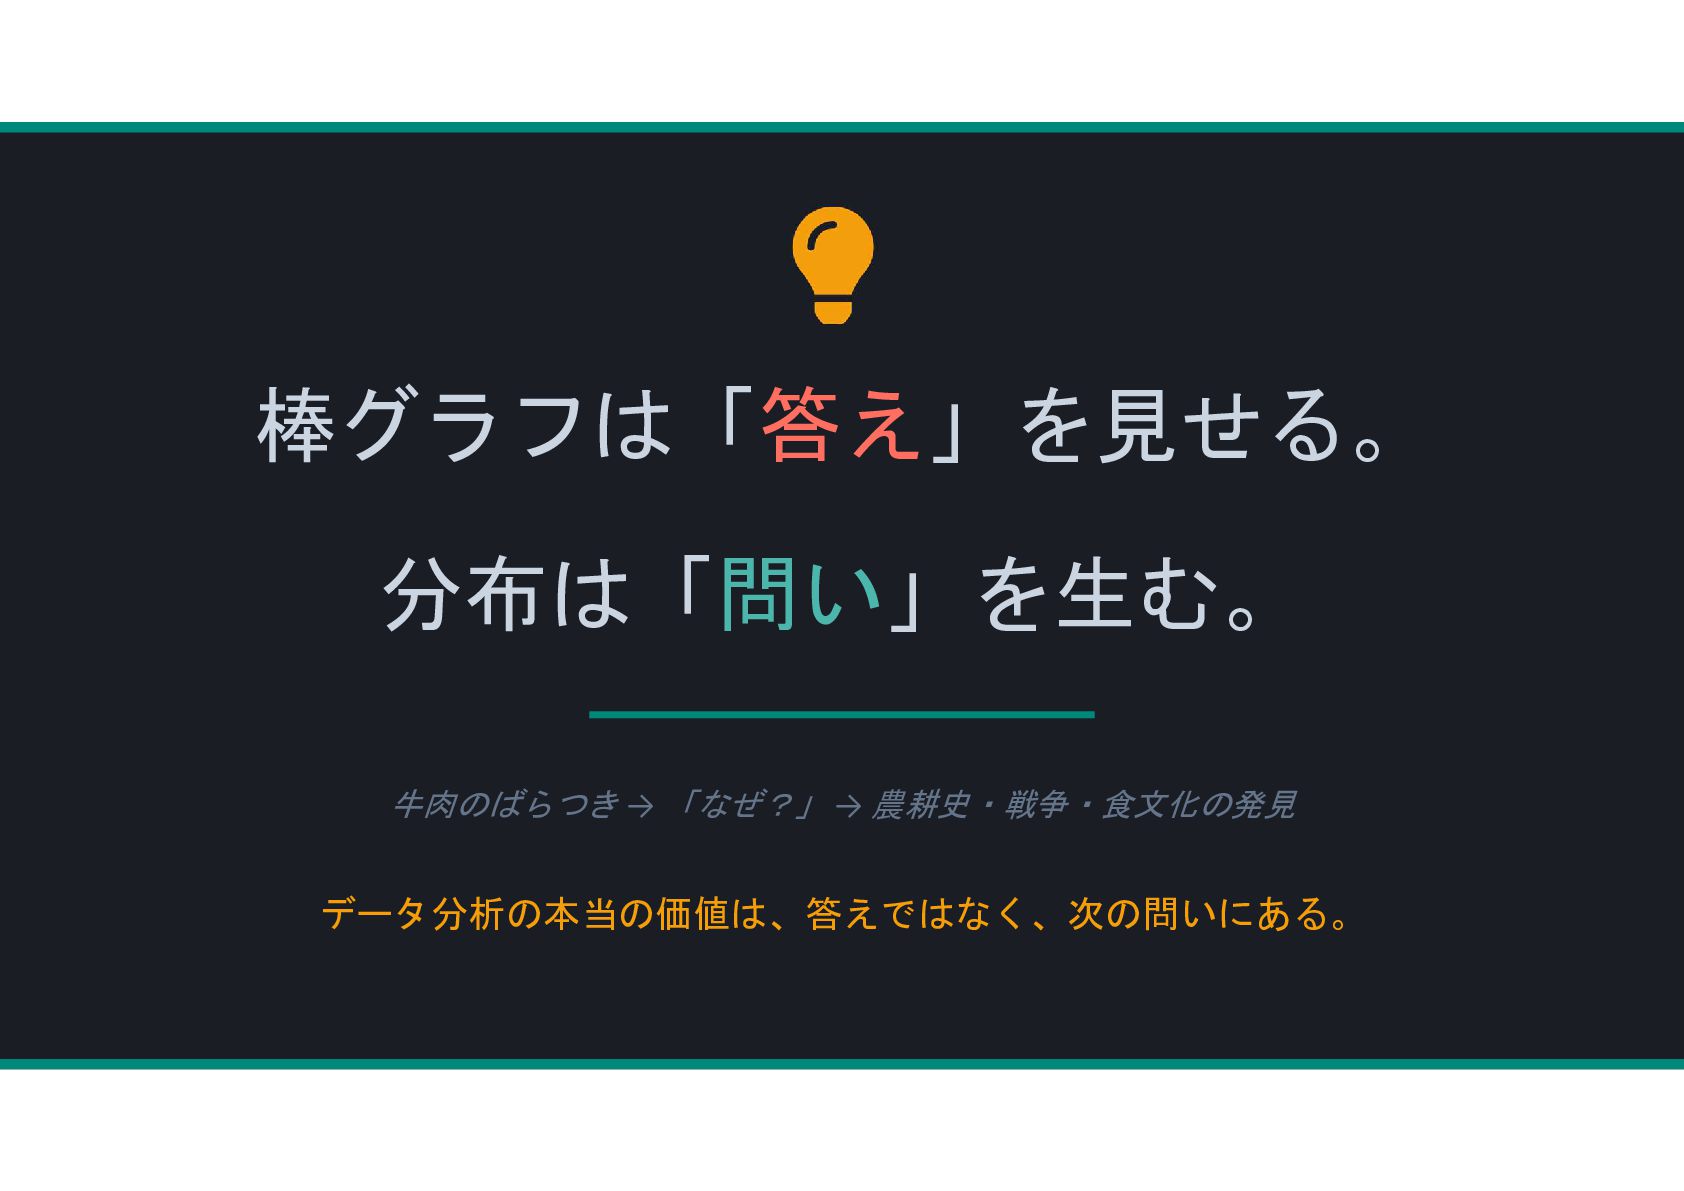
棒グラフで平均を比較するだけでは見えない、「分布」から生まれる問いの力について話しています。
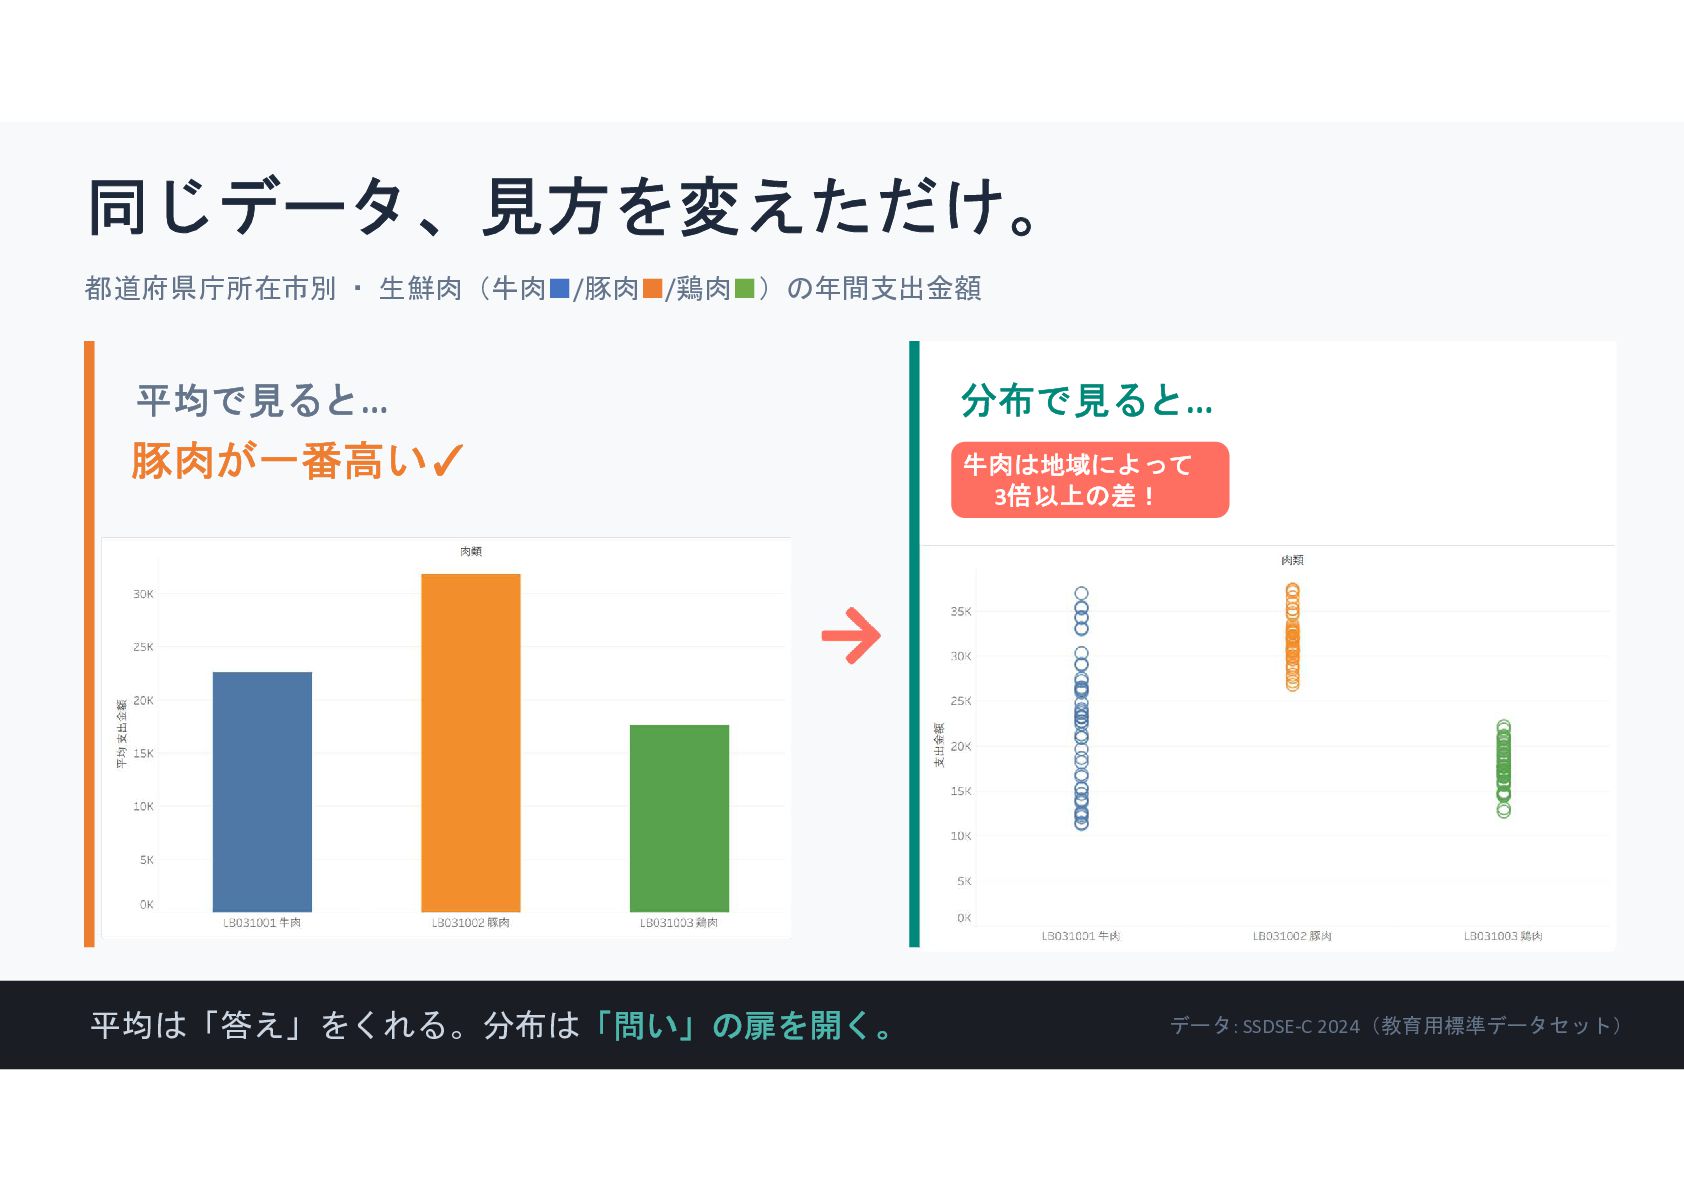
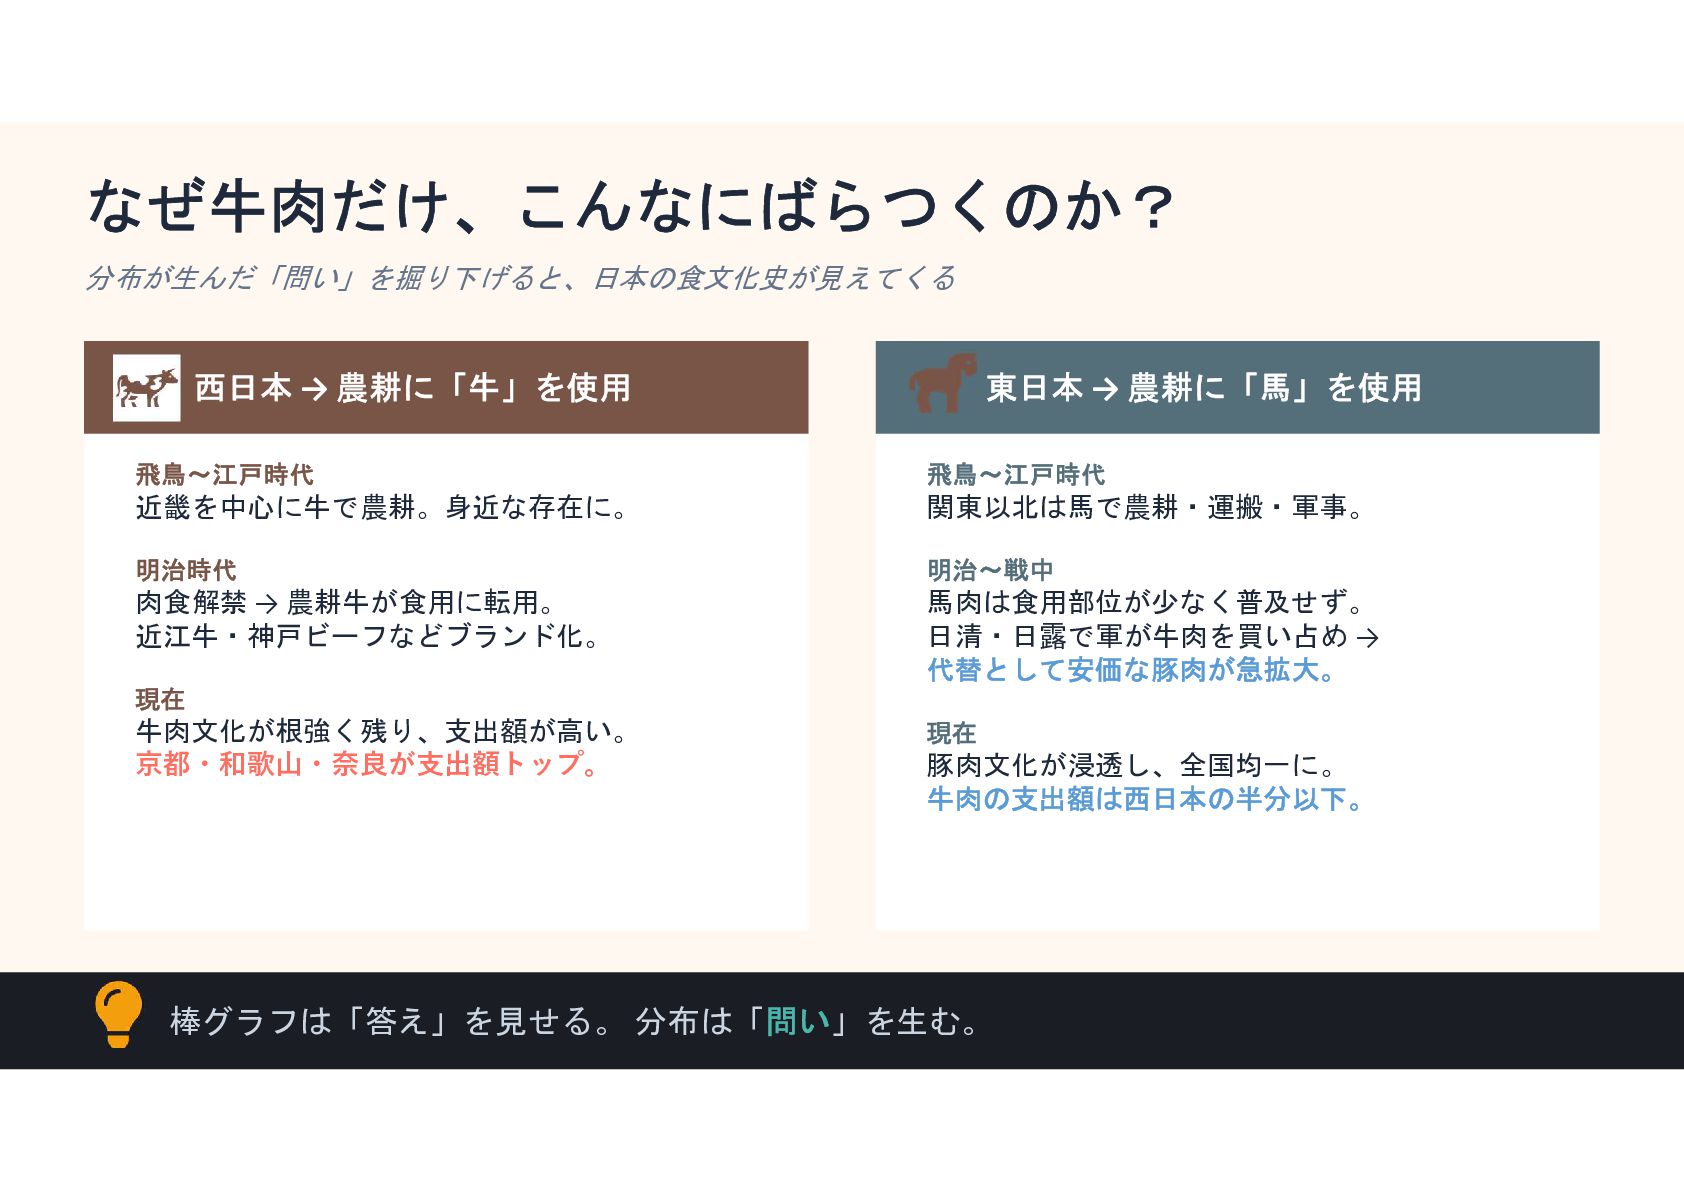
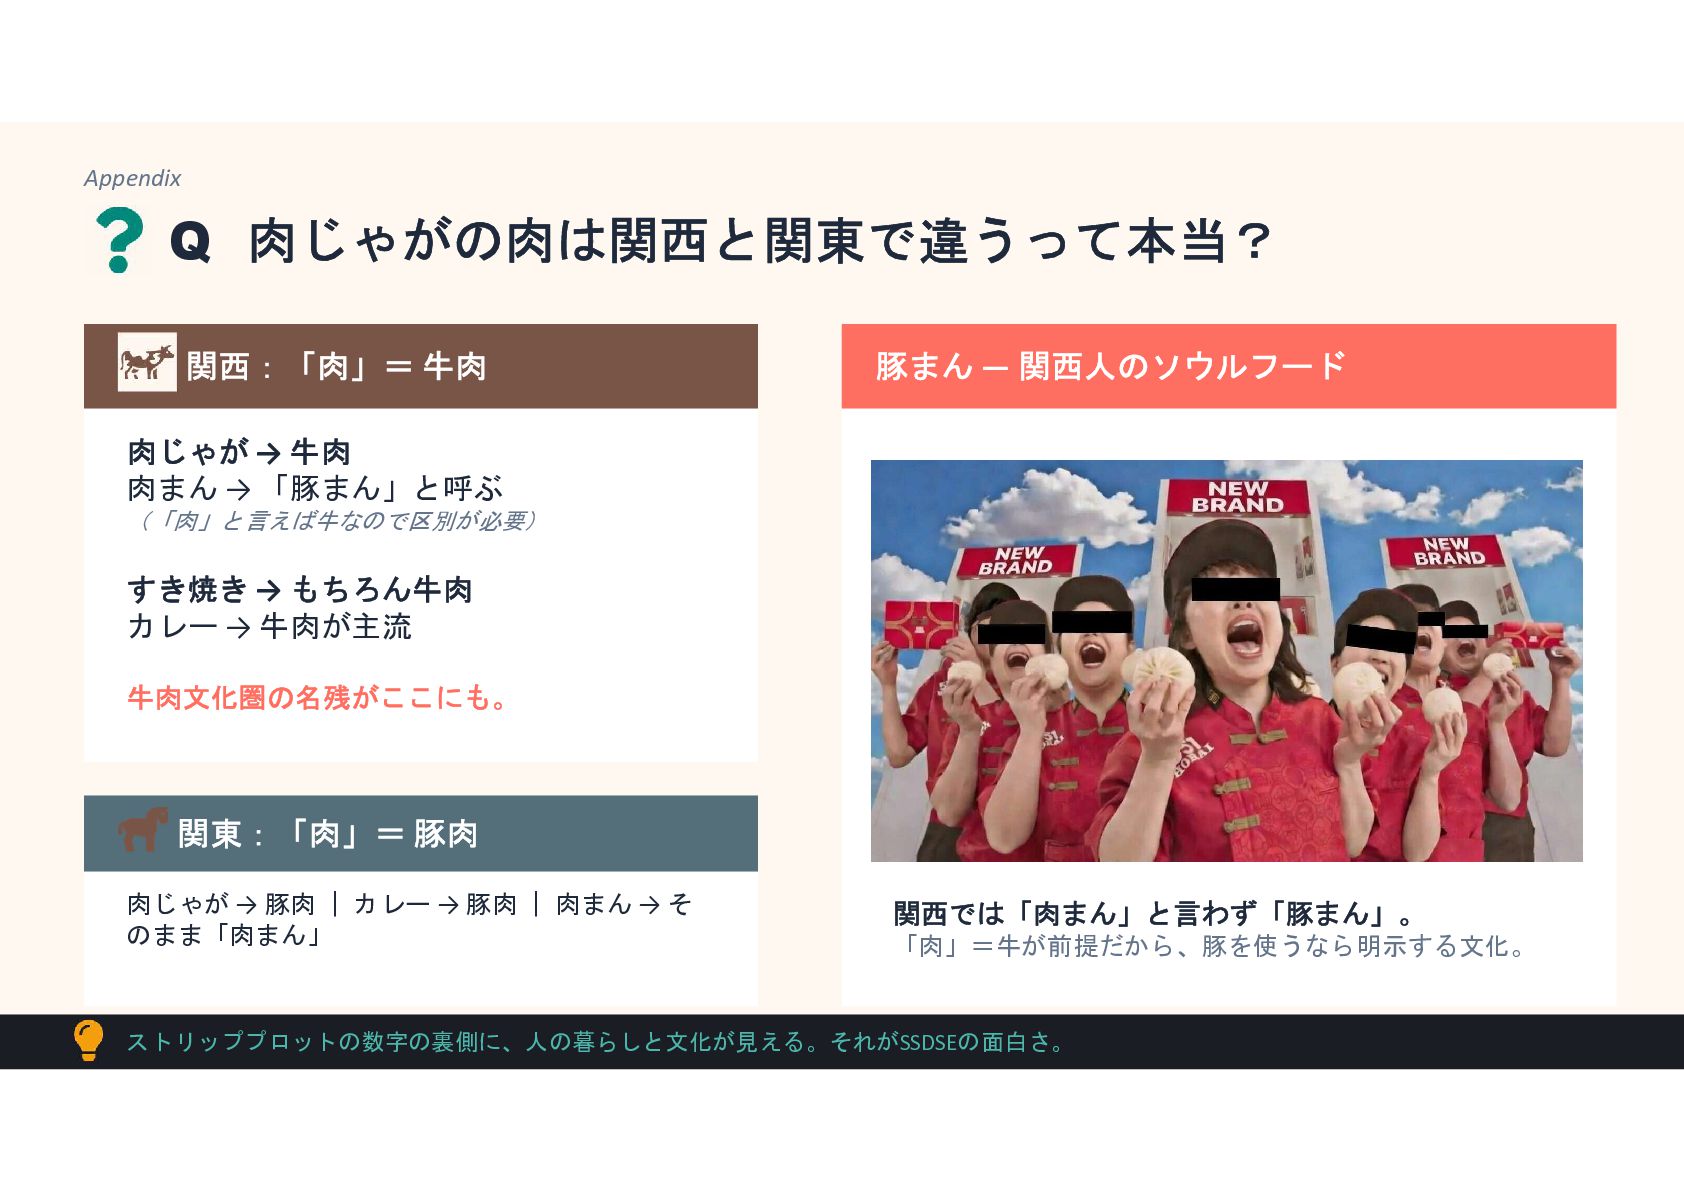
題材は、政府系組織が無料公開しているSSDSE(教育用標準データセット)の生鮮肉の支出金額データ。同じデータでも見方を変えるだけで、牛肉の3倍の地域差や、その背景にある日本の農耕史・食文化の違いまで見えてきます。
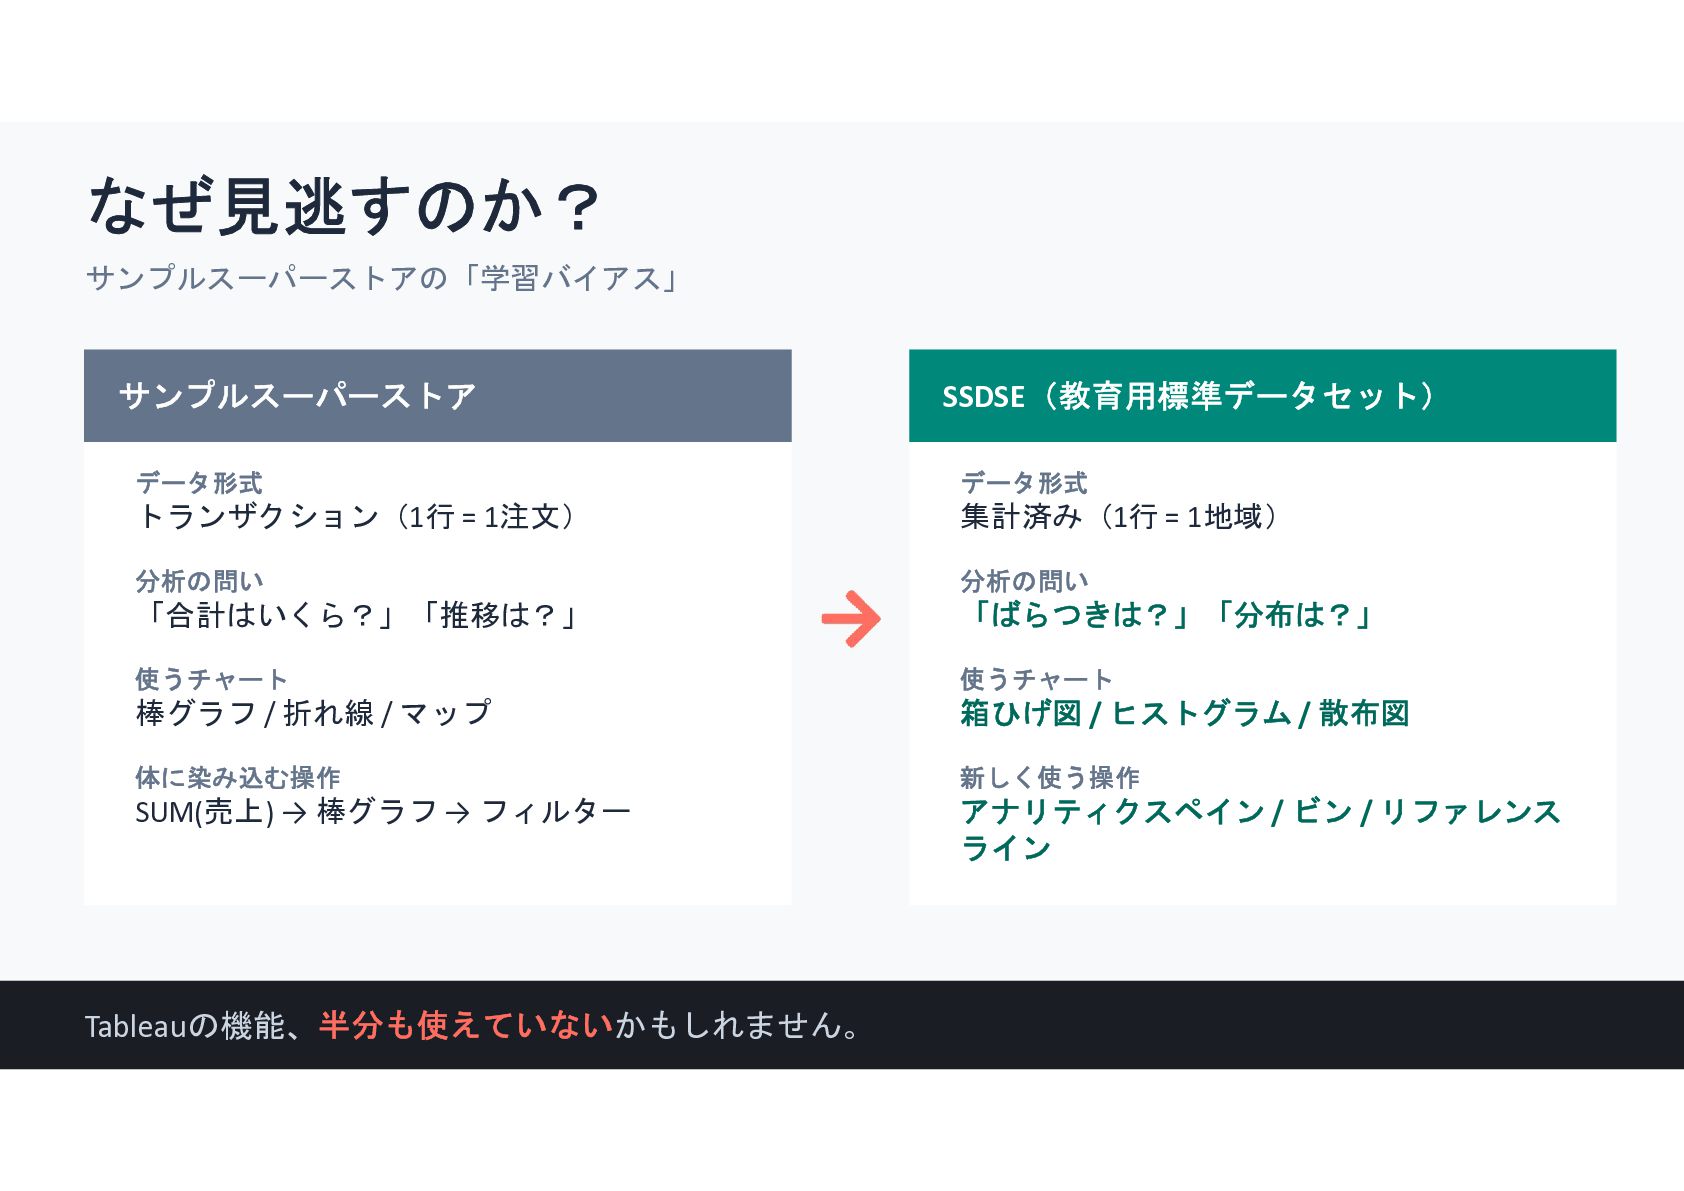
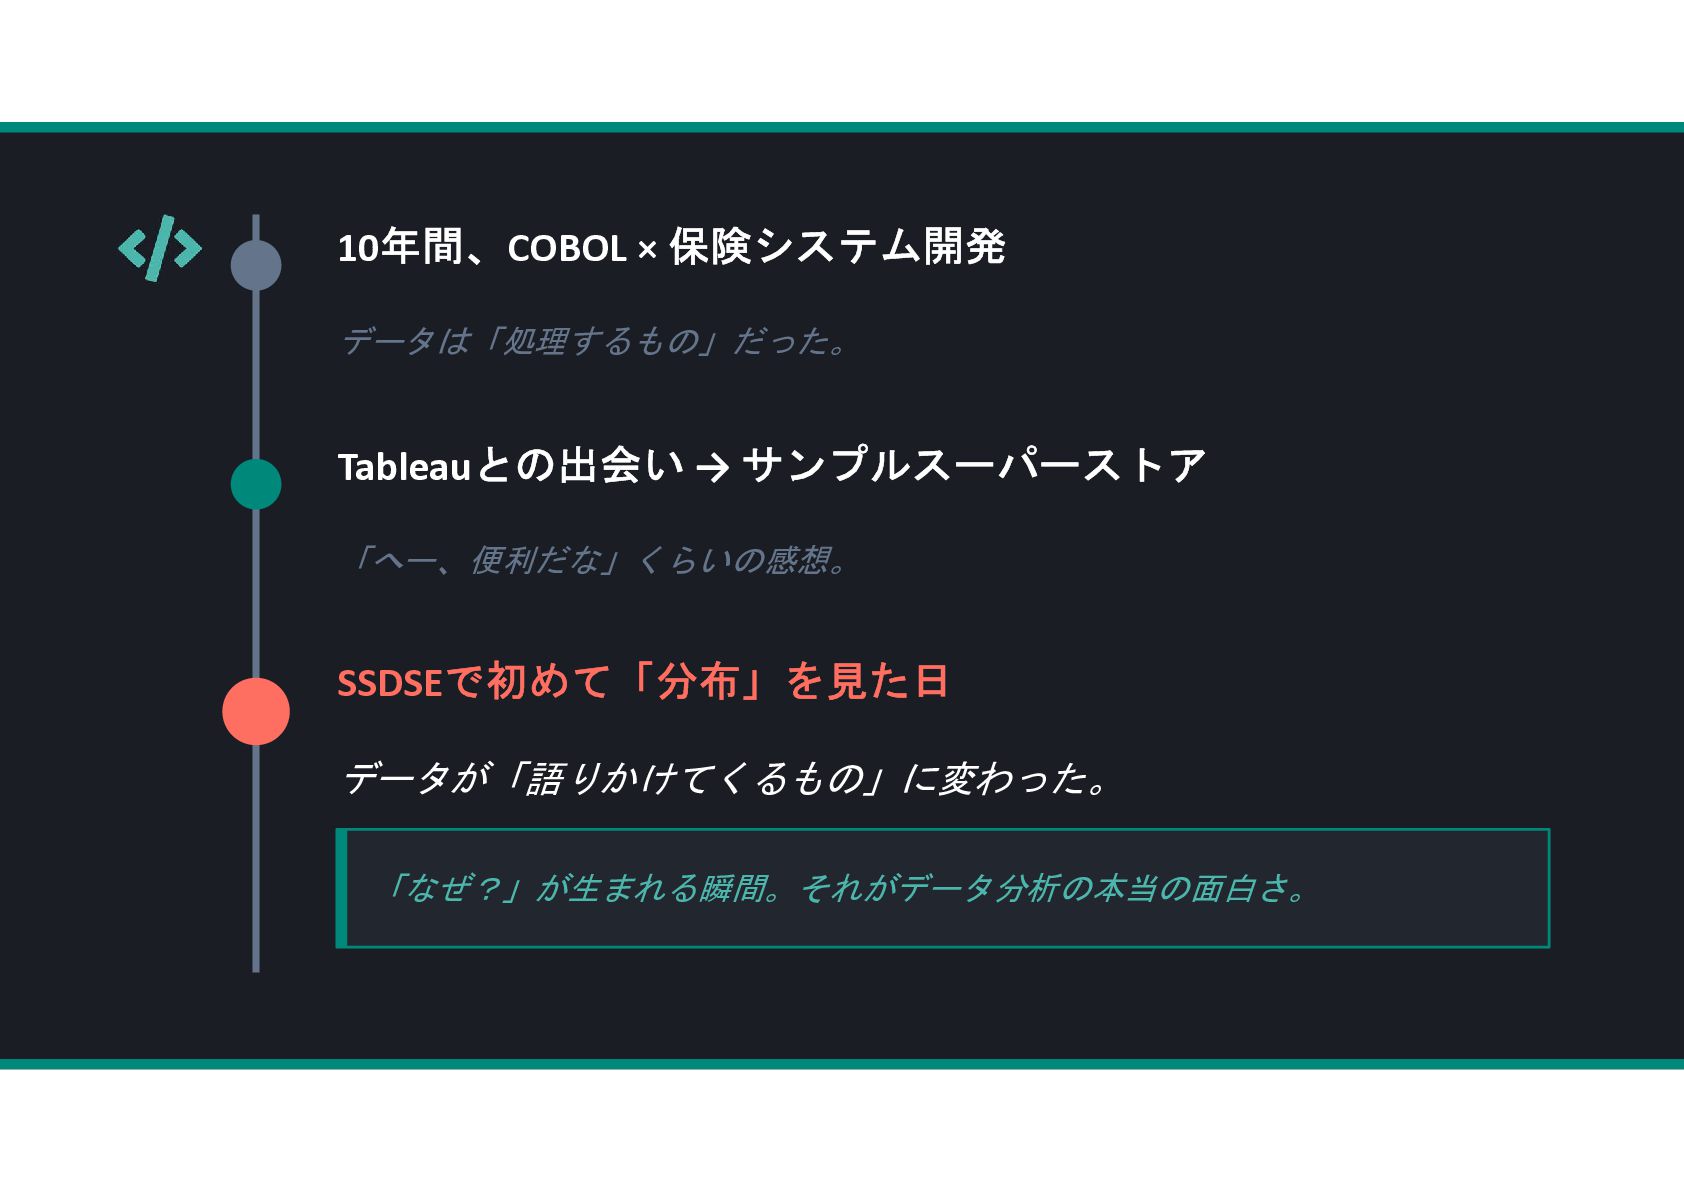
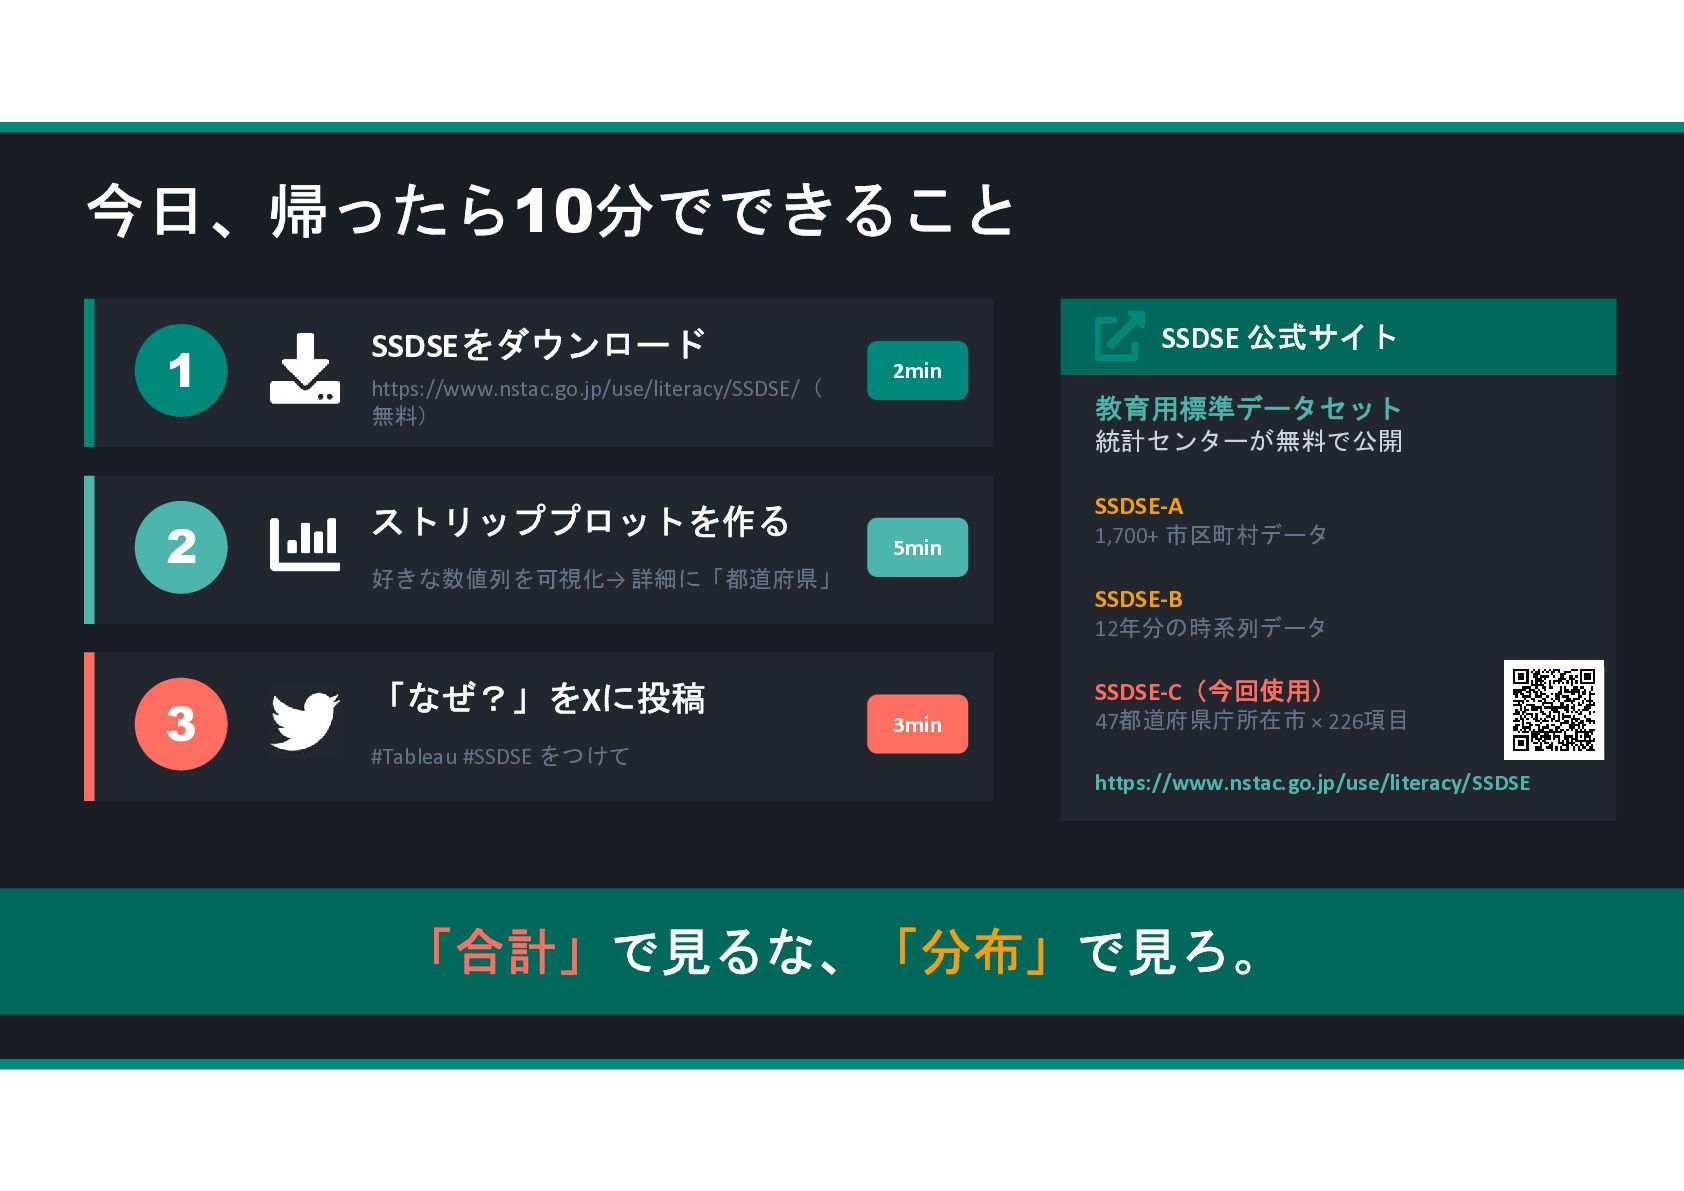
サンプルスーパーストアの次のステップとして、SSDSEで箱ひげ図やヒストグラムを試してみてください。データを見るときの気づきになれば幸いです。
#Tableau #SSDSE #DATASABER #データ分析 #データ可視化
A Lightning Talk from Tableau Sugamo Meetup.
This talk explores what happens when you move beyond bar charts and start looking at distributions. Using free government statistics (SSDSE) on household meat expenditure across 47 Japanese prefectural capitals, a simple strip plot reveals that beef spending varies by over 3x between cities — a pattern completely invisible in a bar chart of averages. Digging into "why" uncovers centuries of agricultural history and regional food culture.
Bar charts show answers. Distributions raise questions.
#Tableau #SSDSE #DATASABER #DataVisualization #DataAnalysis