Upgrade to Pro — share decks privately, control downloads, hide ads and more …

Real Incentives, Real People

Sponsored · Your Podcast. Everywhere. Effortlessly. Share. Educate. Inspire. Entertain. You do you. We'll handle the rest.
Avatar for Health Integrated Health Integrated
March 25, 2015
65

Real Incentives, Real People

Presented by Karen Milgate at the Executive Leadership Summit on March 24 - 26, 2015.

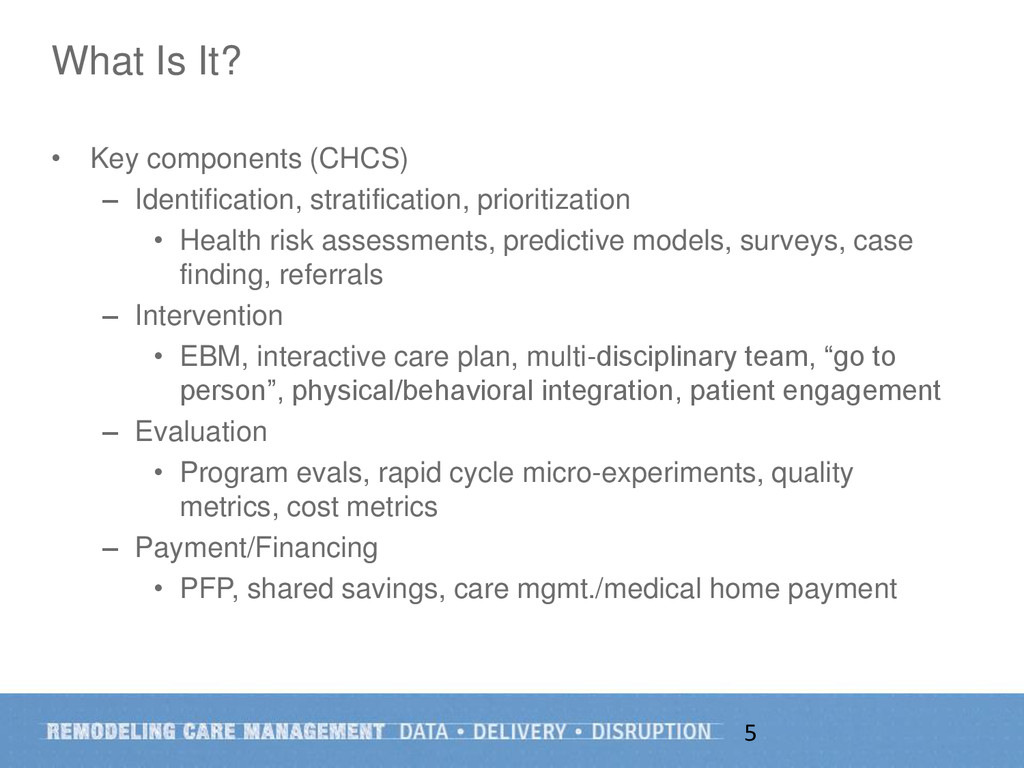
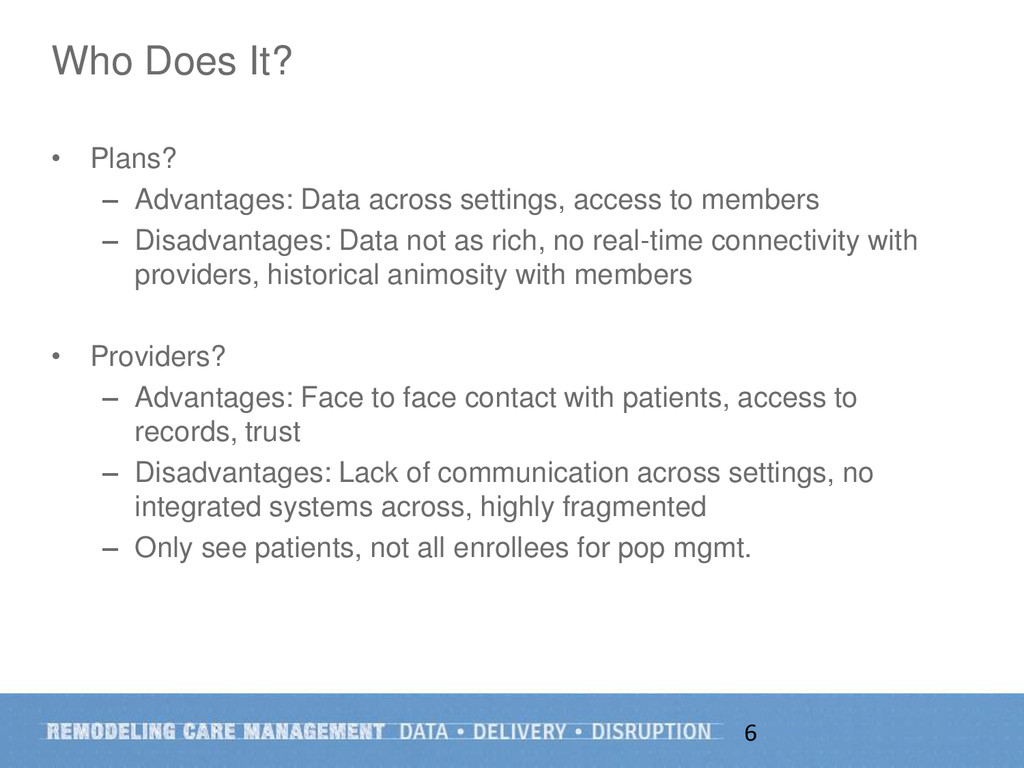
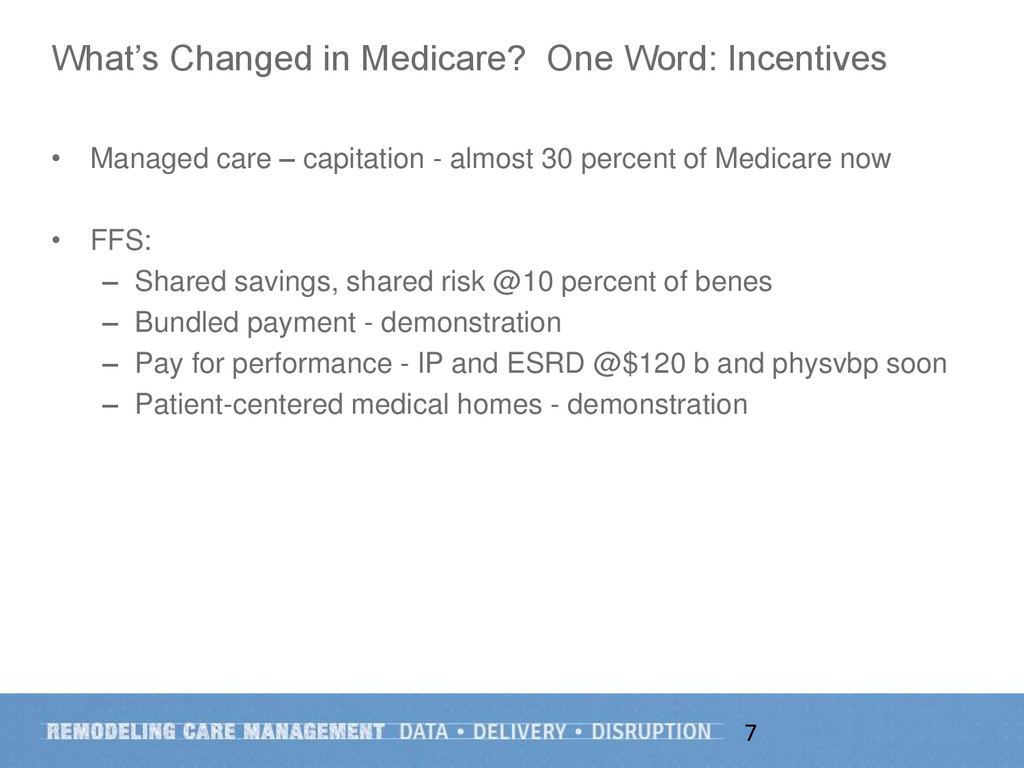
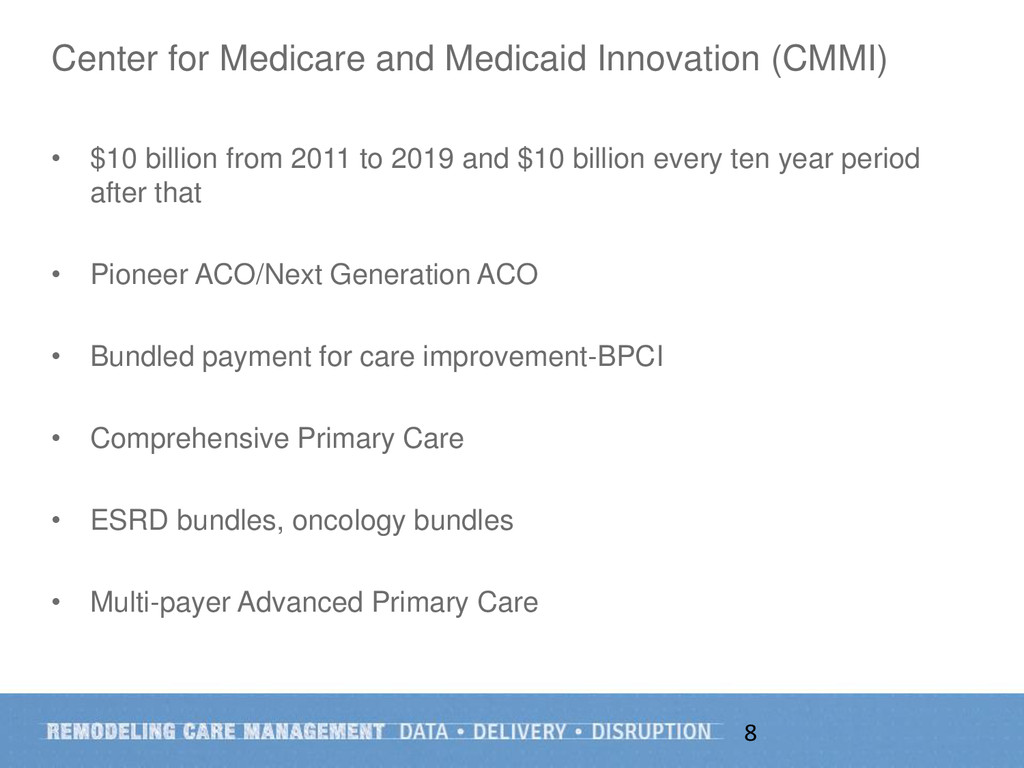
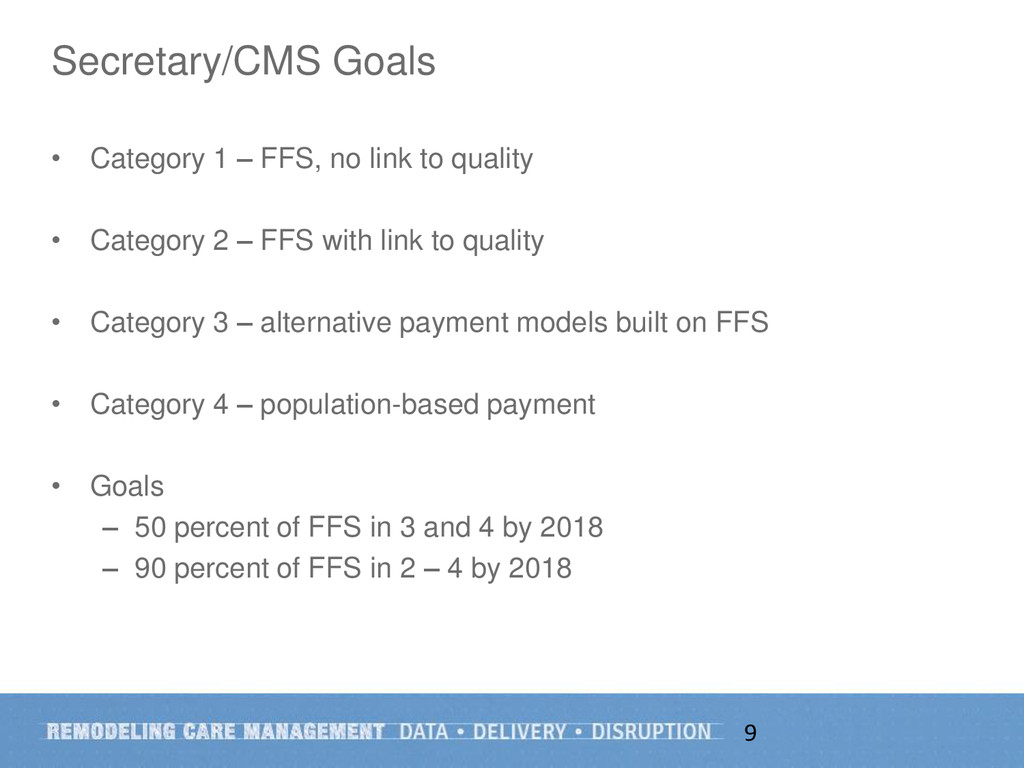
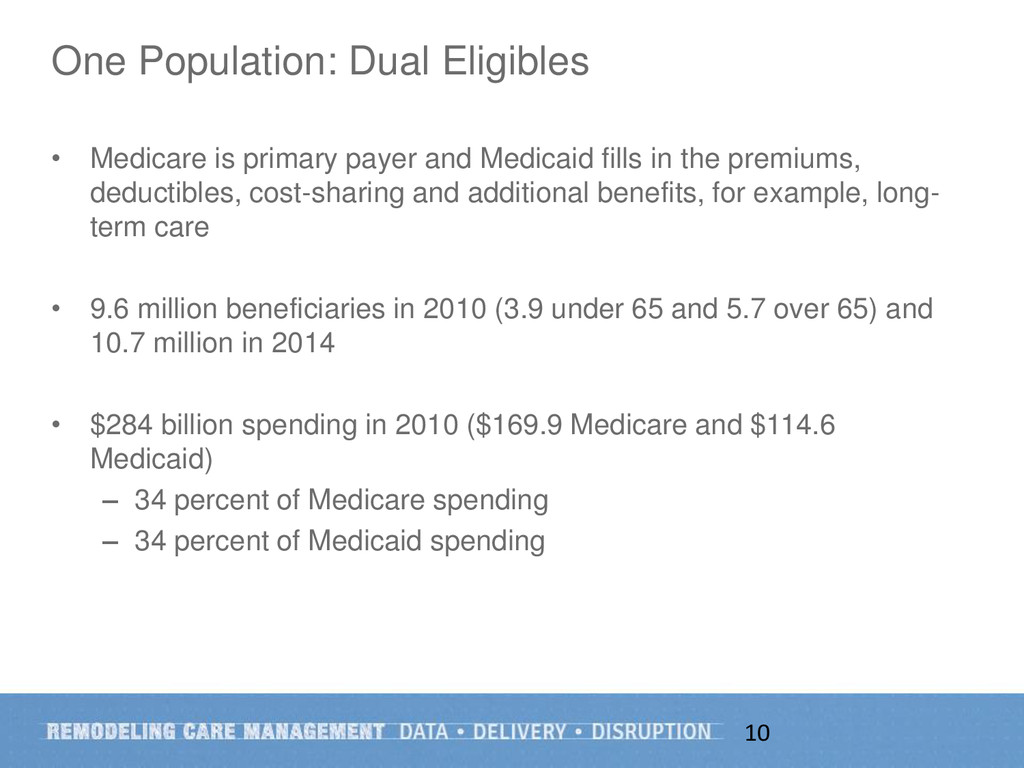
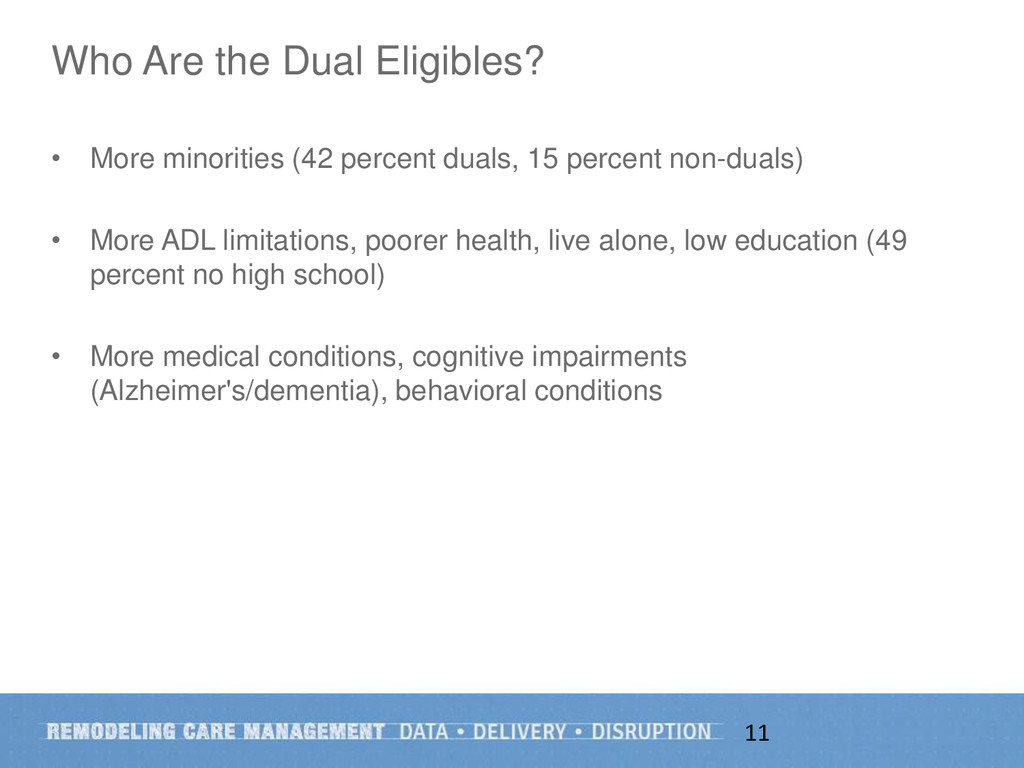
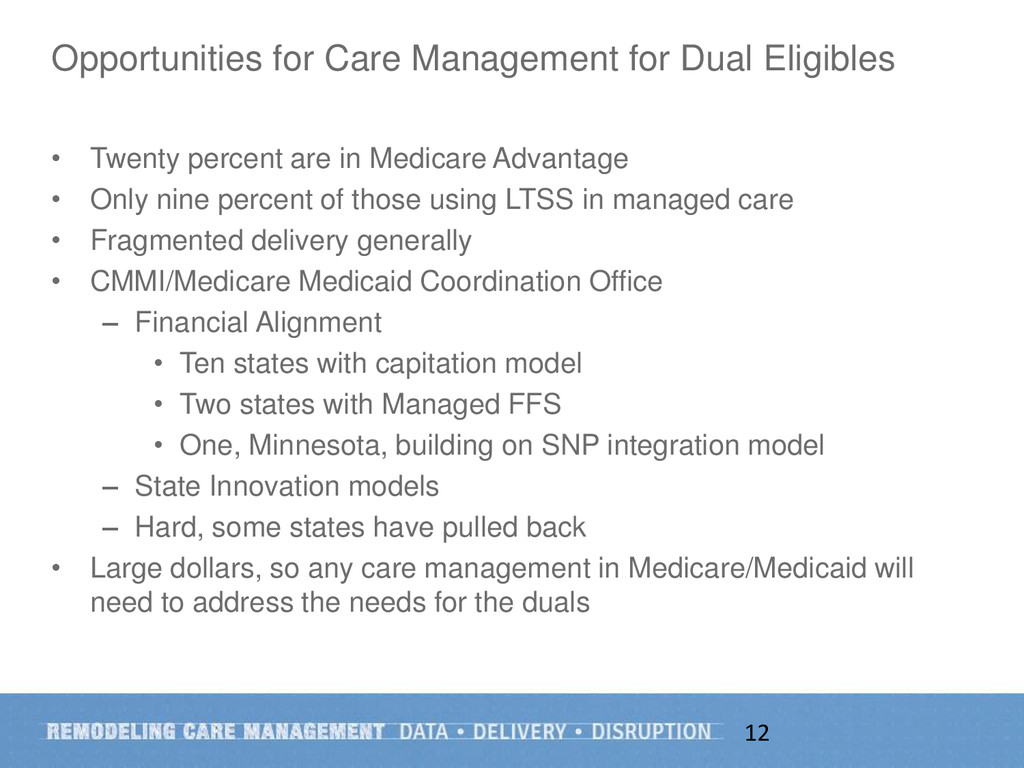
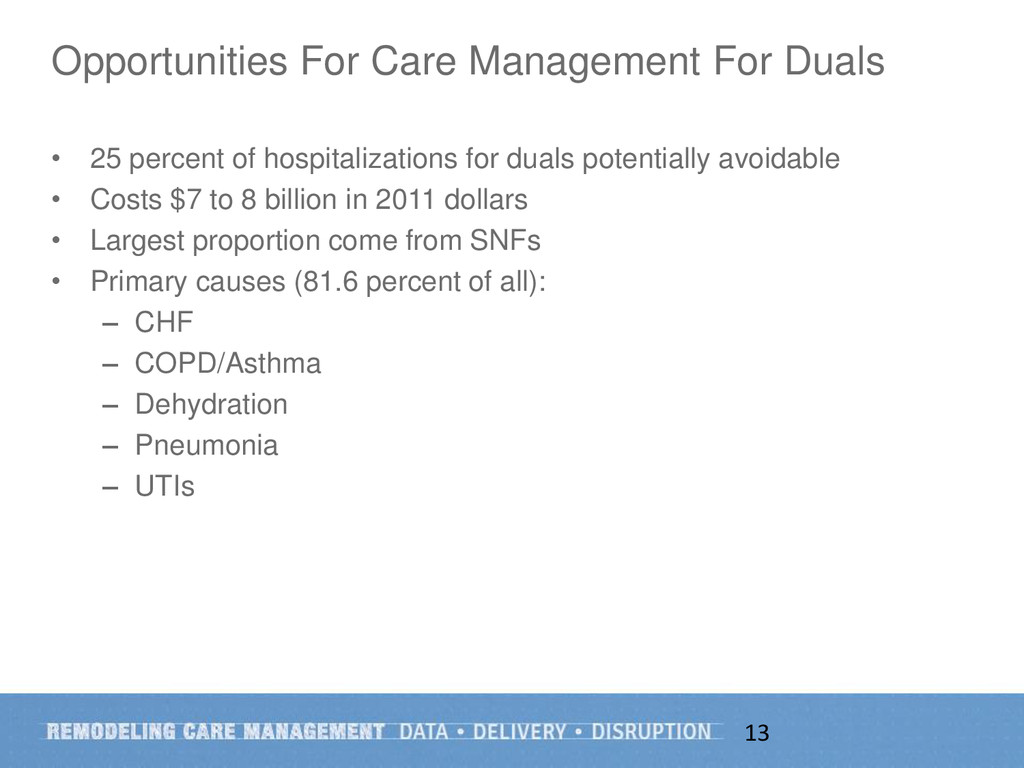
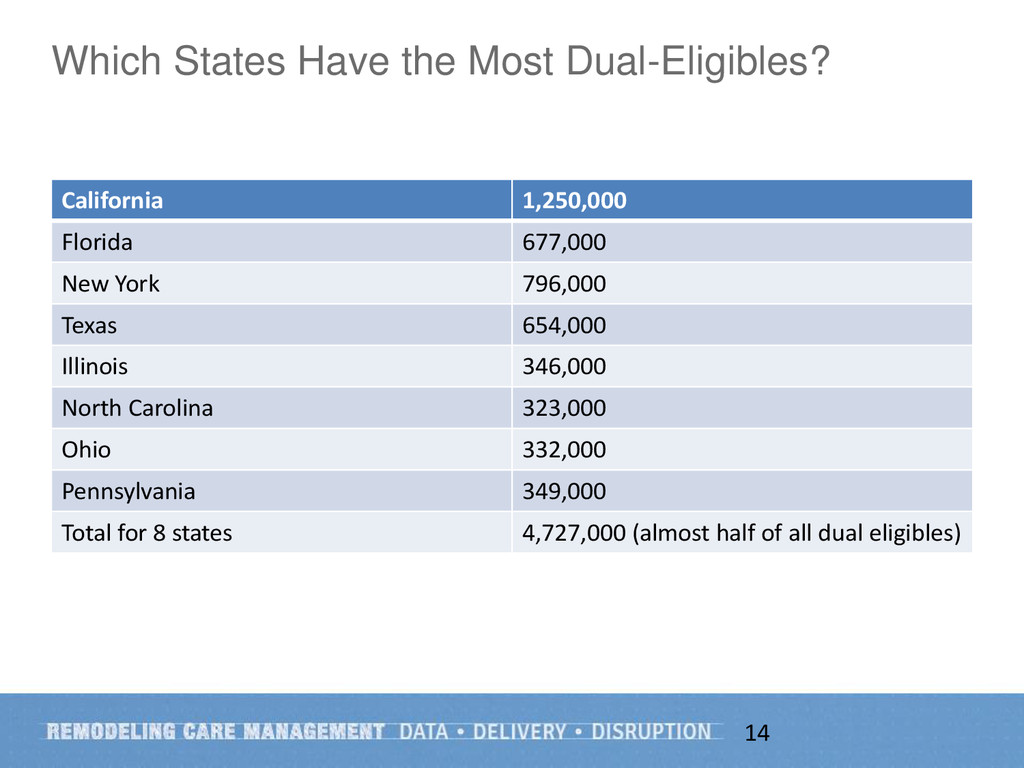
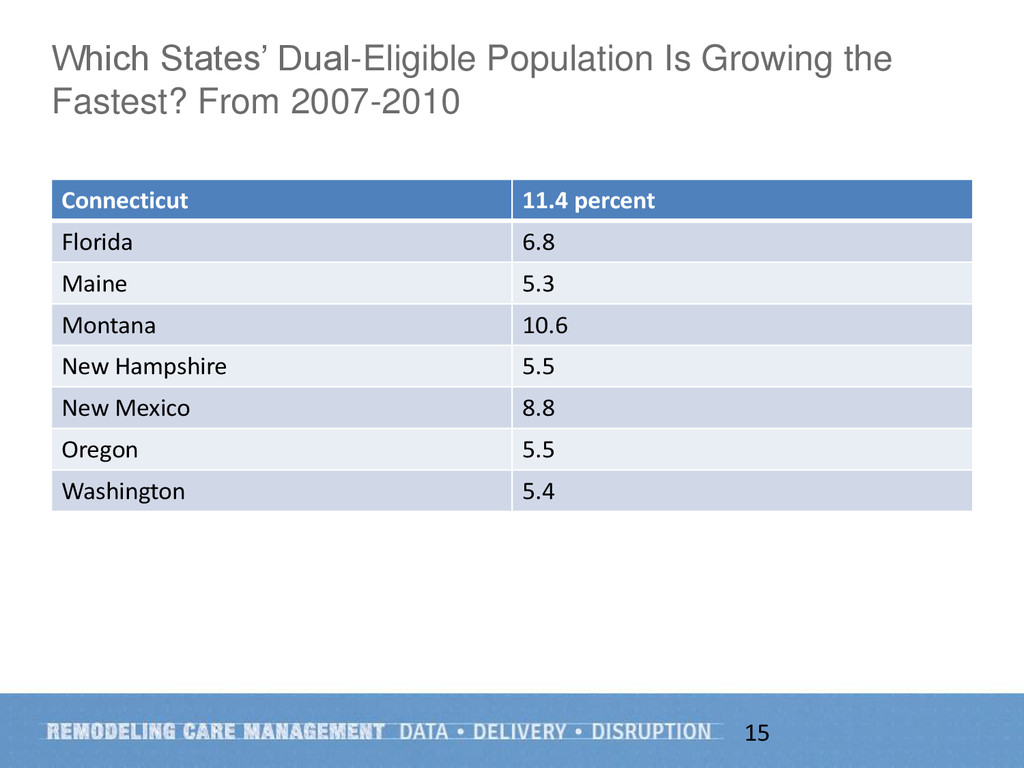
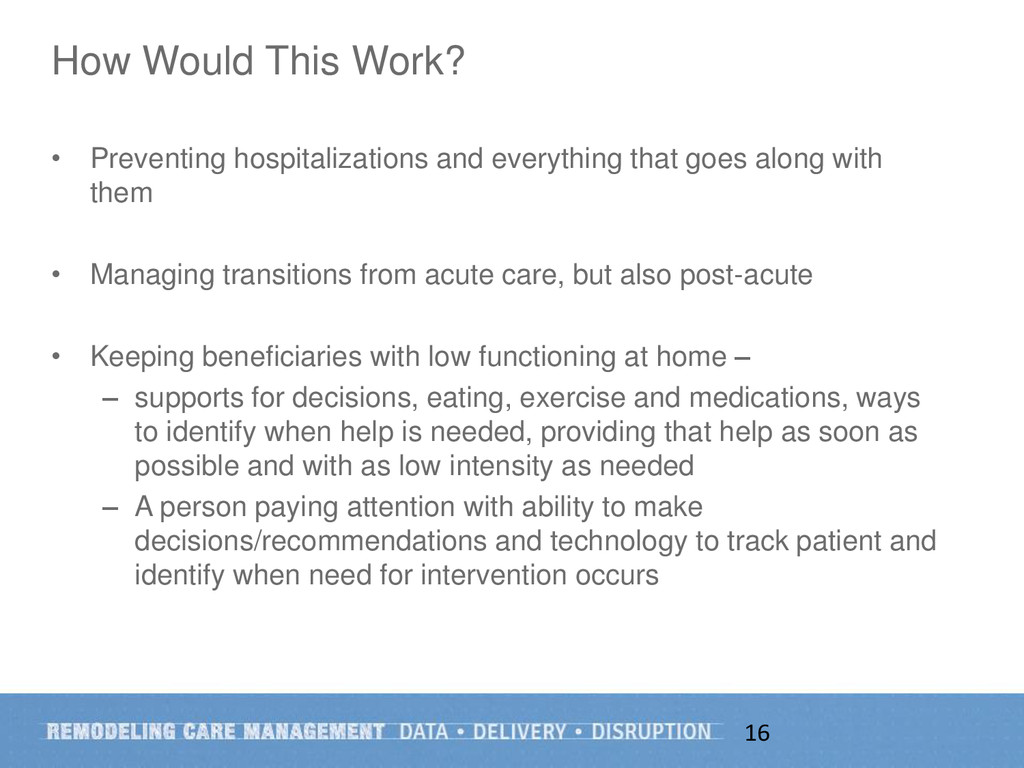
This presentation provides concrete examples of payment and other policies that are driving a broader and permanent trend in increasing demand for effective care management. Ms. Milgate also shares a case example of a population in great need of care management that provides a unique new opportunity for health plans, health systems, states and the federal government: dual eligible beneficiaries.

Avatar for Health Integrated

Health Integrated

March 25, 2015
Tweet

More Decks by Health Integrated

Transcript

  1. Overview • Care management: Why is it important, what is

    it, who does it • Why now? • Who can most benefit? 2
  2. Why • Baby boomers retiring – 54 million today to

    80 million in 2030 – Increasing prevalence of chronic conditions - more 45 – 65 year-olds with 2, 3 and over 4 – Baby boomer bubble in 2025 will make Medicare program older (higher proportion over 75) – Even if per bene increase less, the number retiring – 3 percent increase annually • Total spending for Medicare and Medicaid is 39 percent of all health spending and growing – Medicare total @$500 b today - will double to $1 trillion in ten years – Less ability to pay for – 1970 4.6 workers per bene - 2030 2.3 per bene – Medicaid – 80 million benes and $470 billion in care • Price X volume (services times people)= cost – Lots of action on price. Has its limits. – What about volume? Know variation. Know excess. Know quality issues. • Care Management addresses both—excess volume and quality. 3
  3. What Is It? Care management programs apply systems, science, incentives,

    and information to improve medical practice and assist consumers and their support system to become engaged in a collaborative program designed to manage medical/social/mental health conditions more effectively. The goal of care management is to achieve an optimal level of wellness and improve coordination of care while providing cost effective, non- duplicative services. (Robert Mechanic) 4
  4. What Is It? • Key components (CHCS) – Identification, stratification,

    prioritization • Health risk assessments, predictive models, surveys, case finding, referrals – Intervention • EBM, interactive care plan, multi-disciplinary team, ―go to person‖, physical/behavioral integration, patient engagement – Evaluation • Program evals, rapid cycle micro-experiments, quality metrics, cost metrics – Payment/Financing • PFP, shared savings, care mgmt./medical home payment 5
  5. Who Does It? • Plans? – Advantages: Data across settings,

    access to members – Disadvantages: Data not as rich, no real-time connectivity with providers, historical animosity with members • Providers? – Advantages: Face to face contact with patients, access to records, trust – Disadvantages: Lack of communication across settings, no integrated systems across, highly fragmented – Only see patients, not all enrollees for pop mgmt. 6
  6. What’s Changed in Medicare? One Word: Incentives • Managed care

    – capitation - almost 30 percent of Medicare now • FFS: – Shared savings, shared risk @10 percent of benes – Bundled payment - demonstration – Pay for performance - IP and ESRD @$120 b and physvbp soon – Patient-centered medical homes - demonstration 7
  7. Center for Medicare and Medicaid Innovation (CMMI) • $10 billion

    from 2011 to 2019 and $10 billion every ten year period after that • Pioneer ACO/Next Generation ACO • Bundled payment for care improvement-BPCI • Comprehensive Primary Care • ESRD bundles, oncology bundles • Multi-payer Advanced Primary Care 8
  8. Secretary/CMS Goals • Category 1 – FFS, no link to

    quality • Category 2 – FFS with link to quality • Category 3 – alternative payment models built on FFS • Category 4 – population-based payment • Goals – 50 percent of FFS in 3 and 4 by 2018 – 90 percent of FFS in 2 – 4 by 2018 9
  9. One Population: Dual Eligibles • Medicare is primary payer and

    Medicaid fills in the premiums, deductibles, cost-sharing and additional benefits, for example, long- term care • 9.6 million beneficiaries in 2010 (3.9 under 65 and 5.7 over 65) and 10.7 million in 2014 • $284 billion spending in 2010 ($169.9 Medicare and $114.6 Medicaid) – 34 percent of Medicare spending – 34 percent of Medicaid spending 10
  10. Who Are the Dual Eligibles? • More minorities (42 percent

    duals, 15 percent non-duals) • More ADL limitations, poorer health, live alone, low education (49 percent no high school) • More medical conditions, cognitive impairments (Alzheimer's/dementia), behavioral conditions 11
  11. Opportunities for Care Management for Dual Eligibles • Twenty percent

    are in Medicare Advantage • Only nine percent of those using LTSS in managed care • Fragmented delivery generally • CMMI/Medicare Medicaid Coordination Office – Financial Alignment • Ten states with capitation model • Two states with Managed FFS • One, Minnesota, building on SNP integration model – State Innovation models – Hard, some states have pulled back • Large dollars, so any care management in Medicare/Medicaid will need to address the needs for the duals 12
  12. Opportunities For Care Management For Duals • 25 percent of

    hospitalizations for duals potentially avoidable • Costs $7 to 8 billion in 2011 dollars • Largest proportion come from SNFs • Primary causes (81.6 percent of all): – CHF – COPD/Asthma – Dehydration – Pneumonia – UTIs 13
  13. Which States Have the Most Dual-Eligibles? California 1,250,000 Florida 677,000

    New York 796,000 Texas 654,000 Illinois 346,000 North Carolina 323,000 Ohio 332,000 Pennsylvania 349,000 Total for 8 states 4,727,000 (almost half of all dual eligibles) 14
  14. Which States’ Dual-Eligible Population Is Growing the Fastest? From 2007-2010

    Connecticut 11.4 percent Florida 6.8 Maine 5.3 Montana 10.6 New Hampshire 5.5 New Mexico 8.8 Oregon 5.5 Washington 5.4 15
  15. How Would This Work? • Preventing hospitalizations and everything that

    goes along with them • Managing transitions from acute care, but also post-acute • Keeping beneficiaries with low functioning at home – – supports for decisions, eating, exercise and medications, ways to identify when help is needed, providing that help as soon as possible and with as low intensity as needed – A person paying attention with ability to make decisions/recommendations and technology to track patient and identify when need for intervention occurs 16
  16. Summary • Need is great. Costs, quality, growing population of

    aged, disabled and older aged • Incentives exist more than ever. Provider level, provider system level, managed care, and state level • Dual eligible population hard, but represents an important sub-group that drives significant costs and quality 17