Lukas Rytz Vojin Jovanovic Manohar Jonnalagedda Aleksandar Prokopec Jorge Vicente Cantero Martin Odersky Viktor Kuncak Erik Meijer Tao Lee Tobias Schlatter Philipp Haller Julien Richard-Foy Fengyun Liu Others who helped make our MOOC story possible:
our impressions (it’s open-source!) My goal in this talk: To give you as complete of an impression as I can about the full experience of running a popular MOOC on functional programming.
6-8 minutes long – total 1.5-2 hours per week 7 weeks. – workload: 5-7 hours per week – verbatim 50% of EPFL’s on-campus Functional Programming course (2nd year bachelor level)
(2014) Initial trends in enrollment and completion of massive open online courses. The International Review of Research in Open and Distance Learning, 15(1), 133-160. 6.5% completion rate AVERAGE: across all MOOCs
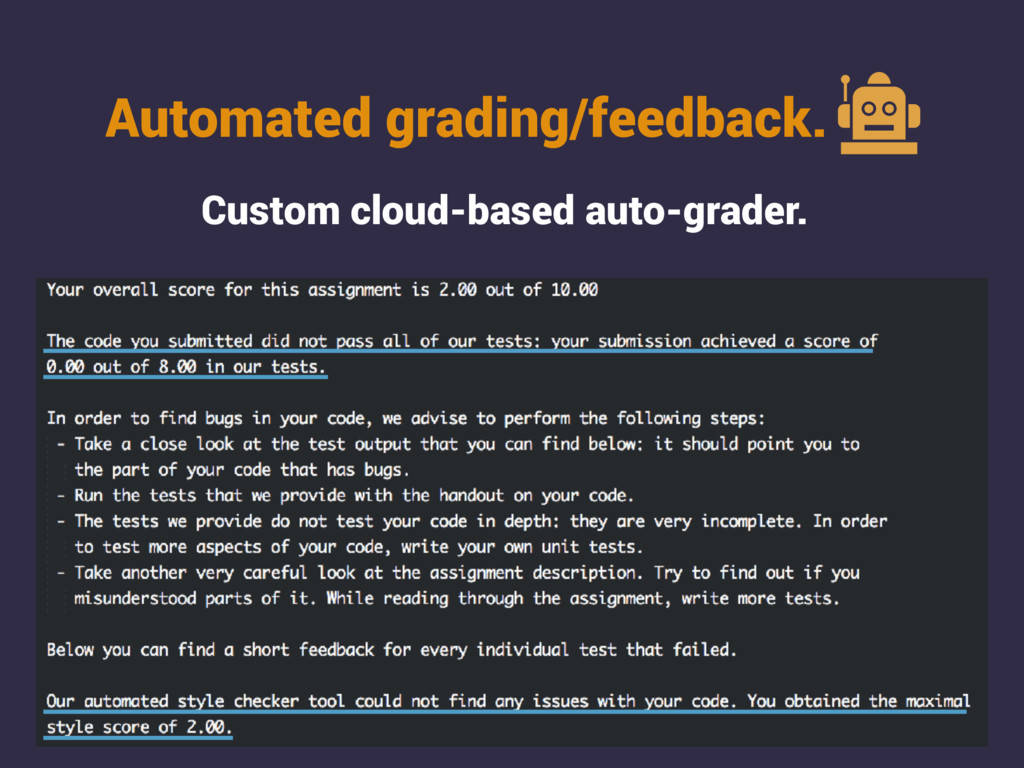
Massive suite of secret unit tests. Style-checker discourages: – mutable variables – return statements – the null value – while loops – magic numbers – overly long lines of code – non-standard capitalization – + more
5 10 15 20 # Submissions 0.0% 5.0% 10.0% 15.0% 20.0% 25.0% 30.0% 35.0% 40.0% 45.0% Percentage of Students Fall 2012 Spring 2013 (The number of submissions required to achieve a perfect score.)
well-worth their time. Do you feel the course was worth it? All respondents vs those who use Scala at work 1 (Disagree) 2 3 4 5 (Agree) 0 20 40 60 80 100 Percentage of Students 1 2 7 22 68 1 1 6 21 71 Fall 2012 1 (Disagree) 2 3 4 5 (Agree) 0 20 40 60 80 100 1 2 8 24 66 1 1 6 22 70 Spring 2013 All Respondents Respondents Using Scala at Work For Fall 2012, 71% amounts to 2,148/3,203 professional respondents.
that the course was well worth their time. we can conclude that there were indeed a significant number of professionals participating in the course. SO,
students 5-7 videos each week, 8-12min LECTURES weekly programming exercises ASSIGNMENTS work in groups, with TAs on HW EXERCISE SESSIONS midterm & final WRITTEN EXAMS offline traditional 2nd half of course SAME AS MOOC +
respondents out of ~50,000 For the Spring 2013 course, 4,595 respondents out of ~37,000 Total: 12,087 respondents Example questions: If applicable, what field of study was your highest degree in? What's your highest degree? How many years have you been programming? How difficult did you find the course overall? Where do you plan to apply what you've learned in this course? What experience do you have with other programming languages or paradigms?
Poor/Strongly Disagree No Opinion ine part of the course is: 38.37% 15.11% 4% would like to get more online courses: 23.26% 23.26% 9.6% 3%2%5% for the course is…: 28.57% 28.57% 8.3% 2%11.9% exercise sessions for the course is…: 15.11% 5.8%1% 48.83% prefer a course like this be... 17.8% 7% 6% On- campus 14 weeks No Opinon Online 7wks/ On-campus 7wks Legend 6 - Exce 5 4 3 2 1 - Poor No Opin Overall, the online part of the course is: 41.86% 38.37% 15.11% 4% (a) In the future, I would like to get more online courses: 33.72% 23.26% 23.26% 9.6% 3%2%5% (b) The online help for the course is…: 20.24% 28.57% 28.57% 8.3% 2%11.9% (c) The help in the exercise sessions for the course is…: 4.6%24.41% 15.11% 5.8%1% 48.83% (d) In the future, I'd prefer a course like this be... 69% 17.8% 7% 6% Online 14 weeks On- campus 14 weeks No Opinon Online 7wks/ On-campus 7wks (e) EPFL student data
Poor/Strongly Disagree No Opinion ine part of the course is: 38.37% 15.11% 4% would like to get more online courses: 23.26% 23.26% 9.6% 3%2%5% for the course is…: 28.57% 28.57% 8.3% 2%11.9% exercise sessions for the course is…: 15.11% 5.8%1% 48.83% prefer a course like this be... 17.8% 7% 6% On- campus 14 weeks No Opinon Online 7wks/ On-campus 7wks Legend 6 - Exce 5 4 3 2 1 - Poor No Opin Overall, the online part of the course is: 41.86% 38.37% 15.11% 4% (a) In the future, I would like to get more online courses: 33.72% 23.26% 23.26% 9.6% 3%2%5% (b) The online help for the course is…: 20.24% 28.57% 28.57% 8.3% 2%11.9% (c) The help in the exercise sessions for the course is…: 4.6%24.41% 15.11% 5.8%1% 48.83% (d) In the future, I'd prefer a course like this be... 69% 17.8% 7% 6% Online 14 weeks On- campus 14 weeks No Opinon Online 7wks/ On-campus 7wks (e) ~80% of students think the course was very good or excellent EPFL student data
2 1 - Poor/Strongly Disagree No Opinion ine part of the course is: 38.37% 15.11% 4% would like to get more online courses: 23.26% 23.26% 9.6% 3%2%5% for the course is…: 28.57% 28.57% 8.3% 2%11.9% exercise sessions for the course is…: 15.11% 5.8%1% 48.83% prefer a course like this be... 17.8% 7% 6% On- campus 14 weeks No Opinon Online 7wks/ On-campus 7wks Legend 6 - Exce 5 4 3 2 1 - Poor No Opin Overall, the online part of the course is: 41.86% 38.37% 15.11% 4% (a) In the future, I would like to get more online courses: 33.72% 23.26% 23.26% 9.6% 3%2%5% (b) The online help for the course is…: 20.24% 28.57% 28.57% 8.3% 2%11.9% (c) The help in the exercise sessions for the course is…: 4.6%24.41% 15.11% 5.8%1% 48.83% (d) In the future, I'd prefer a course like this be... 69% 17.8% 7% 6% Online 14 weeks On- campus 14 weeks No Opinon Online 7wks/ On-campus 7wks (e) ~58% of students would like more online courses in the future
2 1 - Poor/Strongly Disagree No Opinion ine part of the course is: 38.37% 15.11% 4% would like to get more online courses: 23.26% 23.26% 9.6% 3%2%5% for the course is…: 28.57% 28.57% 8.3% 2%11.9% exercise sessions for the course is…: 15.11% 5.8%1% 48.83% prefer a course like this be... 17.8% 7% 6% On- campus 14 weeks No Opinon Online 7wks/ On-campus 7wks Legend 6 - Exce 5 4 3 2 1 - Poor No Opin Overall, the online part of the course is: 41.86% 38.37% 15.11% 4% (a) In the future, I would like to get more online courses: 33.72% 23.26% 23.26% 9.6% 3%2%5% (b) The online help for the course is…: 20.24% 28.57% 28.57% 8.3% 2%11.9% (c) The help in the exercise sessions for the course is…: 4.6%24.41% 15.11% 5.8%1% 48.83% (d) In the future, I'd prefer a course like this be... 69% 17.8% 7% 6% Online 14 weeks On- campus 14 weeks No Opinon Online 7wks/ On-campus 7wks (e) ~69% of students would like their entire course to be online, with no on-campus component
course. In fact, students even preferred the MOOC forums to the exercise sessions. SO, Test performance remained the same, course ratings remained high.
new MOOCs + capstone project bundled into a Scala mini-degree on Coursera Principles of Reactive Programming ~67,000 registrants in first run Parallel Programming Big Data Analysis with Scala & Spark 400,000 registrants in first year for courses in mini-degree
to retention. Recent results [1] at LAK’17 arrive at the same conclusion. [1] Follow the Successful Crowd: Raising MOOC Completion Rates through Social Comparison at Scale, LAK’17
+ a tight feedback loop is key to retention. Recent results [1] at LAK’17 arrive at the same conclusion. [1] Follow the Successful Crowd: Raising MOOC Completion Rates through Social Comparison at Scale, LAK’17
+ a tight feedback loop is key to retention. Recent results [1] at LAK’17 arrive at the same conclusion. Not sure. Did you notice I didn’t have data to show after 2013? [1] Follow the Successful Crowd: Raising MOOC Completion Rates through Social Comparison at Scale, LAK’17
again in 2017? Take aways… Autograding + a tight feedback loop is key to retention. Recent results [1] at LAK’17 arrive at the same conclusion. Not sure. Did you notice I didn’t have data to show after 2013? [1] Follow the Successful Crowd: Raising MOOC Completion Rates through Social Comparison at Scale, LAK’17