2014 Why aren’t others utilizing it? • Harder on large scale engagements, especially geographically dispersed networks • Not applicable to engagement • No tool/process • Limited knowledge in this area • Privacy concerns • No easy button
2014 Why do we use it? One artifact to rule them all! – Network – Processes – Registry – Event Logs – Files – Timelines – Information not stored on disk – Harder to hide …bang for buck
2014 So what do we do? • Treat it like having a live system in front of you • Answer questions that otherwise couldn’t be answered without memory • Targeted approach (pivot vs. automated) • Looking for anomalies • Timelining • Ability to answer specific questions based solely on this one artifact • Feed that intelligence gained back into the cycle
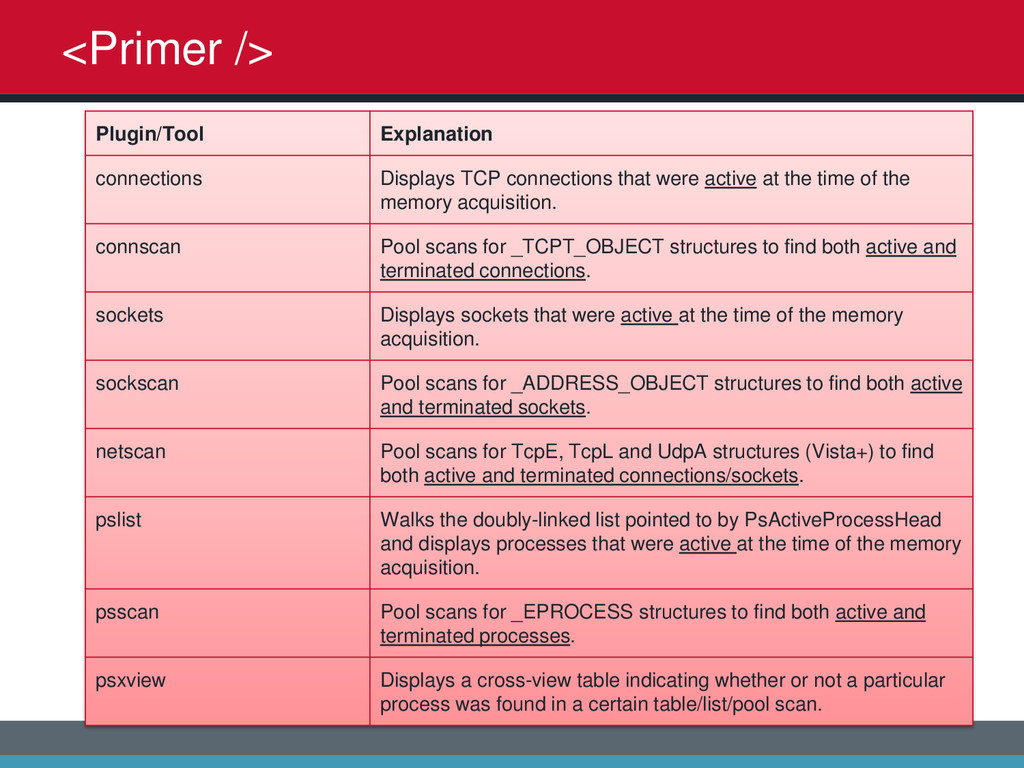
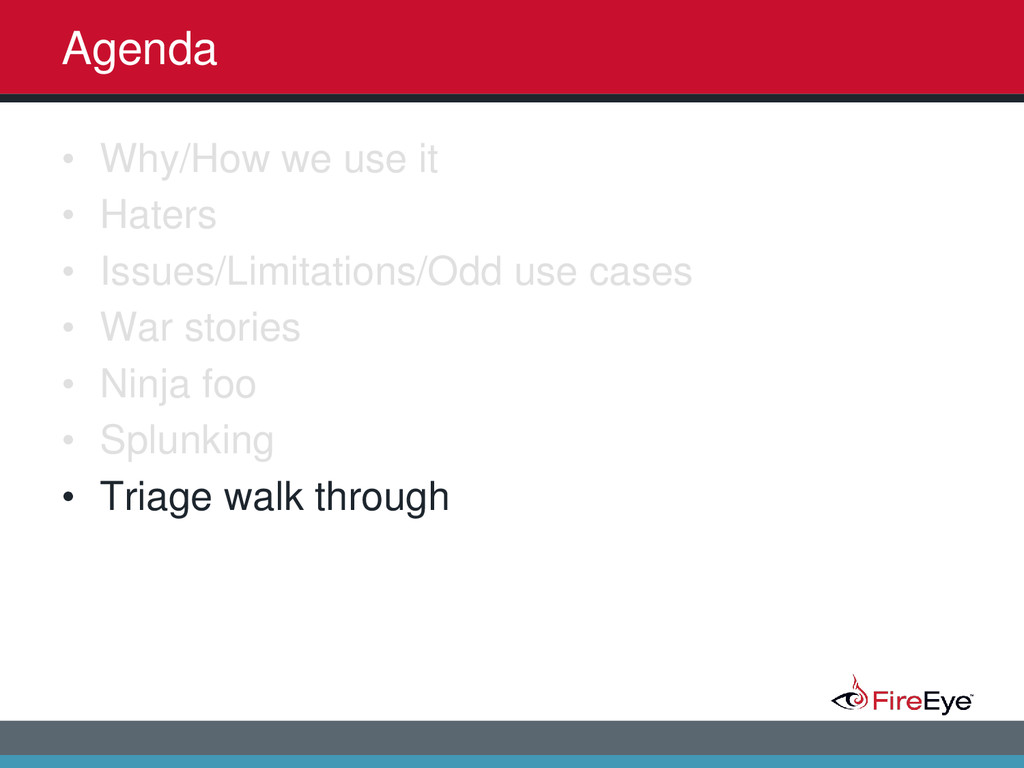
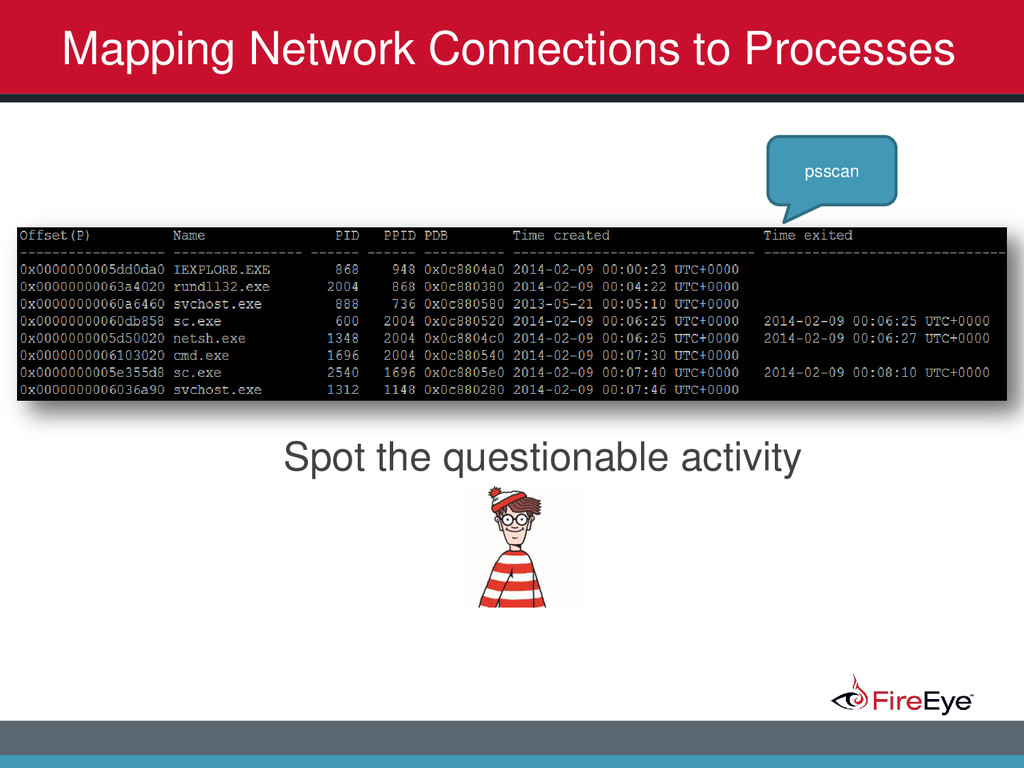
2014 <Primer /> Plugin/Tool Explanation connections Displays TCP connections that were active at the time of the memory acquisition. connscan Pool scans for _TCPT_OBJECT structures to find both active and terminated connections. sockets Displays sockets that were active at the time of the memory acquisition. sockscan Pool scans for _ADDRESS_OBJECT structures to find both active and terminated sockets. netscan Pool scans for TcpE, TcpL and UdpA structures (Vista+) to find both active and terminated connections/sockets. pslist Walks the doubly-linked list pointed to by PsActiveProcessHead and displays processes that were active at the time of the memory acquisition. psscan Pool scans for _EPROCESS structures to find both active and terminated processes. psxview Displays a cross-view table indicating whether or not a particular process was found in a certain table/list/pool scan.
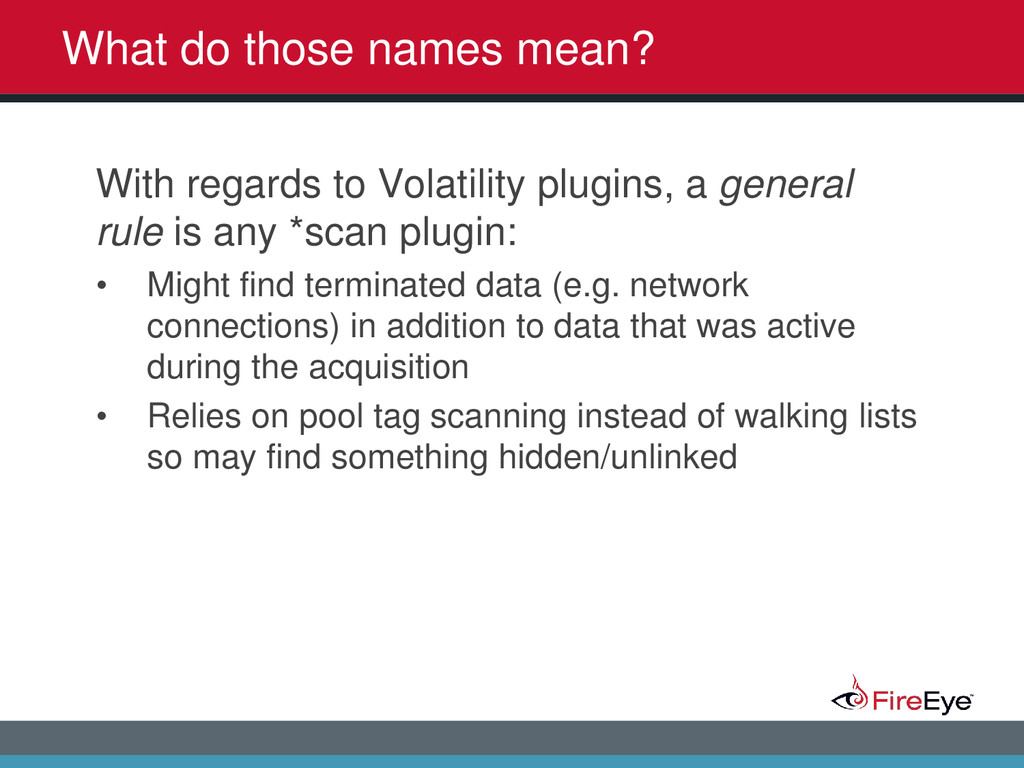
2014 What do those names mean? With regards to Volatility plugins, a general rule is any *scan plugin: • Might find terminated data (e.g. network connections) in addition to data that was active during the acquisition • Relies on pool tag scanning instead of walking lists so may find something hidden/unlinked
2014 <Primer /> Plugin/Tool Explanation consoles Searches the memory of csrss.exe/conhost.exe for the CONSOLE_INFORMATION structure and displays the entire screen buffer (Input & Output). cmdscan Searches the memory of csrss.exe/conhost.exe for the COMMAND_HISTORY structure but only displays the Input contents. It can also find commands from both active and closed consoles.
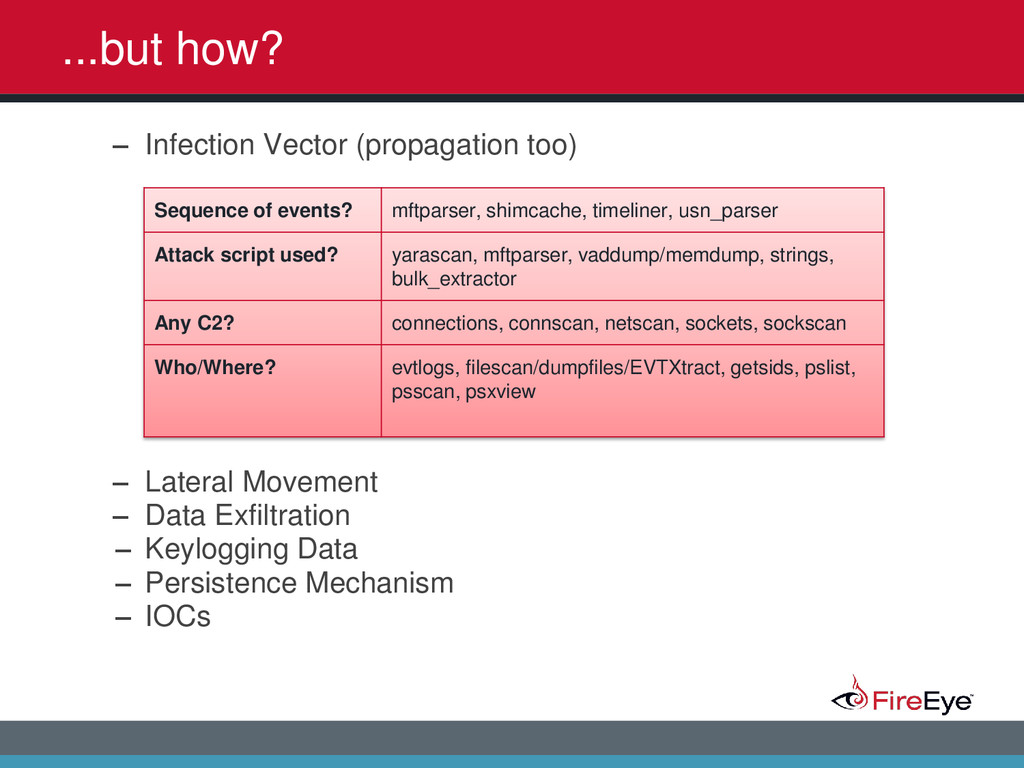
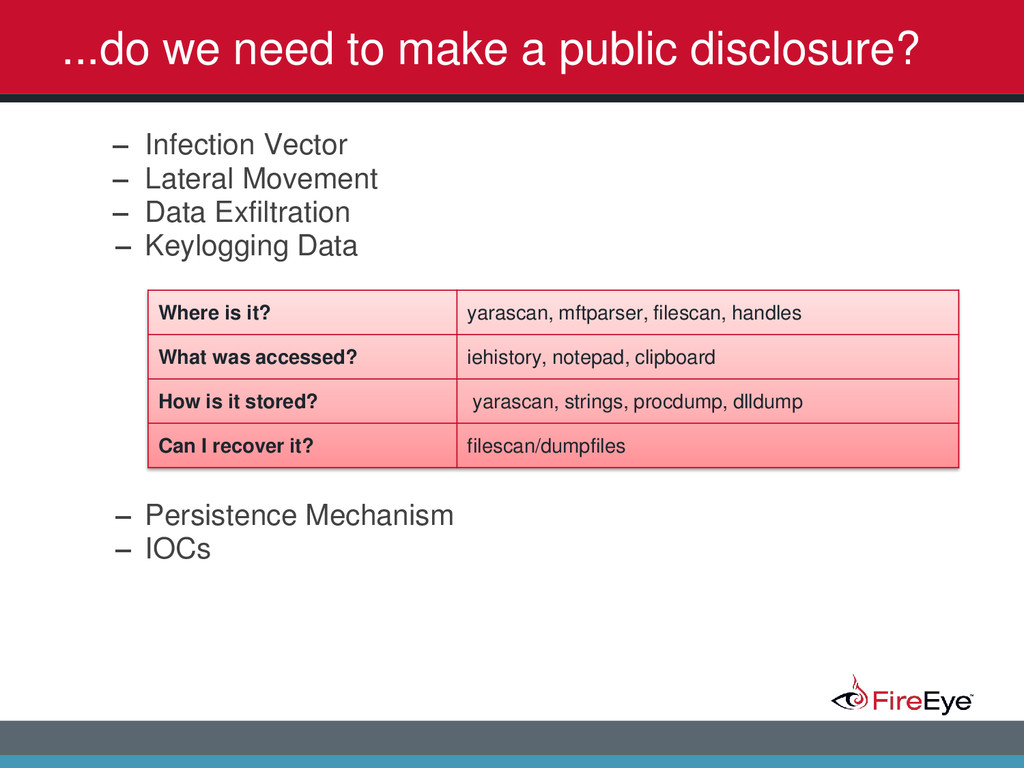
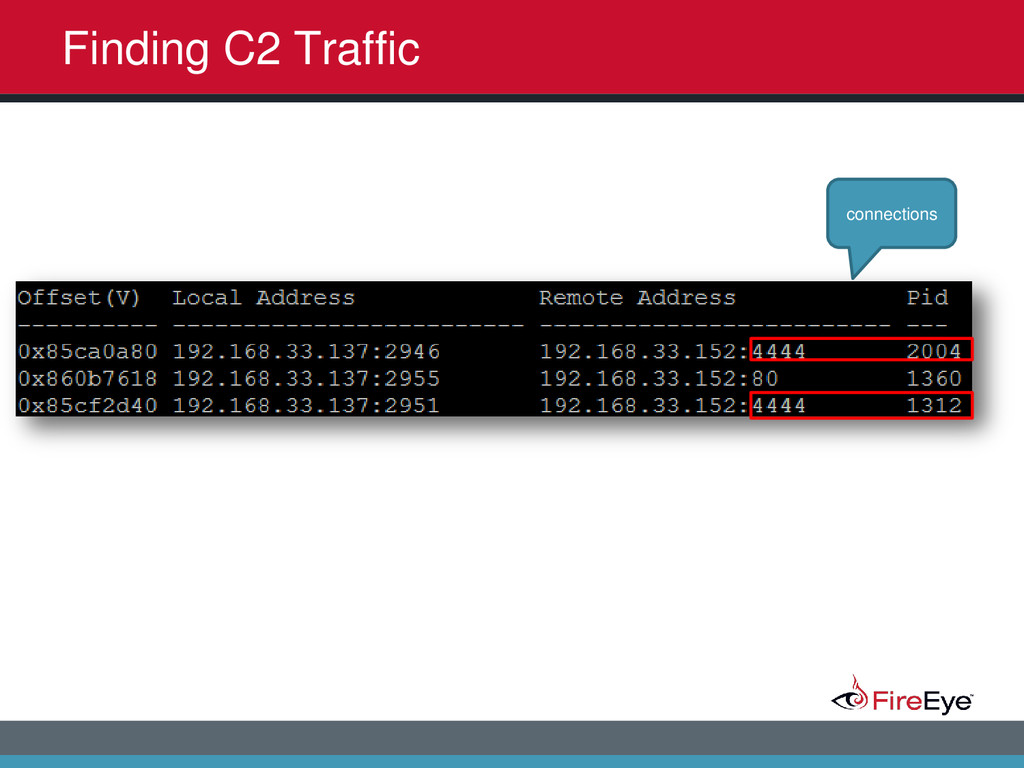
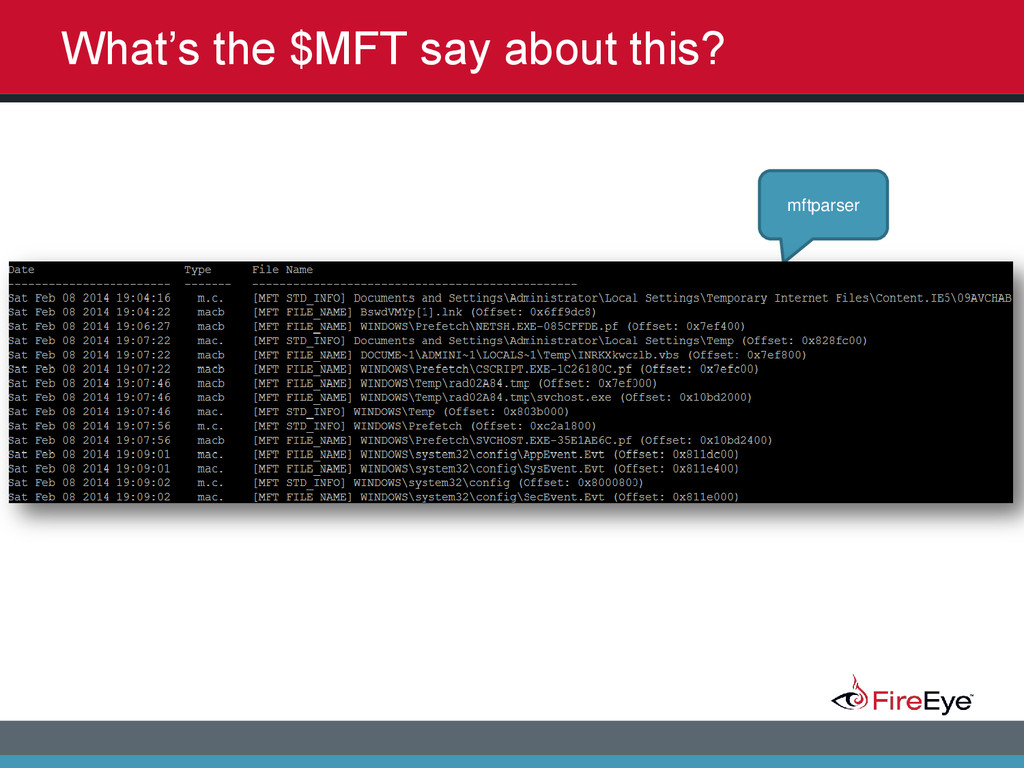
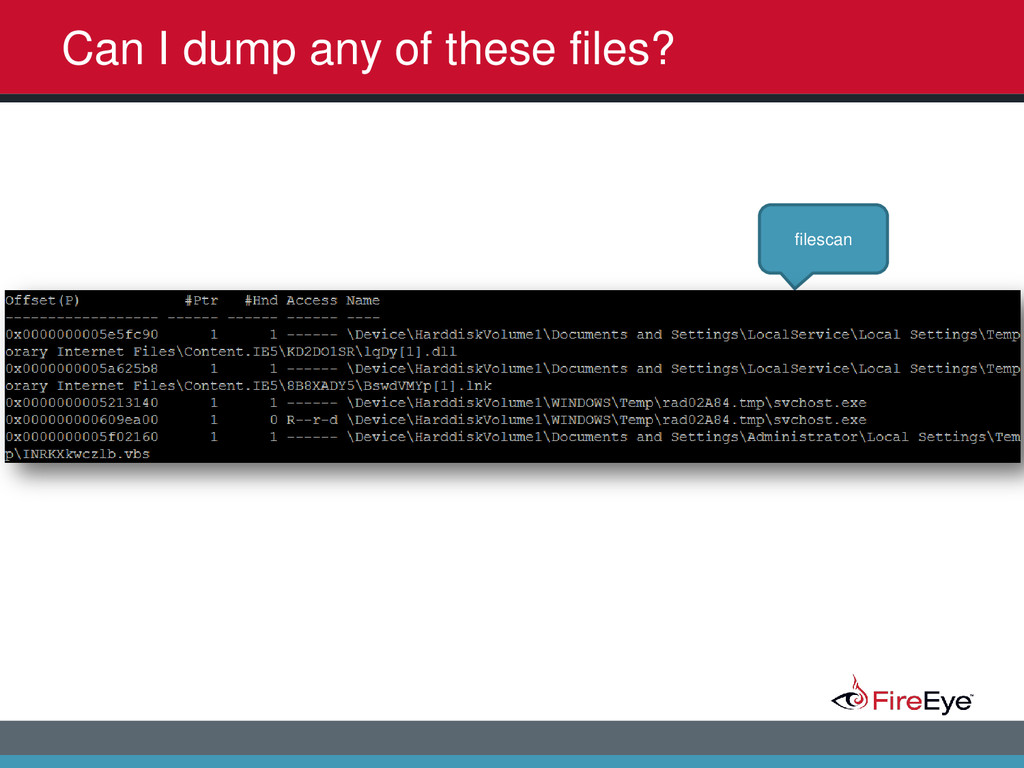
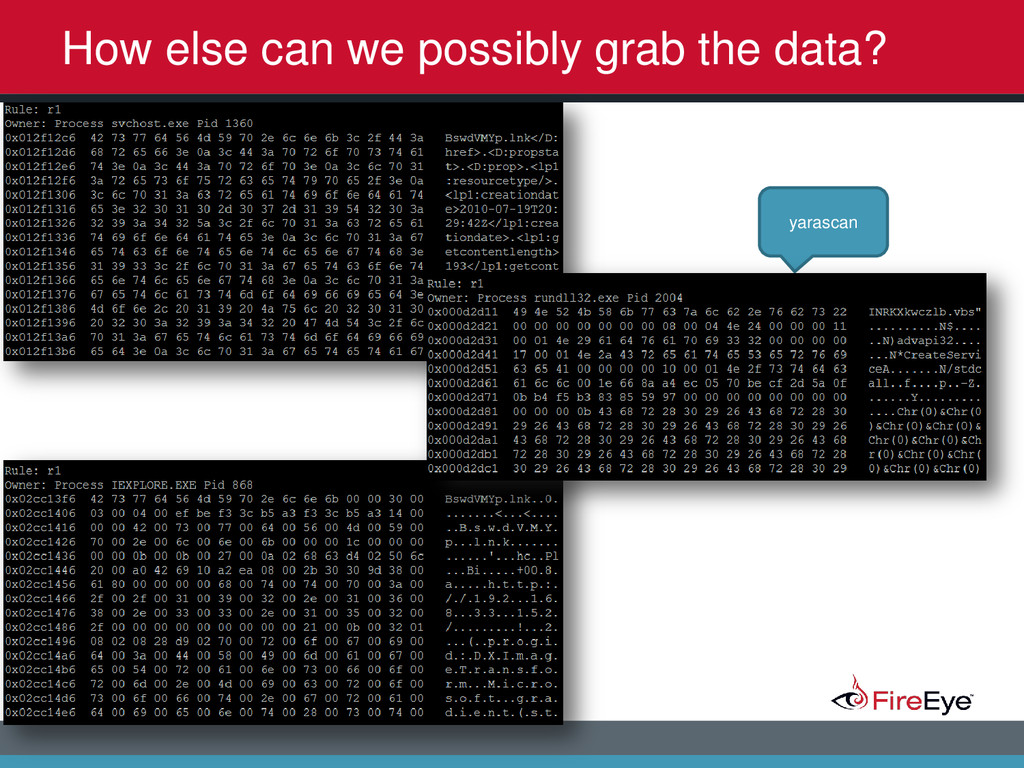
2014 ...do we need to make a public disclosure? – Infection Vector – Lateral Movement – Data Exfiltration – Keylogging Data – Persistence Mechanism – IOCs Where is it? yarascan, mftparser, filescan, handles What was accessed? iehistory, notepad, clipboard How is it stored? yarascan, strings, procdump, dlldump Can I recover it? filescan/dumpfiles
2014 ...how is it still generating alerts? – Infection Vector – Lateral Movement – Data Exfiltration – Keylogging Data – Persistence Mechanism – IOCs Where is it? printkey/hivedump, mftparser, mbrparser, svcscan, hashdump
2014 • The system is a critical server • There’s no way you can get everything you need by solely analyzing a memory dump • It takes too long to acquire memory • Over the network acquisitions are difficult …haters gon’ hate
2014 Memory can be manipulated with tools like ADD. – Yes, but it is very apparent when these types of tools are used. – Multiple ways to view similar data to find inconsistencies – e.g. - pslist vs. psscan – @JACKCR: http://blog.handlerdiaries.com/?p=363 Keep hat1n
2014 • VM’s • Corrupt dumps? • Possibly missing data from artifacts (paged?) • That thing called Unicode (U+1F4A9) • The person creating the dump • Your toolkit hm, that's odd… what went wrong?
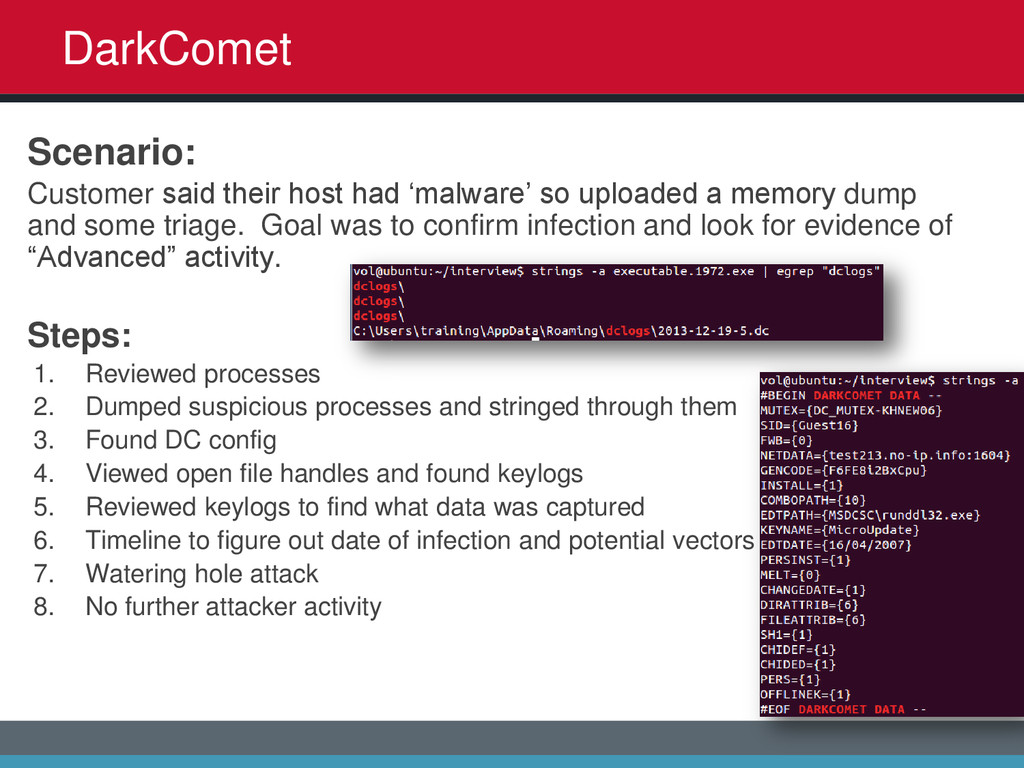
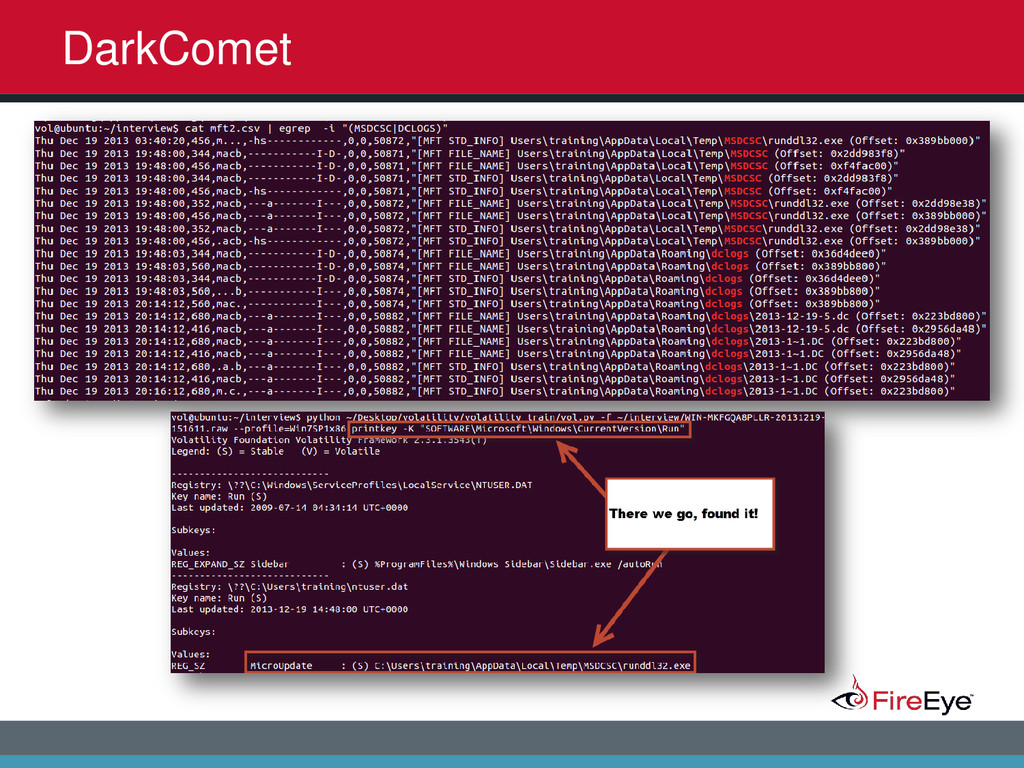
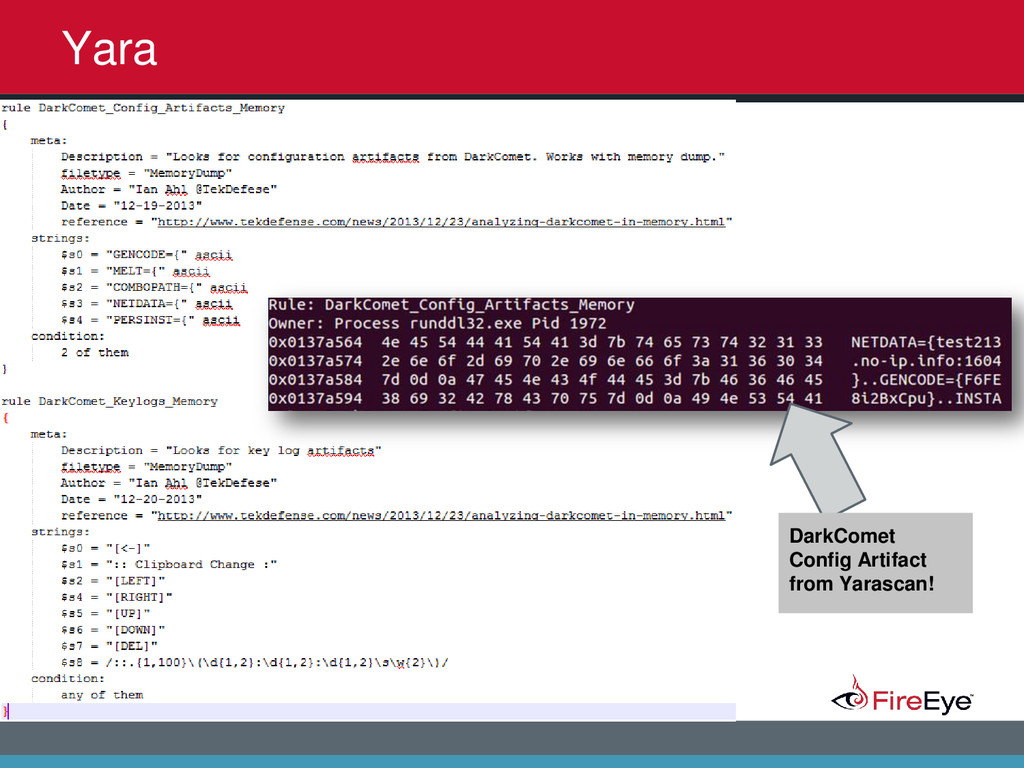
2014 Scenario: Customer said their host had ‘malware’ so uploaded a memory dump and some triage. Goal was to confirm infection and look for evidence of “Advanced” activity. Steps: 1. Reviewed processes 2. Dumped suspicious processes and stringed through them 3. Found DC config 4. Viewed open file handles and found keylogs 5. Reviewed keylogs to find what data was captured 6. Timeline to figure out date of infection and potential vectors 7. Watering hole attack 8. No further attacker activity DarkComet
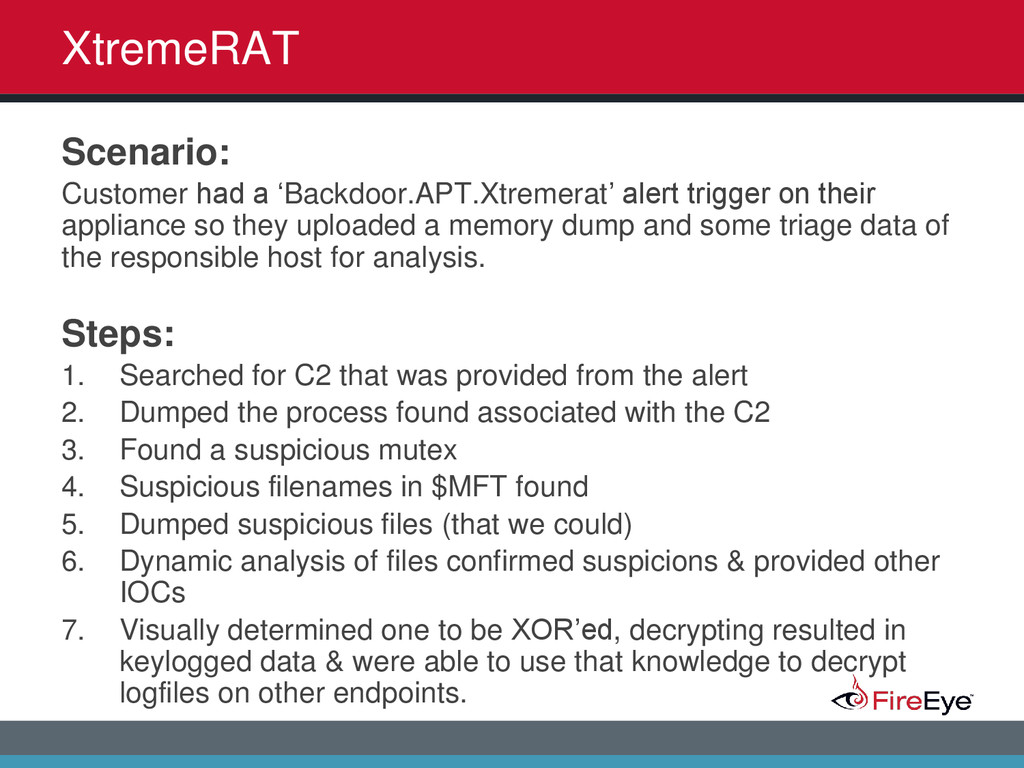
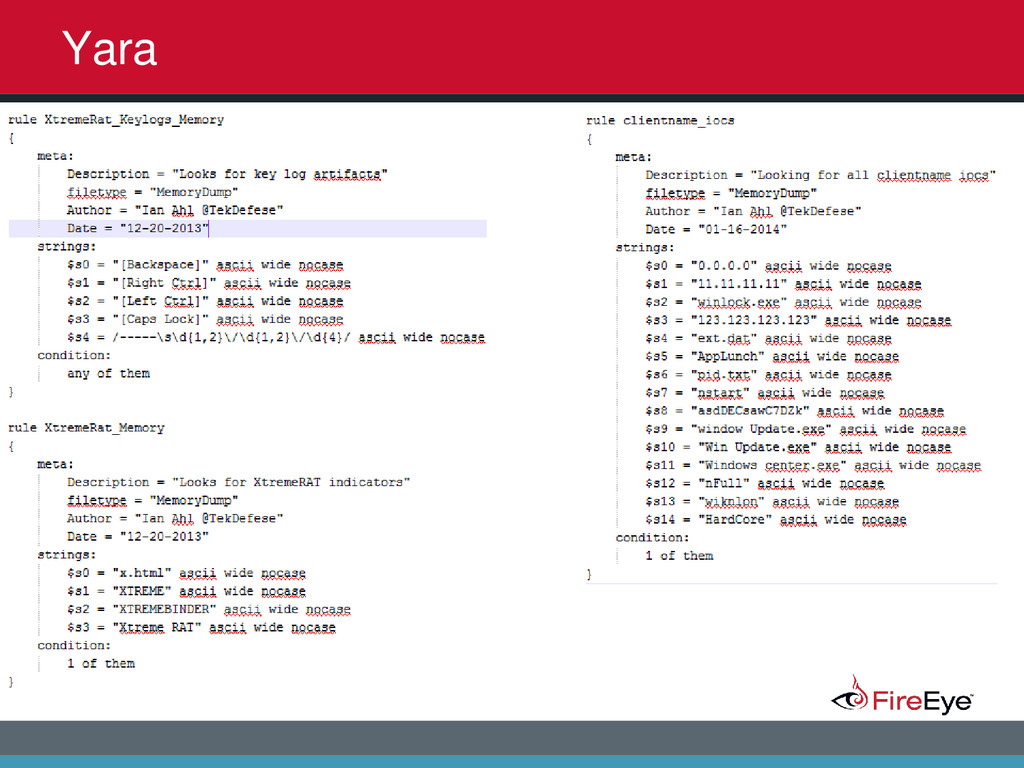
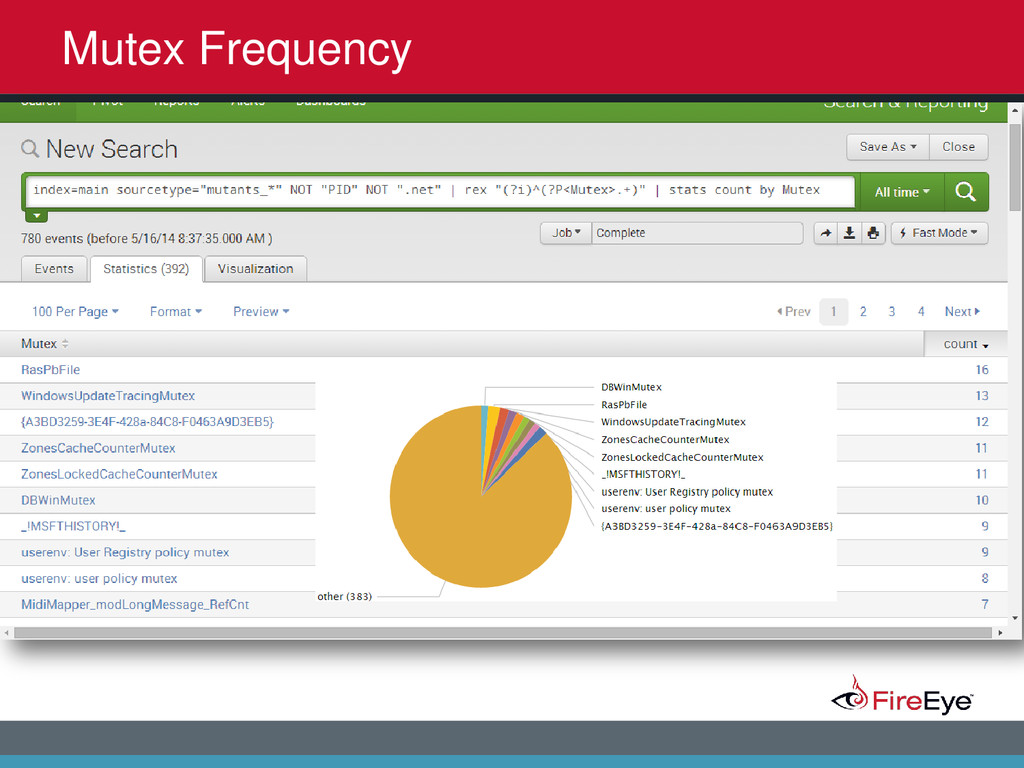
2014 Scenario: Customer had a ‘Backdoor.APT.Xtremerat’ alert trigger on their appliance so they uploaded a memory dump and some triage data of the responsible host for analysis. Steps: 1. Searched for C2 that was provided from the alert 2. Dumped the process found associated with the C2 3. Found a suspicious mutex 4. Suspicious filenames in $MFT found 5. Dumped suspicious files (that we could) 6. Dynamic analysis of files confirmed suspicions & provided other IOCs 7. Visually determined one to be XOR’ed, decrypting resulted in keylogged data & were able to use that knowledge to decrypt logfiles on other endpoints. XtremeRAT
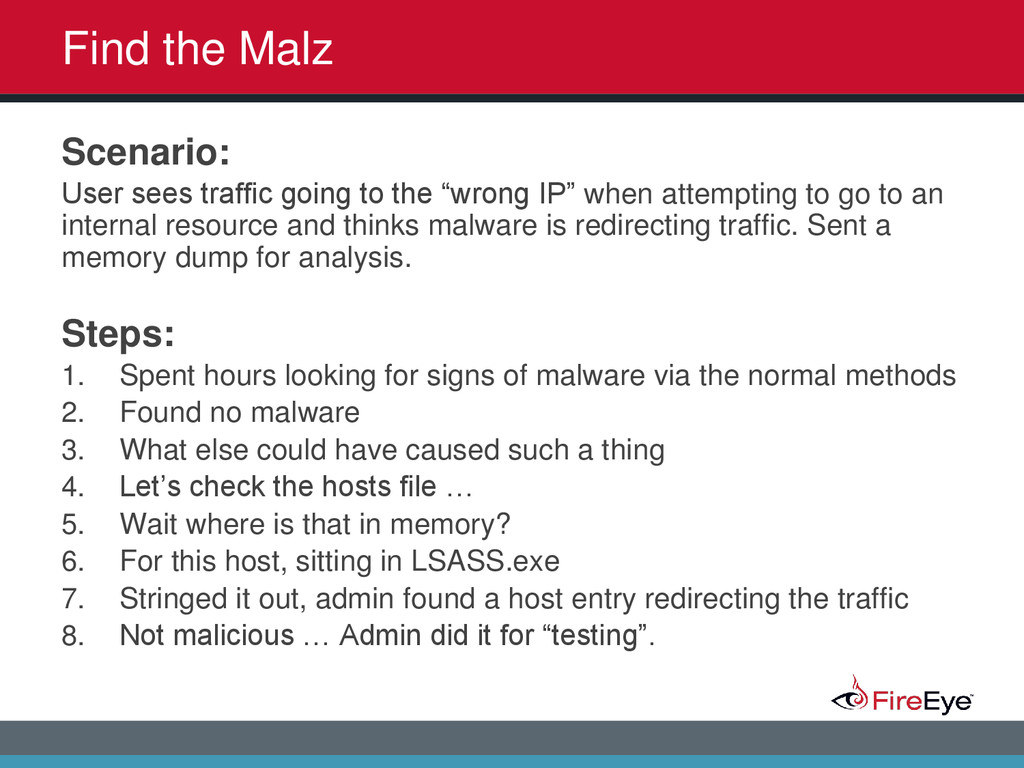
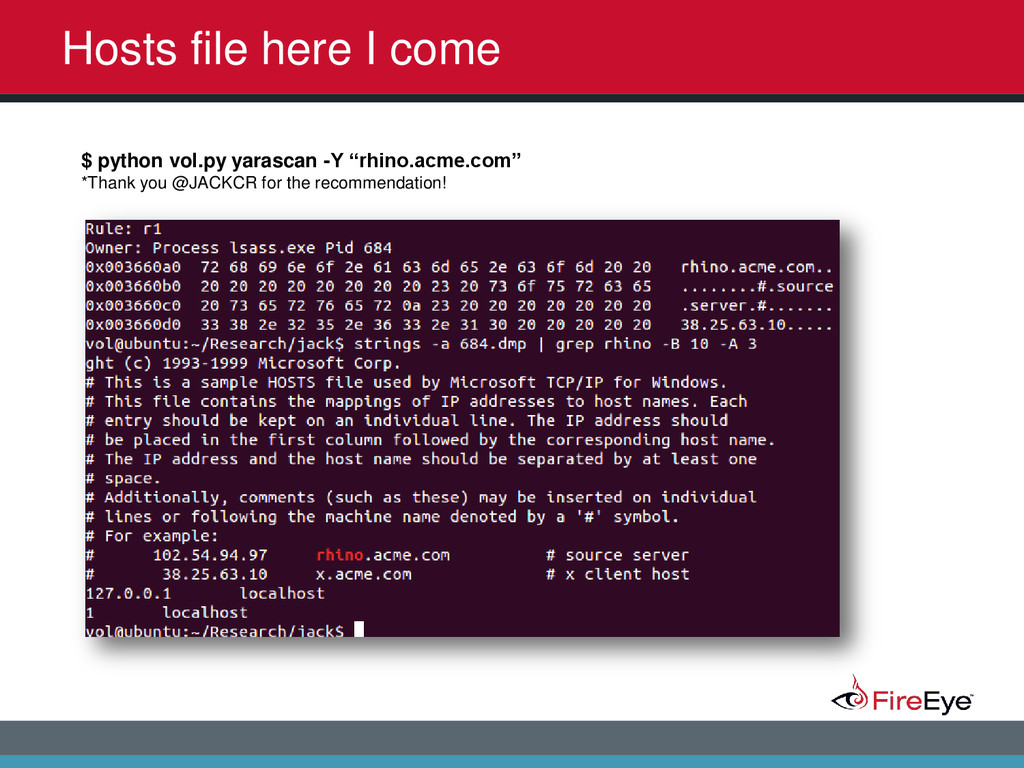
2014 Scenario: User sees traffic going to the “wrong IP” when attempting to go to an internal resource and thinks malware is redirecting traffic. Sent a memory dump for analysis. Steps: 1. Spent hours looking for signs of malware via the normal methods 2. Found no malware 3. What else could have caused such a thing 4. Let’s check the hosts file … 5. Wait where is that in memory? 6. For this host, sitting in LSASS.exe 7. Stringed it out, admin found a host entry redirecting the traffic 8. Not malicious … Admin did it for “testing”. Find the Malz
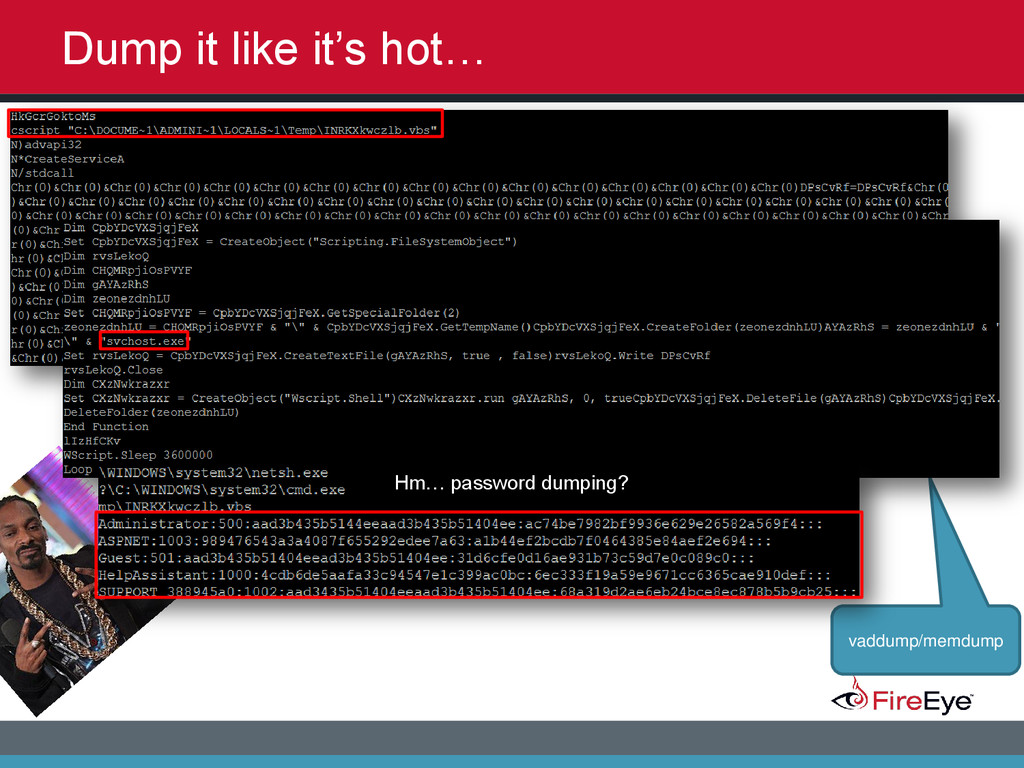
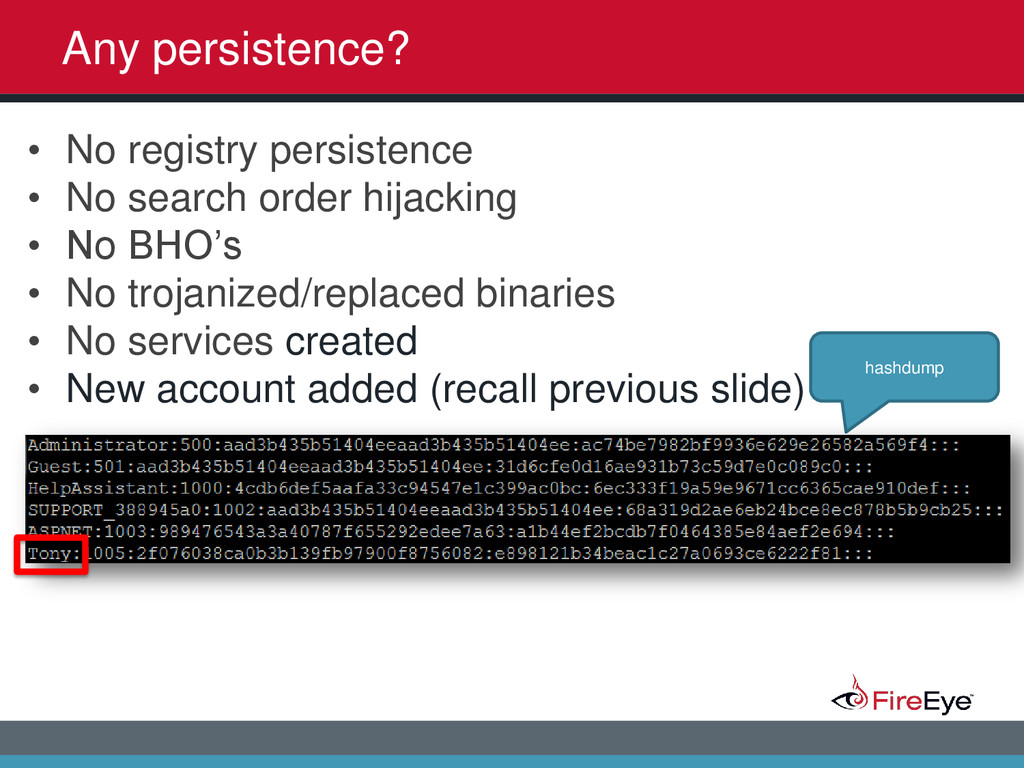
2014 Any persistence? hashdump • No registry persistence • No search order hijacking • No BHO’s • No trojanized/replaced binaries • No services created • New account added (recall previous slide)