Upgrade to PRO for Only $50/Year—Limited-Time Offer! 🔥

Drawing graphs with matplotlib

Avatar for HK HK
February 25, 2014

Drawing graphs with matplotlib

Avatar for HK

HK

February 25, 2014
Tweet

More Decks by HK

Other Decks in Technology

Transcript

  1. DRAWING GRAPHS WITH PYTHON AND MATPLOTLIB Hiro Kai Zoom out

    (Ctrl+- (Windows) or ⌘‐ (Mac)) if you see cropped slides.
  2. ABOUT THE TUTORIALS I'll try to make the tutorial practical

    as well as informative for learning Python's language features. Choice of content is flexible. Let me know if you have anything you want to work on. Any question is welcome. for resources and data for the tutorial Links
  3. GRAPH DRAWING BY SCRIPTING: MOTIVATION I made this array of

    graphs many times with different data sets. It is tedious to draw these graphs again and again by hand. Automation by a Python script helps you try different settings (color, size, line width, etc.) with consistency for all graphs
  4. WORKFLOW OF GRAPH DRAWING 1. Write a script to read

    a data file to draw a graph. 2. Prepare a raw data file as a csv file: readable for a script. 3. Use a library to draw a graph. matplotlib
  5. THE SIMPLEST EXAMPLE: SCATTER PLOT i m p o r

    t m a t p l o t l i b . p y p l o t a s p l t x s = [ 0 , 1 , 2 , 3 , 4 , 5 , 6 ] y s = [ x * x f o r x i n x s ] p l t . s c a t t e r ( x s , y s ) p l t . s h o w ( )
  6. WHAT IT DOES Import a module and give it a

    name p l t Make a data set as lists Plot the data using a function in p l t module, and show the graph window. i m p o r t m a t p l o t l i b . p y p l o t a s p l t x s = [ 0 , 1 , 2 , 3 , 4 , 5 , 6 ] y s = [ x * x f o r x i n x s ] p l t . s c a t t e r ( x s , y s ) p l t . s h o w ( )
  7. MODULES AND NAMESPACES (1) Module is a set of code

    that is reusable by other programs. Libraries are supplied as modules. By default, functions imported from modules are put in a separate namespace from the main namespace. Namespace is a mechanism to organize the names of many functions into separate sections, so that you avoid conflict of identifiers (different things must have different identifiers). Namespaces can be nested. Names under nested namespaces are accessed by chaining names with . (dot). i m p o r t m a t p l o t l i b . p y p l o t m a t p l o t l i b . p y p l o t . s c a t t e r ( [ 1 , 2 , 3 ] , [ 1 , 4 , 9 ] )
  8. MODULES AND NAMESPACES (2) You can also put the imported

    functions to other namespaces than default i m p o r t X a s Y imports all the functions under X into Y namespace. f r o m X i m p o r t * imports all the functions under X into the main namespace. i m p o r t m a t p l o t l i b . p y p l o t a s p l t # s c a t t e r i s p l t n a m e s p a c e p l t . s c a t t e r ( [ 1 , 2 , 3 ] , [ 1 , 4 , 9 ] ) f r o m m a t p l o t l i b . p y p l o t i m p o r t * # s c a t t e r i s i n t h e m a i n n a m e s p a c e . Y o u d o n ' t n e e d t o p r e f i x s c a t t e r . s c a t t e r ( [ 1 , 2 , 3 ] , [ 1 , 4 , 9 ] )
  9. CLASSES AND OBJECTS OBJECT-ORIENTED PROGRAMMING Object is a set of

    data (called data attributes) and functions (methods) to manipulate them. Class is a template for generating objects. Class has definitions of methods and attributes. You can access data attributes and methods of an object by . (dot). # L i s t i s a c t u a l l y a n o b j e c t . x s = [ 1 , 2 , 5 , 3 ] # x s i s a n o b j e c t o f L i s t c l a s s x s . a p p e n d ( 7 ) # a p p e n d i s a m e t h o d o f L i s t c l a s s # E x a m p l e f r o m n u m p y , a n u m e r i c a l c a l c u l a t i o n l i b r a r y . # h t t p : / / d o c s . s c i p y . o r g / d o c / n u m p y / r e f e r e n c e / g e n e r a t e d / n u m p y . m a t r i x . h t m l i m p o r t n u m p y a s n p a = n p . m a t r i x ( [ [ 1 , 2 ] , [ 3 , 4 ] ] ) p r i n t ( a . s i z e ) # s i z e i s a n a t t r i b u t e o f m a t r i x a .
  10. USER-DEFINED CLASS Example: P o i n t class that

    defines the properties and behavior of a point in a 2D coordinate. See for full definition of P o i n t this code # I n i t i a l i z i n g P o i n t o b j e c t s w i t h ( x , y ) c o o r d i n a t e s . p 1 = P o i n t ( 1 0 , 3 ) p 2 = P o i n t ( 1 , 0 ) p r i n t ( p 1 . x , p 1 . y , p 2 . x , p 2 . y ) # ( 1 0 , 3 , 1 , 0 ) p r i n t ( d i s t a n c e ( p 1 , p 2 ) ) # 9 . 4 8 6 8 3 2 9 8 0 5 1 # C a l l i n g a m e t h o d o f p 2 t o c h a n g e a t t r i b u t e s . p 2 . s h i f t ( 2 , 3 ) p r i n t ( p 2 ) # P o i n t ( 3 , 3 ) p 1 and p 2 are instances of P o i n t class. x and y belong to each object, so p 1 and p 2 have different x and y values. s h i f t is a method of P o i n t class to manipulate its instance.
  11. SCOPE OF VARIABLES Variables are only "visible" in a function

    and class where the variables are defined. y = 3 d e f f ( x ) : z = 4 r e t u r n x * y * z p r i n t ( f ( 2 ) ) # 2 4 p r i n t ( z ) # E r r o r Inner scope hides the variable in the outside scope if the name is same d e f f ( x ) : r e t u r n x * y d e f g ( x ) : y = 4 # T h i s s h a d o w s a v a r i a b l e y o u t s i d e . r e t u r n x * y y = 3 p r i n t ( f ( 2 ) ) # 6
  12. A CSV FILE IS USED FOR INPUT DATA A comma-separated

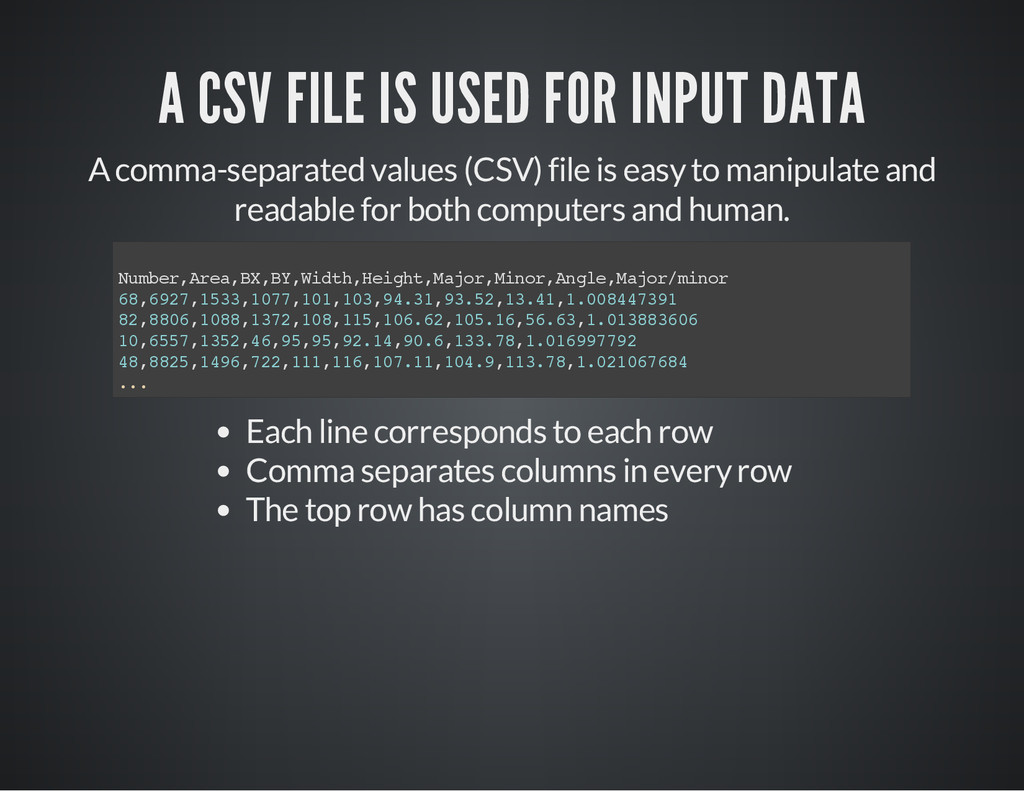
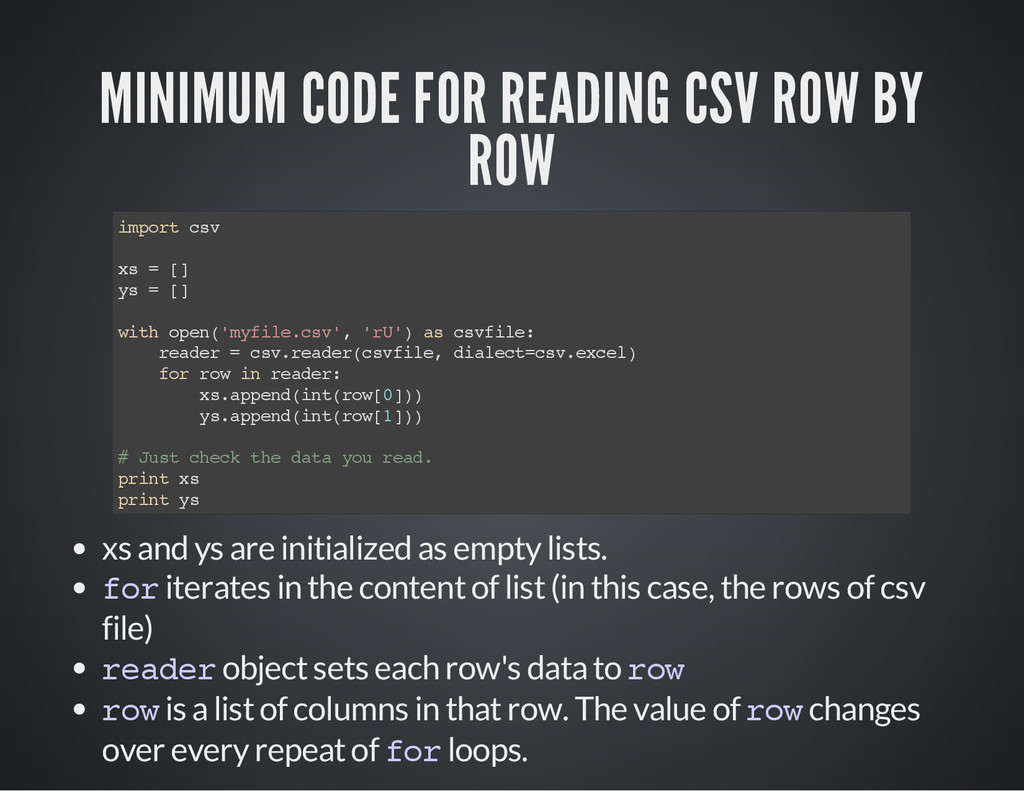
    values (CSV) file is easy to manipulate and readable for both computers and human. N u m b e r , A r e a , B X , B Y , W i d t h , H e i g h t , M a j o r , M i n o r , A n g l e , M a j o r / m i n o r 6 8 , 6 9 2 7 , 1 5 3 3 , 1 0 7 7 , 1 0 1 , 1 0 3 , 9 4 . 3 1 , 9 3 . 5 2 , 1 3 . 4 1 , 1 . 0 0 8 4 4 7 3 9 1 8 2 , 8 8 0 6 , 1 0 8 8 , 1 3 7 2 , 1 0 8 , 1 1 5 , 1 0 6 . 6 2 , 1 0 5 . 1 6 , 5 6 . 6 3 , 1 . 0 1 3 8 8 3 6 0 6 1 0 , 6 5 5 7 , 1 3 5 2 , 4 6 , 9 5 , 9 5 , 9 2 . 1 4 , 9 0 . 6 , 1 3 3 . 7 8 , 1 . 0 1 6 9 9 7 7 9 2 4 8 , 8 8 2 5 , 1 4 9 6 , 7 2 2 , 1 1 1 , 1 1 6 , 1 0 7 . 1 1 , 1 0 4 . 9 , 1 1 3 . 7 8 , 1 . 0 2 1 0 6 7 6 8 4 . . . Each line corresponds to each row Comma separates columns in every row The top row has column names
  13. MINIMUM CODE FOR READING CSV ROW BY ROW i m

    p o r t c s v x s = [ ] y s = [ ] w i t h o p e n ( ' m y f i l e . c s v ' , ' r U ' ) a s c s v f i l e : r e a d e r = c s v . r e a d e r ( c s v f i l e , d i a l e c t = c s v . e x c e l ) f o r r o w i n r e a d e r : x s . a p p e n d ( i n t ( r o w [ 0 ] ) ) y s . a p p e n d ( i n t ( r o w [ 1 ] ) ) # J u s t c h e c k t h e d a t a y o u r e a d . p r i n t x s p r i n t y s xs and ys are initialized as empty lists. f o r iterates in the content of list (in this case, the rows of csv file) r e a d e r object sets each row's data to r o w r o w is a list of columns in that row. The value of r o w changes over every repeat of f o r loops.
  14. COMBINING CSV READING AND PLOTTING i m p o r

    t c s v i m p o r t m a t p l o t l i b . p y p l o t a s p l t x s = [ ] ; y s = [ ] w i t h o p e n ( ' m y f i l e . c s v ' , ' r U ' ) a s c s v f i l e : r e a d e r = c s v . r e a d e r ( c s v f i l e ) r e a d e r . n e x t ( ) # S k i p a t o p r o w f o r r o w i n r e a d e r : x s . a p p e n d ( f l o a t ( r o w [ 6 ] ) ) y s . a p p e n d ( f l o a t ( r o w [ 7 ] ) ) p l t . s c a t t e r ( x s , y s ) # S e t t i n g a x i s r a n g e s . p l t . x l i m ( [ 0 , 2 0 0 ] ) ; p l t . y l i m ( [ 0 , 2 0 0 ] ) p l t . s h o w ( )
  15. PLAYING AROUND WITH STYLES (TO BE EXPLAINED IN THE TUTORIAL)

    Bubble chart Ticks Line plot See to find many more examples. gallery
  16. Scripts are great for repeating things in a consistent manner.

    THE POWER OF AUTOMATION 1. Make a list of data sets, conditions, etc. 2. Feed each of them into a drawing function repeatedly.
  17. Define functions to do repeated tasks. In our case, USING

    USER-DEFINED FUNCTIONS 1. Define a function to draw a single graph. 2. Repeatedly call the function defined above with varied parameters to vary outputs. See example code