• Why Tech Debt Happens? • How It Hurts Business (with metrics)? • Real-World Examples & Dollar Value • Making the Business Case (Framework) • Wrap-up & Q&A
quality tomorrow. What Is Technical Debt? It’s like taking a shortcut in code, architecture, or process. It helps now, but someone will pay the interest later — in the form of bugs, delays, or outages.
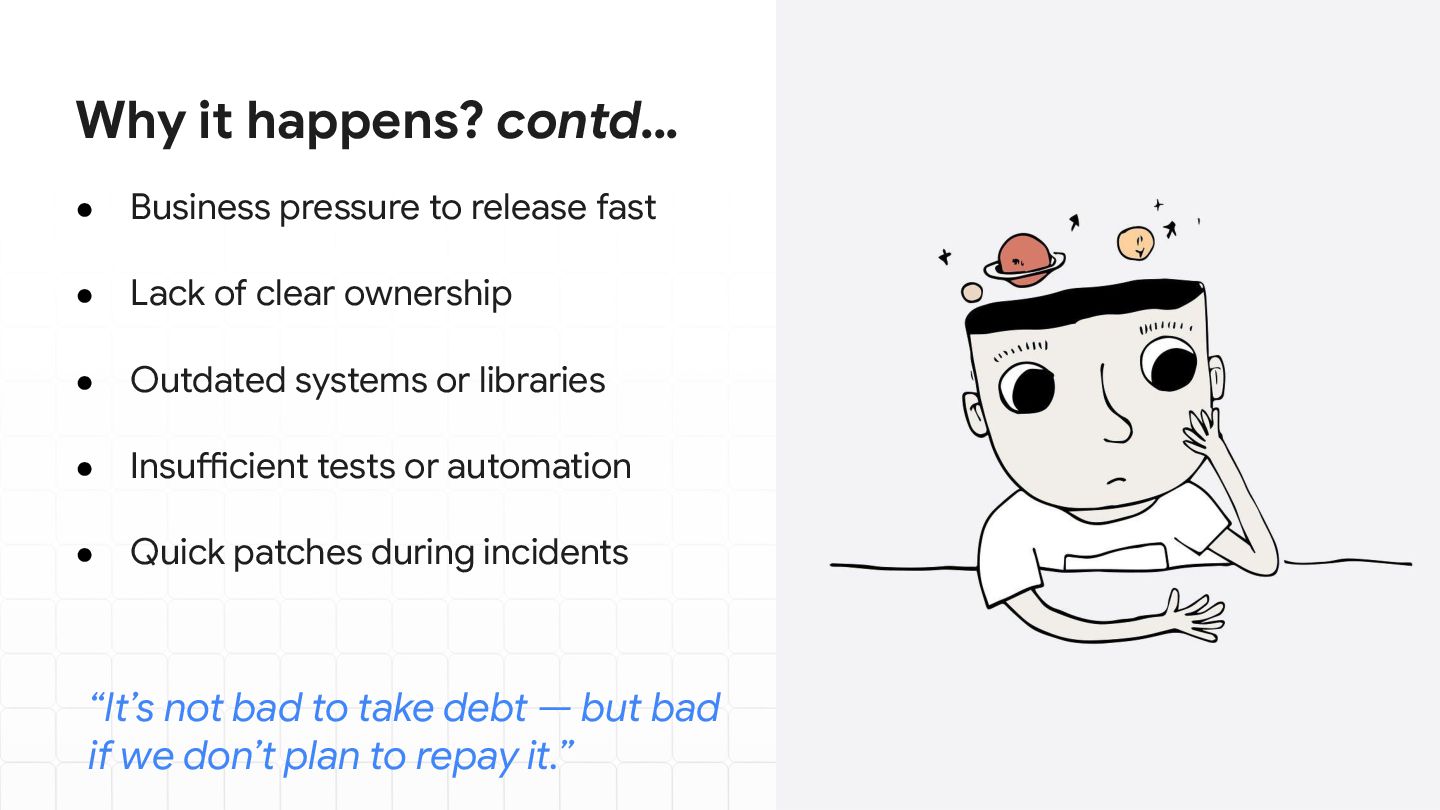
• Lack of clear ownership • Outdated systems or libraries • Insufficient tests or automation • Quick patches during incidents “It’s not bad to take debt — but bad if we don’t plan to repay it.”
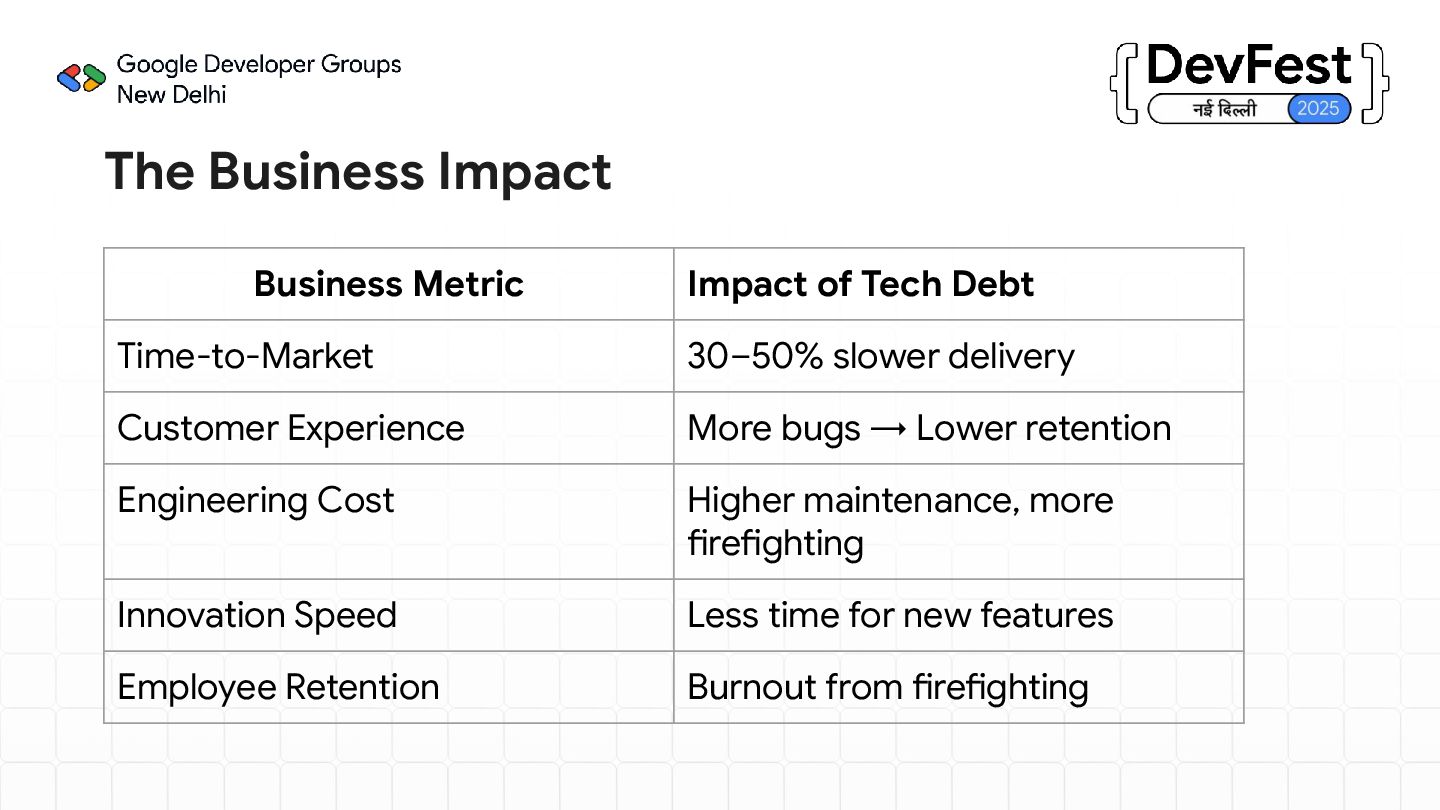
30–50% slower delivery Customer Experience More bugs → Lower retention Engineering Cost Higher maintenance, more firefighting Innovation Speed Less time for new features Employee Retention Burnout from firefighting
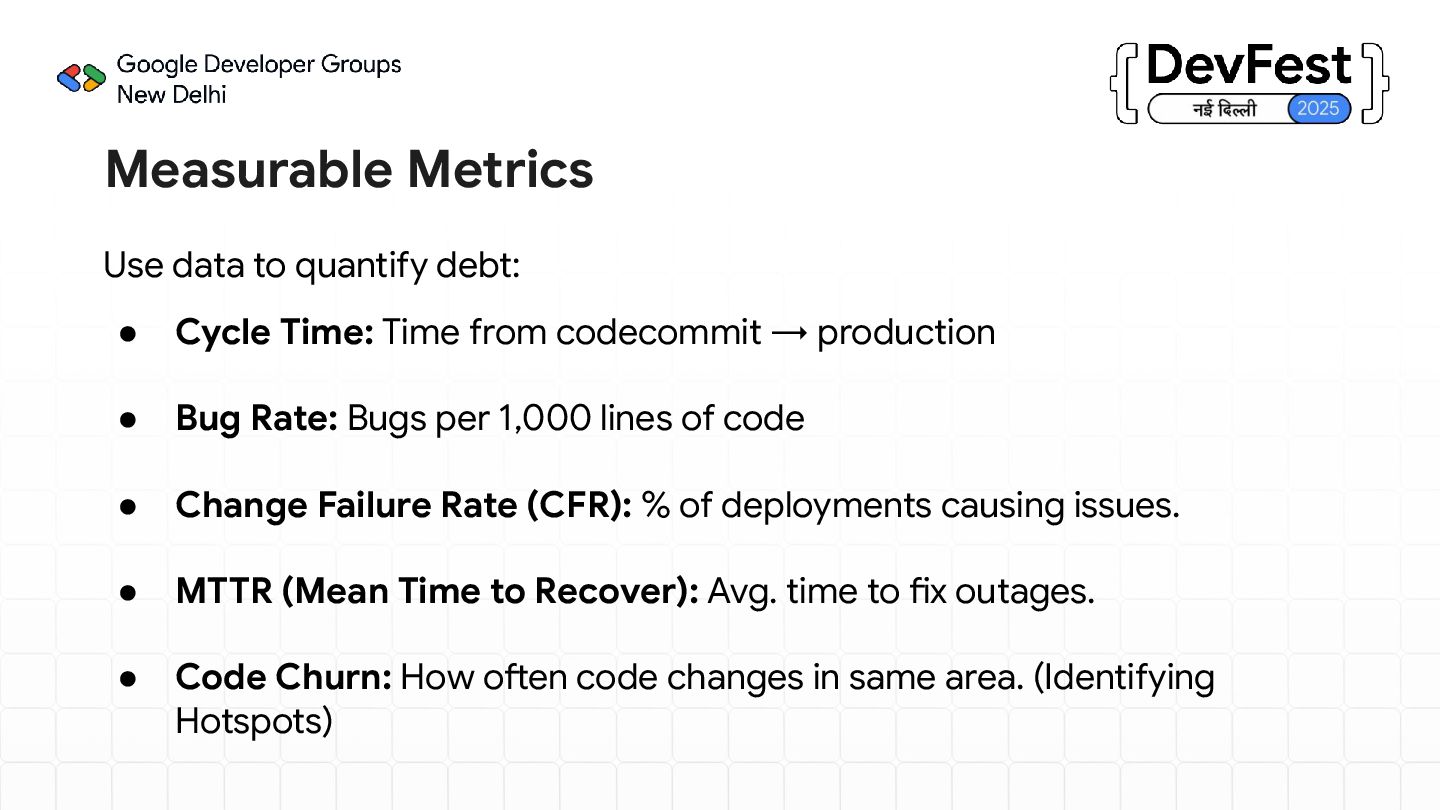
Time from codecommit → production • Bug Rate: Bugs per 1,000 lines of code • Change Failure Rate (CFR): % of deployments causing issues. • MTTR (Mean Time to Recover): Avg. time to fix outages. • Code Churn: How often code changes in same area. (Identifying Hotspots)
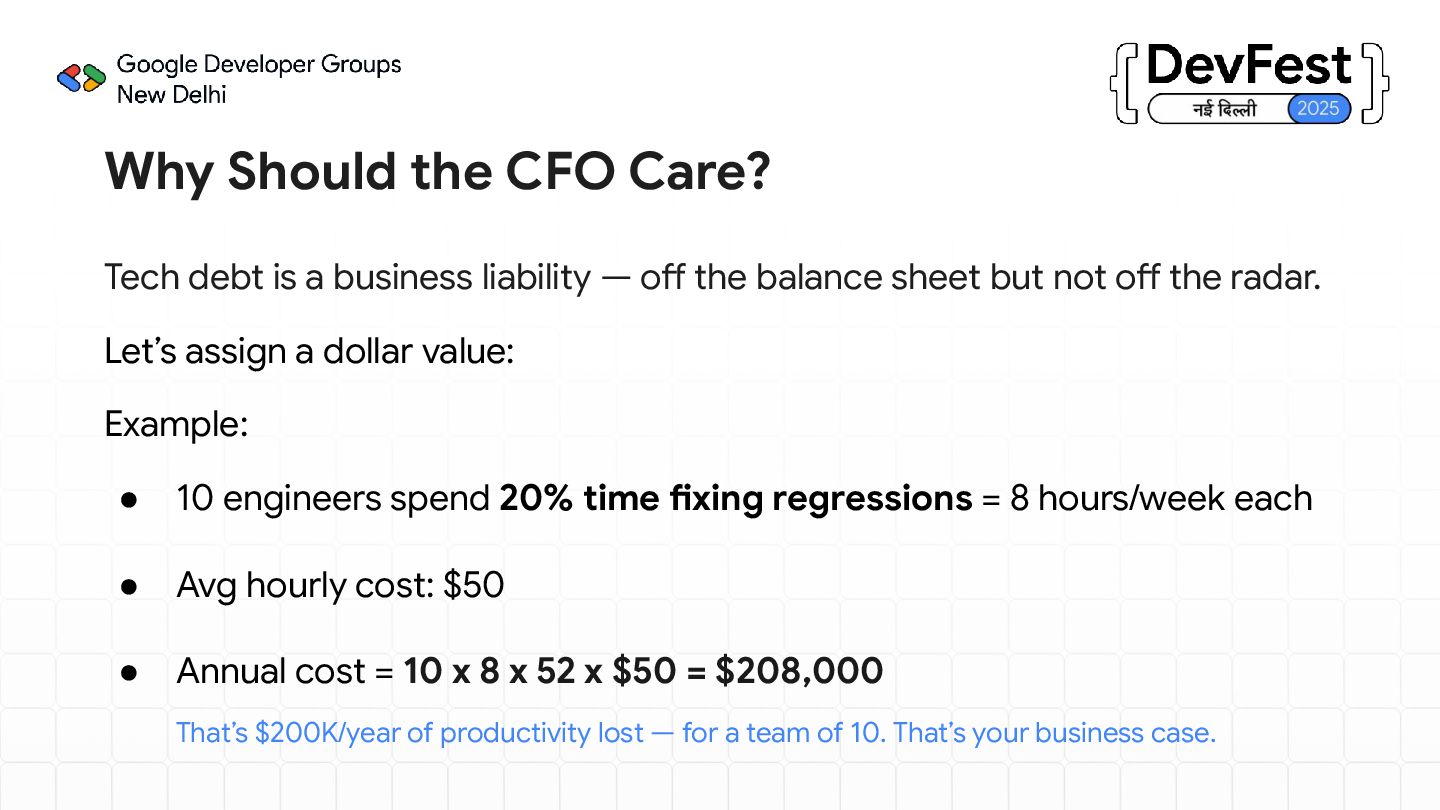
liability — off the balance sheet but not off the radar. Let’s assign a dollar value: Example: • 10 engineers spend 20% time fixing regressions = 8 hours/week each • Avg hourly cost: $50 • Annual cost = 10 x 8 x 52 x $50 = $208,000 That’s $200K/year of productivity lost — for a team of 10. That’s your business case.
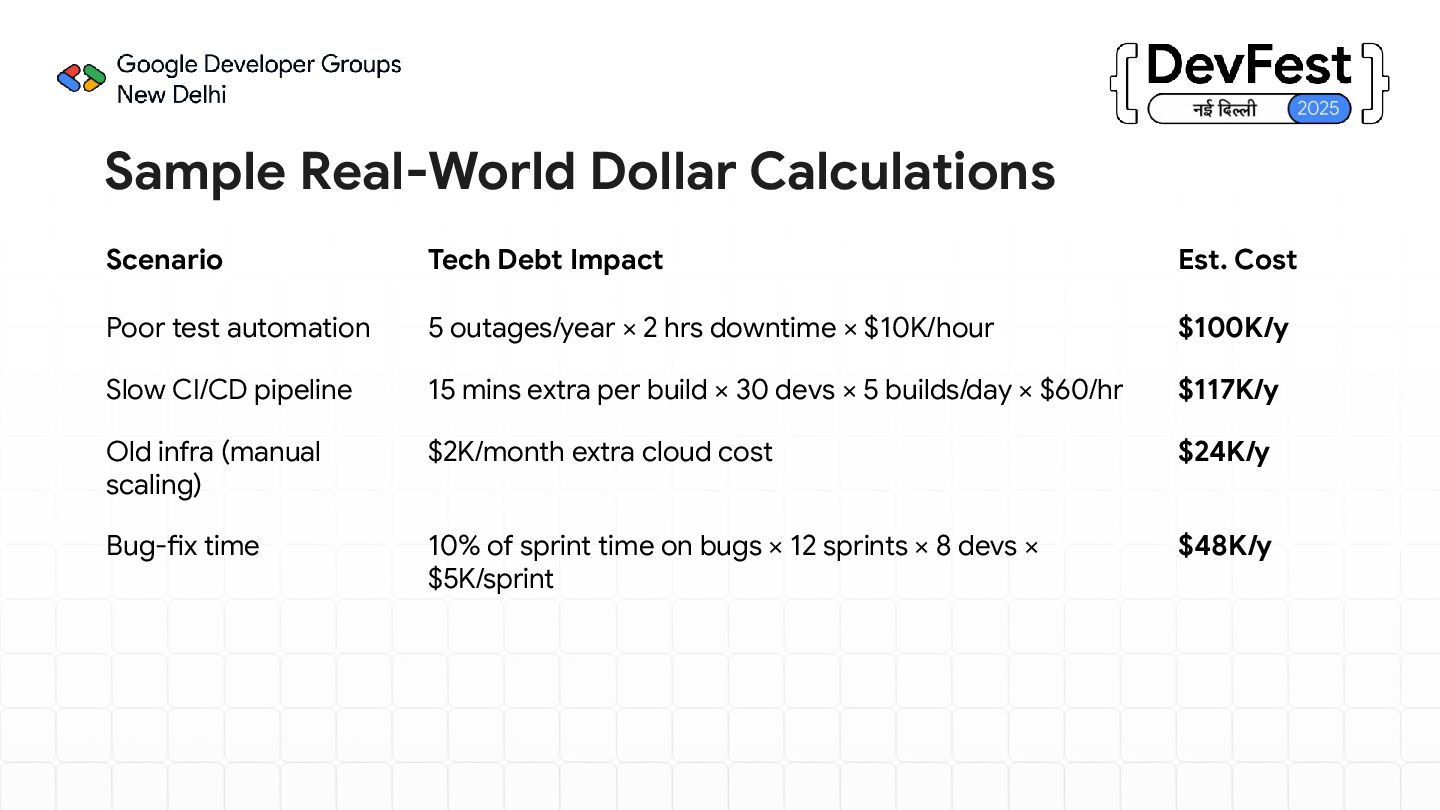
Poor test automation 5 outages/year × 2 hrs downtime × $10K/hour $100K/y Slow CI/CD pipeline 15 mins extra per build × 30 devs × 5 builds/day × $60/hr $117K/y Old infra (manual scaling) $2K/month extra cloud cost $24K/y Bug-fix time 10% of sprint time on bugs × 12 sprints × 8 devs × $5K/sprint $48K/y
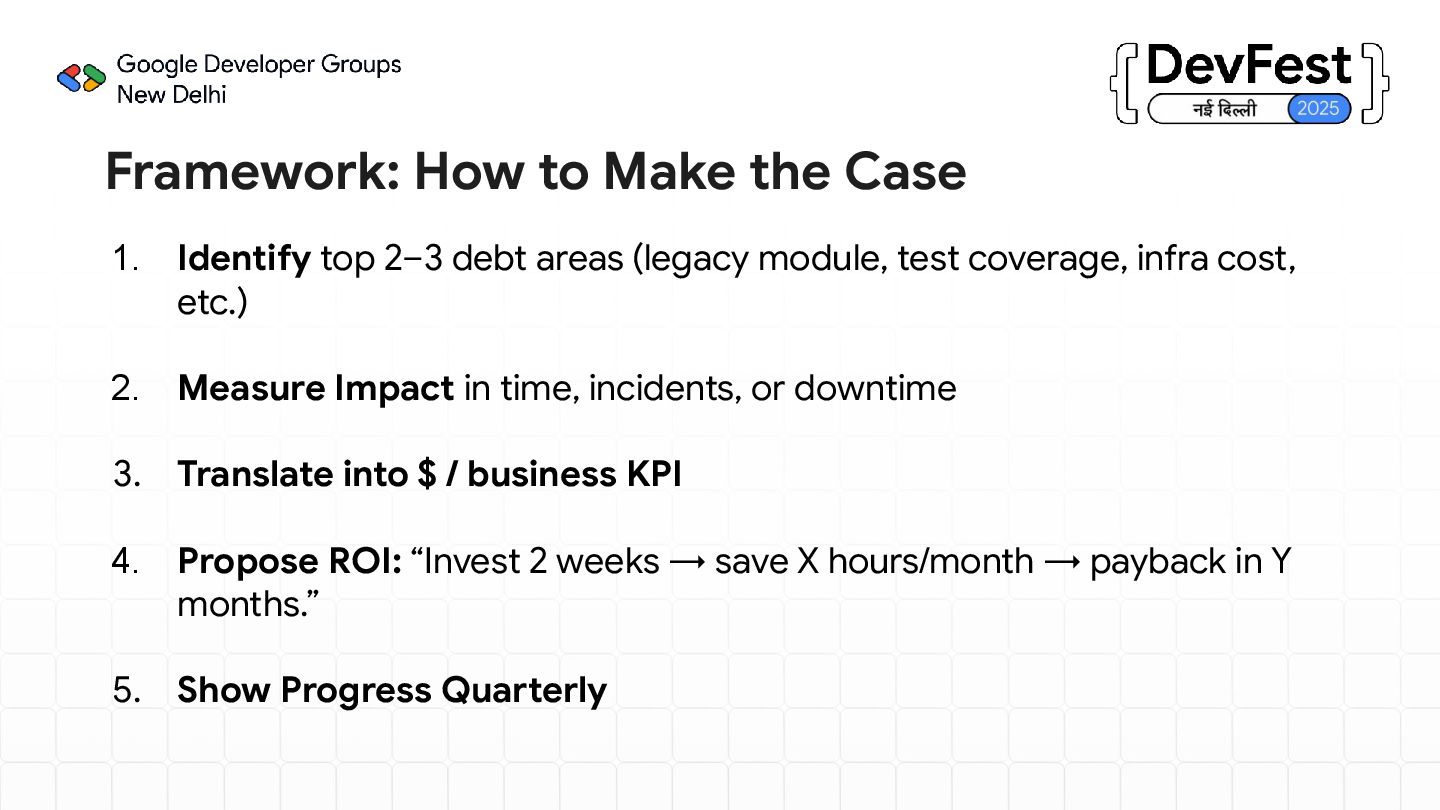
debt areas (legacy module, test coverage, infra cost, etc.) 2. Measure Impact in time, incidents, or downtime 3. Translate into $ / business KPI 4. Propose ROI: “Invest 2 weeks → save X hours/month → payback in Y months.” 5. Show Progress Quarterly
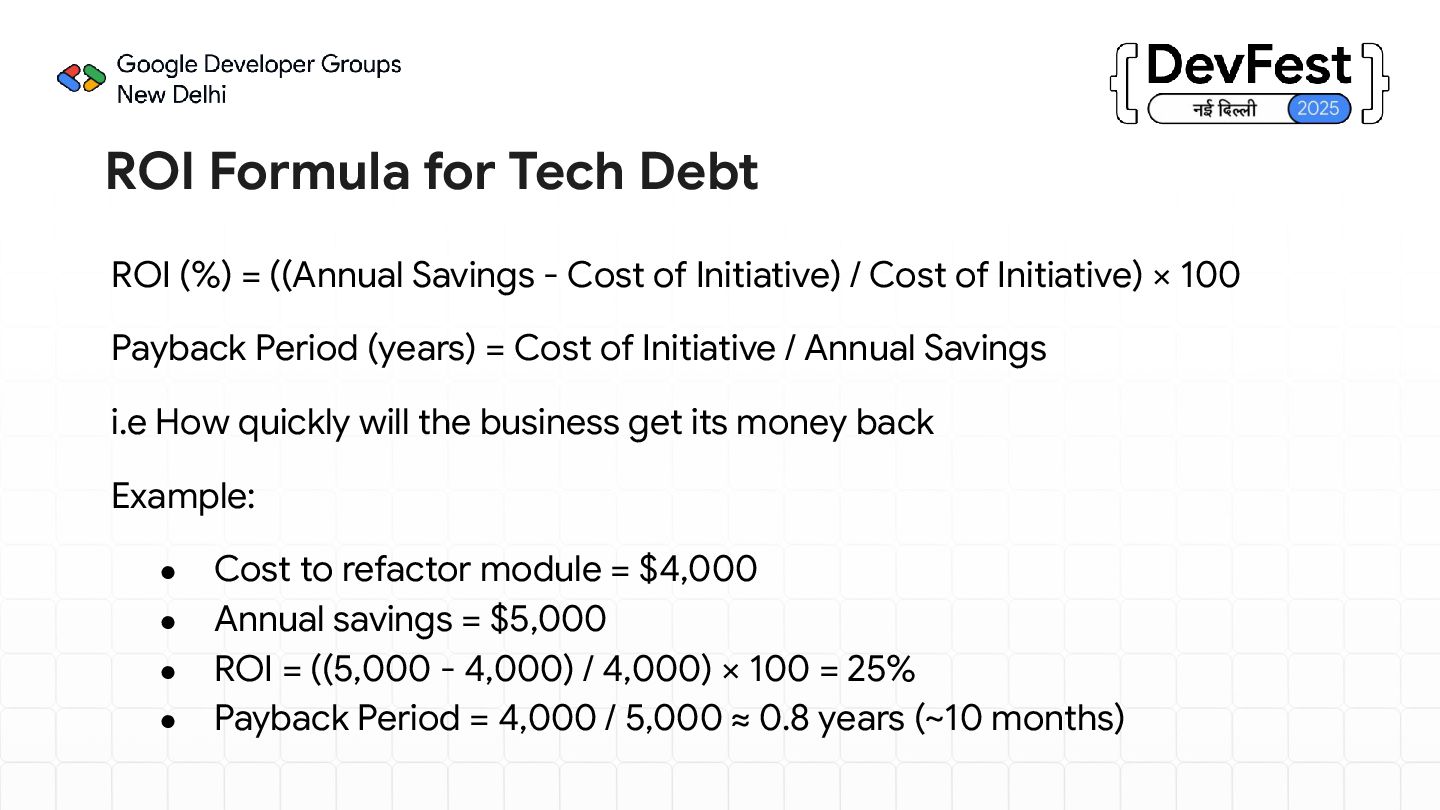
- Cost of Initiative) / Cost of Initiative) × 100 Payback Period (years) = Cost of Initiative / Annual Savings i.e How quickly will the business get its money back Example: • Cost to refactor module = $4,000 • Annual savings = $5,000 • ROI = ((5,000 - 4,000) / 4,000) × 100 = 25% • Payback Period = 4,000 / 5,000 ≈ 0.8 years (~10 months)
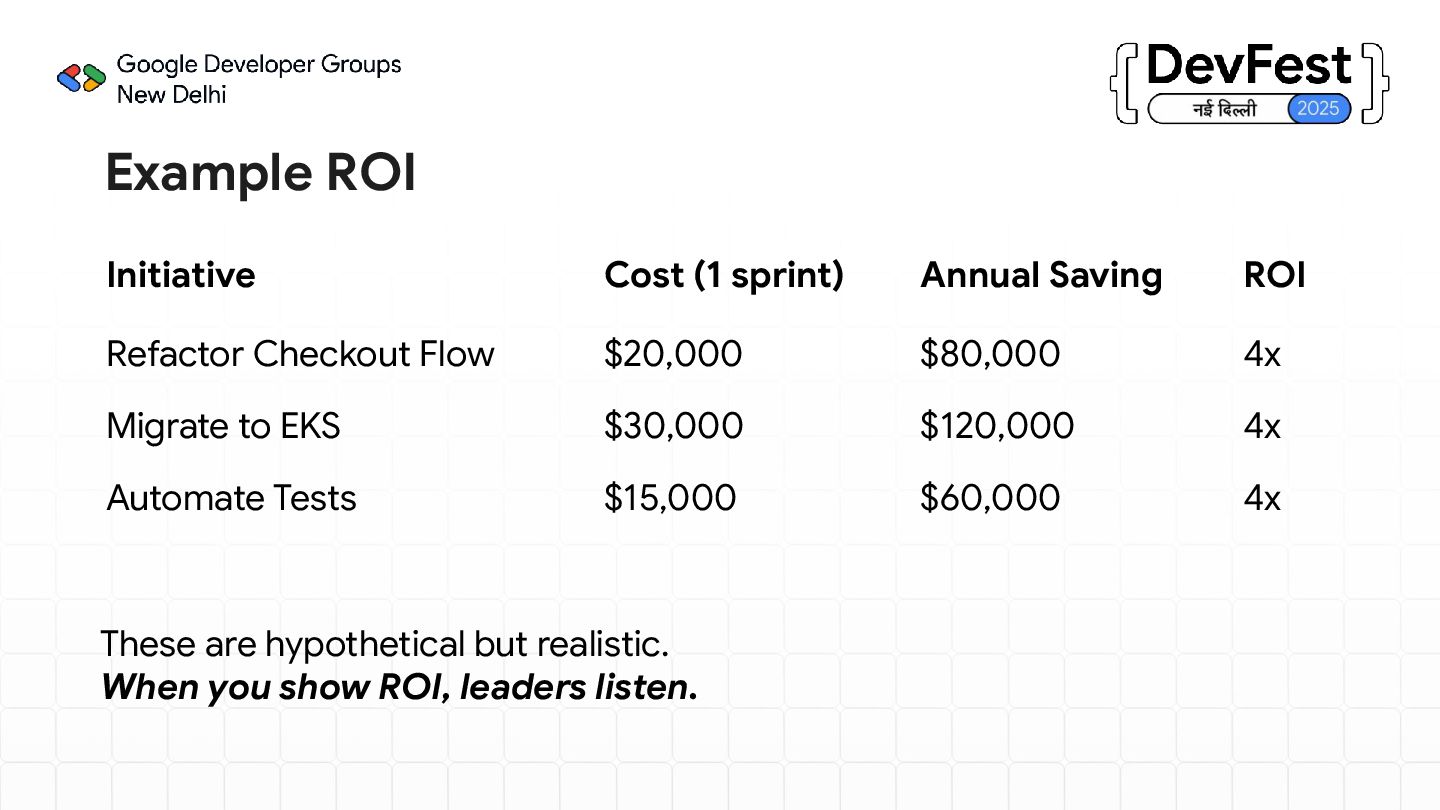
Checkout Flow $20,000 $80,000 4x Migrate to EKS $30,000 $120,000 4x Automate Tests $15,000 $60,000 4x These are hypothetical but realistic. When you show ROI, leaders listen.


 hiteshdroid
 marketingsoph
 greggifford
 jonoalderson
 rabernat
 coloredviolet
 samtorres
 vanstee
 akademiya2063
 lynnandtonic
 tenderlove
 akashhashmi
 mkilby