Characterising Locality Descriptions in Crowdsourced Crisis Information
I presented this paper at the GIS Research UK 20th Annual Conference (GISRUK 2012). To download the handout, notes and the paper itself please visit http://openaccess.city.ac.uk/892/.
Humanitarian organisations are reluctant to use social media during a crisis Ushahidi uses crowdsourcing to evaluate trust and accuracy, but crowdsourcing introduces further uncertainty
Humanitarian organisations are reluctant to use social media during a crisis Ushahidi uses crowdsourcing to evaluate trust and accuracy, but crowdsourcing introduces further uncertainty We’re interested in evaluating the uncertainty, and the potential bias, in crowdsourced crisis information
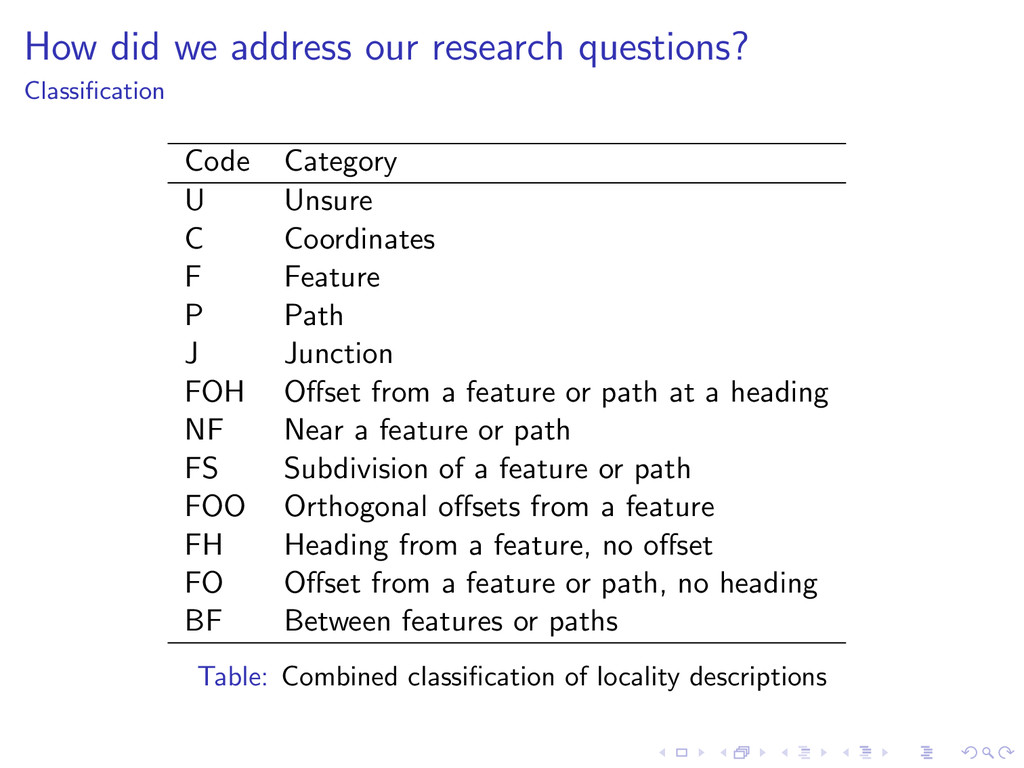
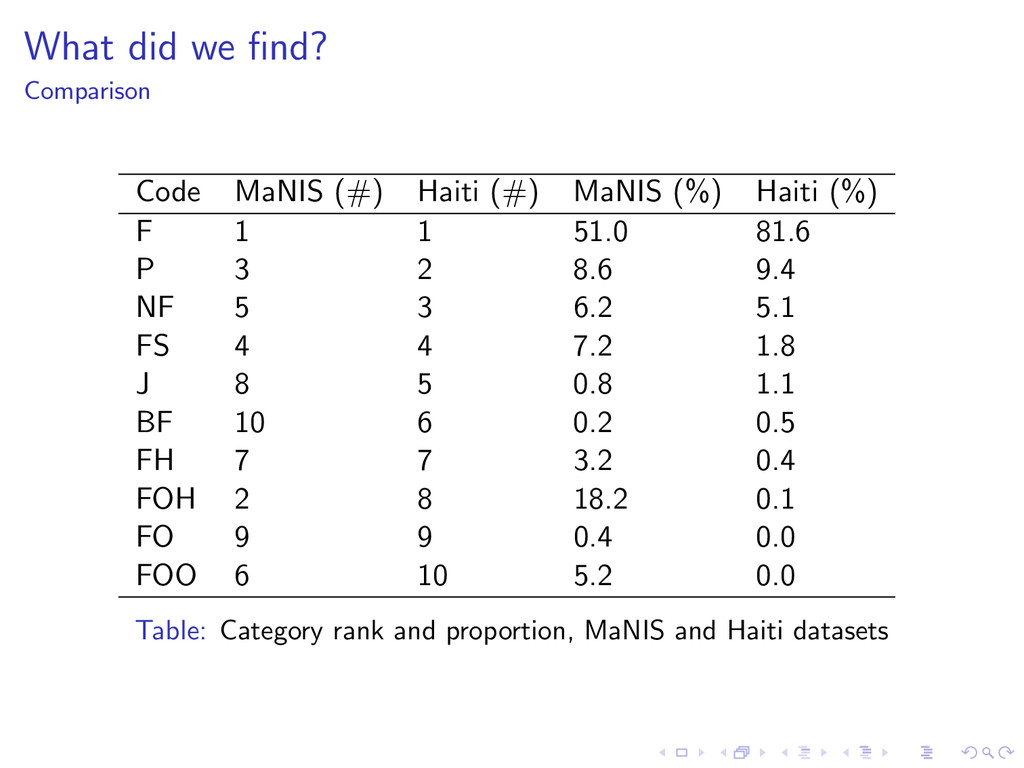
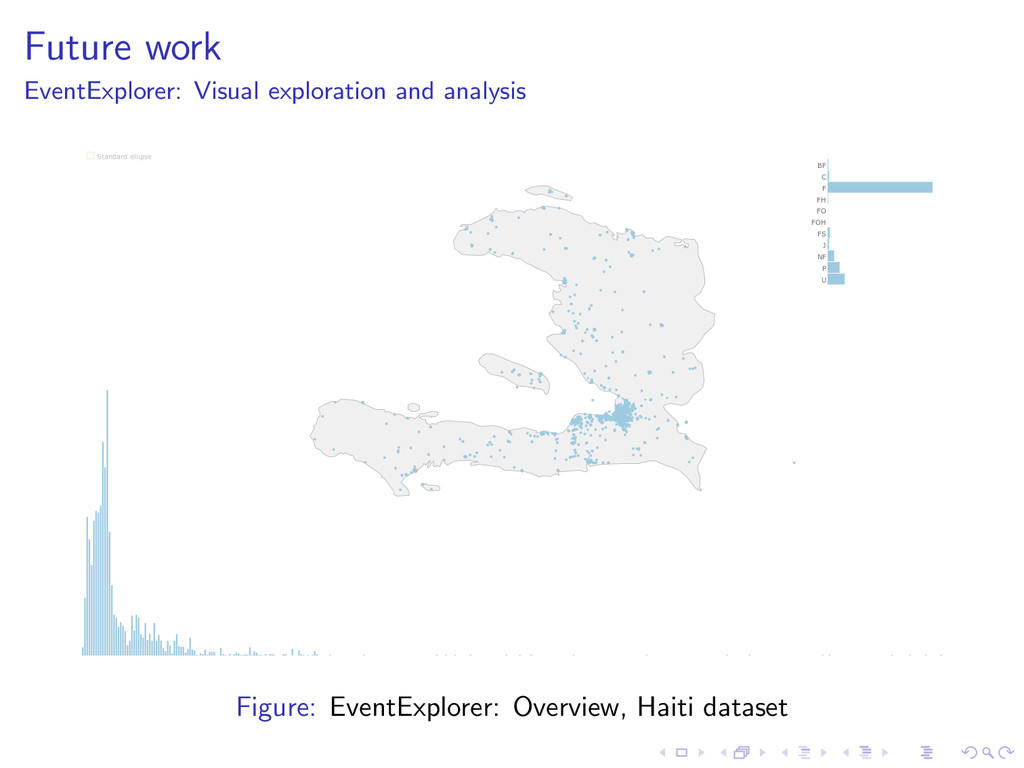
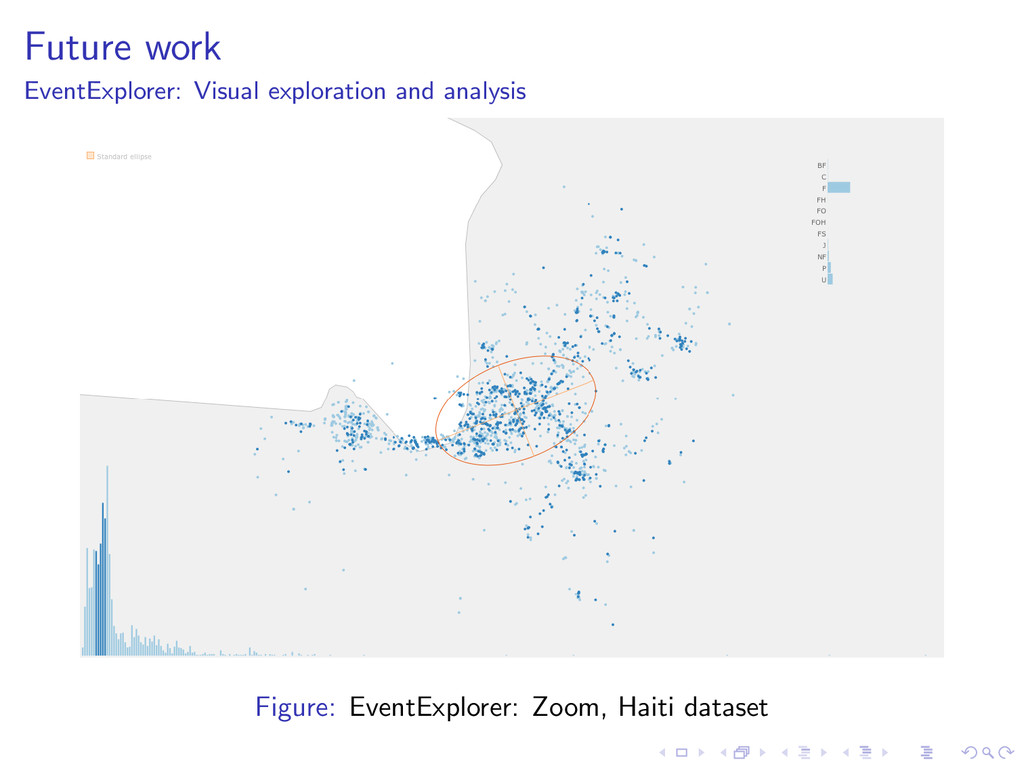
U Unsure C Coordinates F Feature P Path J Junction FOH Offset from a feature or path at a heading NF Near a feature or path FS Subdivision of a feature or path FOO Orthogonal offsets from a feature FH Heading from a feature, no offset FO Offset from a feature or path, no heading BF Between features or paths Table: Combined classification of locality descriptions
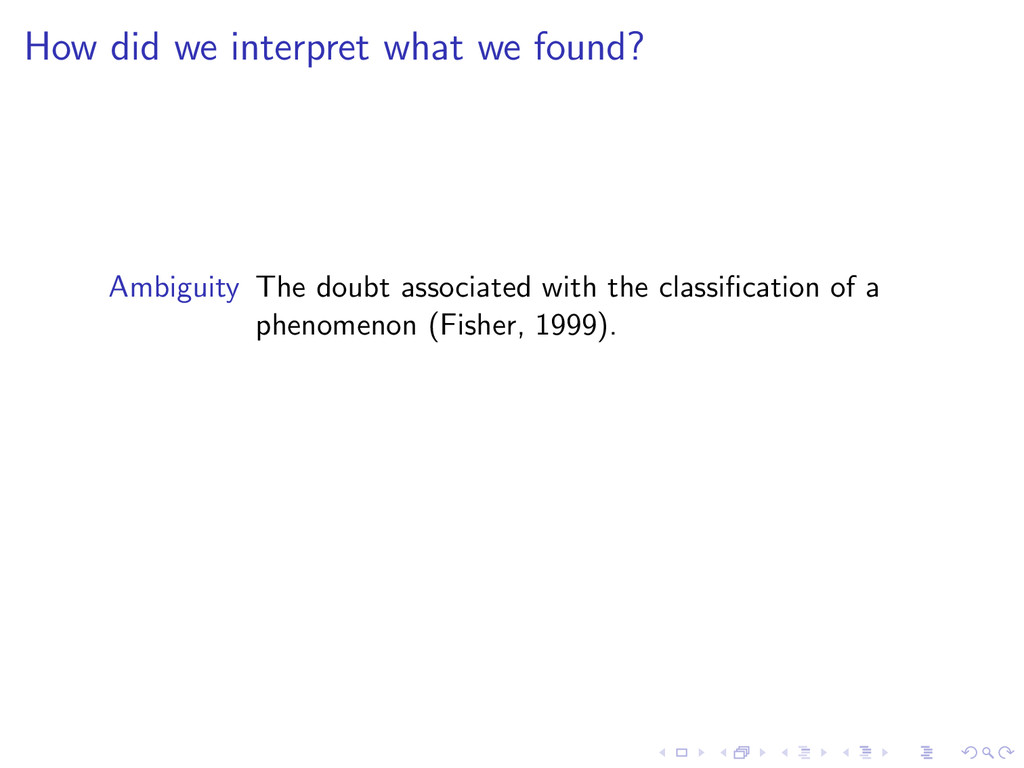
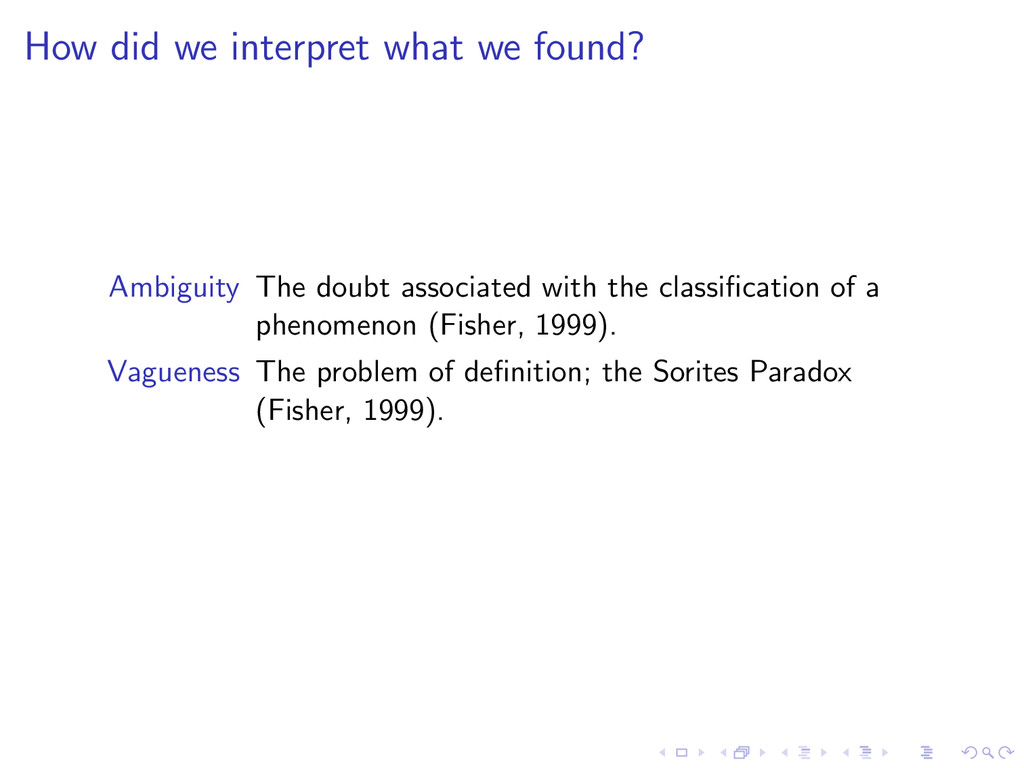
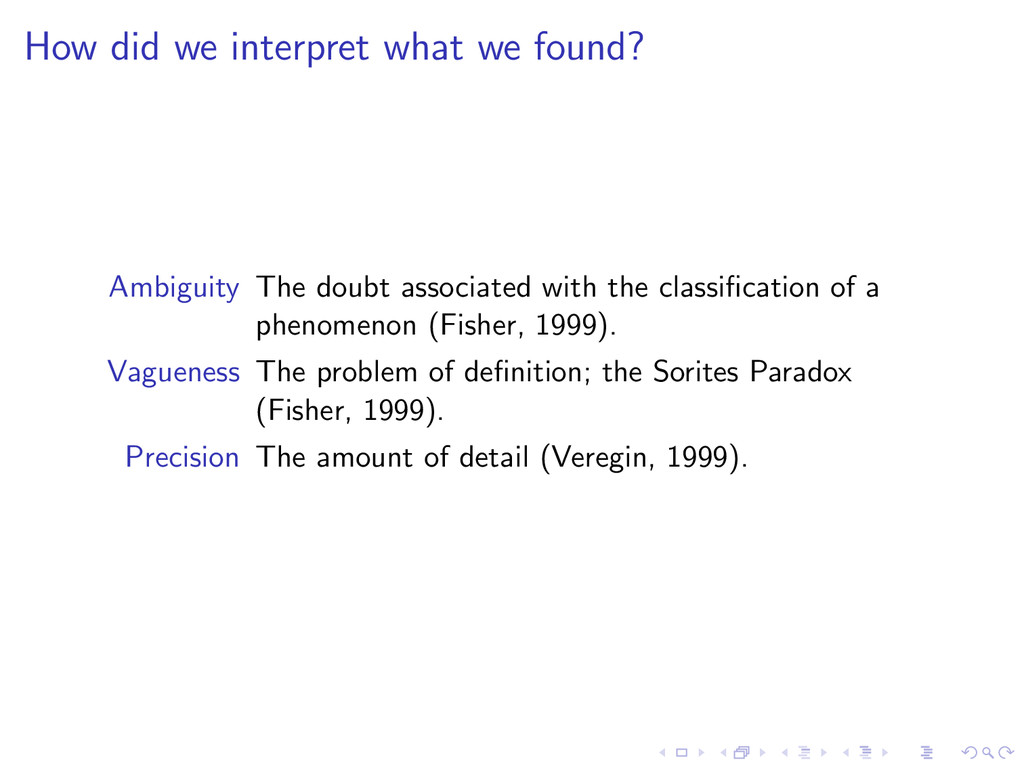
associated with the classification of a phenomenon (Fisher, 1999). Vagueness The problem of definition; the Sorites Paradox (Fisher, 1999). Precision The amount of detail (Veregin, 1999).
![Contact [email protected] dillingham.me.uk giCentre School of Informatics City University London](https://files.speakerdeck.com/presentations/4f8ad6abea7066001f014f33/slide_26.jpg)