Upgrade to Pro
— share decks privately, control downloads, hide ads and more …
Speaker Deck
Sign up for free
Menu
Search
Features
All features
Private URLs
Password Protection
Custom URLS
Scheduled publishing
Remove Branding
Restrict embedding
Deck Collections
Notes
Features
All features
Private URLs
Password Protection
Custom URLS
Scheduled publishing
Remove Branding
Restrict embedding
Deck Collections
Notes
Explore
Featured decks
Featured speakers
Programming
Technology
Storyboards
Explore
Featured decks
Featured speakers
Programming
Technology
Storyboards
Pricing
Search
Sign in
Sign up for free
レンダリングしていますを改善する
Search
Naoki Ishii
September 28, 2018
Programming
650
1
Share
Embed
Copy iframe code
Copy JS code
Copy link
Start on current slide
レンダリングしていますを改善する
Naoki Ishii
September 28, 2018
More Decks by Naoki Ishii
See All by Naoki Ishii
Walking with Awareness API
iiinaiii
1
510
Other Decks in Programming
See All in Programming
Vue Fes Japan 2026 タイムテーブル徹底解説
448jp
1
650
Apple Intelligence を用いた個人情報誤送信防止、及びユーザーリクエスト体験の改善について
yukiny
0
330
AI主導のプログラミング学習アプリを作ってみた
econanringo
0
150
Turning Architecture into Unit Tests in the AI Era (NSSpain XIV)
steliosf
PRO
1
140
R8 の設定見直しでアプリサイズ削減
andpad
0
200
半永久的に提供し続けられるプライベートクラウドを目指して ― 利用者の認知負荷を抑えるAPI抽象化とハードウェア世代交代の基盤設計
tomokon
0
470
AI が書く Go コードの品質を劇的に向上させる Linter: “declscope”
mpyw
0
490
UPDATE をやめる — EF Core でマスタをバージョン管理する
panda728
PRO
0
1.2k
自サークルのIdPからログアウトできるようになるまで
taiseiue
1
130
sbt 2.0: takeoff
eed3si9n
0
120
Ghostty + Neovimで作る 透明でカッコ良い開発環境
j341nono
0
160
C#の現在地 進化の歴史と、AI時代の.NET Everywhere
neuecc
5
5.1k
Featured
See All Featured
"I'm Feeling Lucky" - Building Great Search Experiences for Today's Users (#IAC19)
danielanewman
230
23k
Noah Learner - AI + Me: how we built a GSC Bulk Export data pipeline
techseoconnect
PRO
0
450
The MySQL Ecosystem @ GitHub 2015
samlambert
251
13k
The State of eCommerce SEO: How to Win in Today's Products SERPs - #SEOweek
aleyda
2
12k
The Spectacular Lies of Maps
axbom
PRO
1
1.1k
Templates, Plugins, & Blocks: Oh My! Creating the theme that thinks of everything
marktimemedia
31
2.9k
AI in Enterprises - Java and Open Source to the Rescue
ivargrimstad
0
1.5k
Darren the Foodie - Storyboard
khoart
PRO
4
4k
So, you think you're a good person
axbom
PRO
2
2.2k
Claude Code のすすめ
schroneko
67
230k
Practical Tips for Bootstrapping Information Extraction Pipelines
honnibal
25
2.1k
Marketing to machines
jonoalderson
1
5.9k
Transcript
レンダリングしていますを 改善する
自己紹介 ▣ 石井直貴 □ NAVITIME 2010〜 ▣ Androidアプリ開発 □ NAVITIME,
乗換NAVITIME □ ここ地図 ( 8月リリース ) ▣ 趣味 □ ライブ鑑賞 □ 個人アプリ開発
今日話すこと ▣ レンダリングしています ▣ 調査方法 ▣ 改善したこと ▣ まとめ
注: ▣ パフォーマンス改善中です ▣ 今後のアップデートにご期待下さい!
レンダリングしています
レンダリングしています
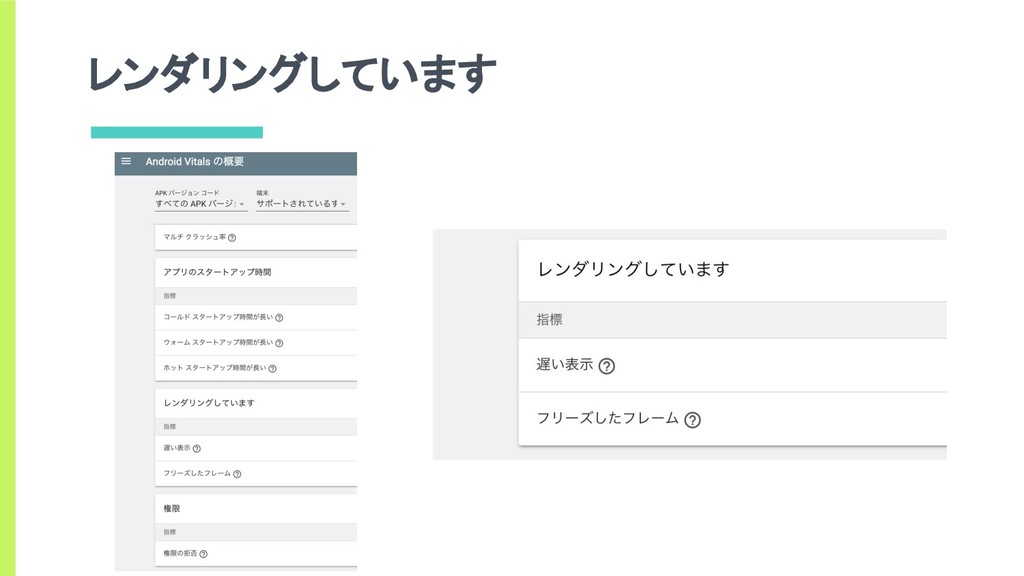
レンダリングしています ▣ Android Vitalsの指標の1つ ▣ 主な指標には入っていない □ 主な指標 ▪ 過剰なウェイクアップ
▪ クラッシュ発生率 ▪ ANR発生率 ▣ 遅い表示・フリーズしたフレームがある
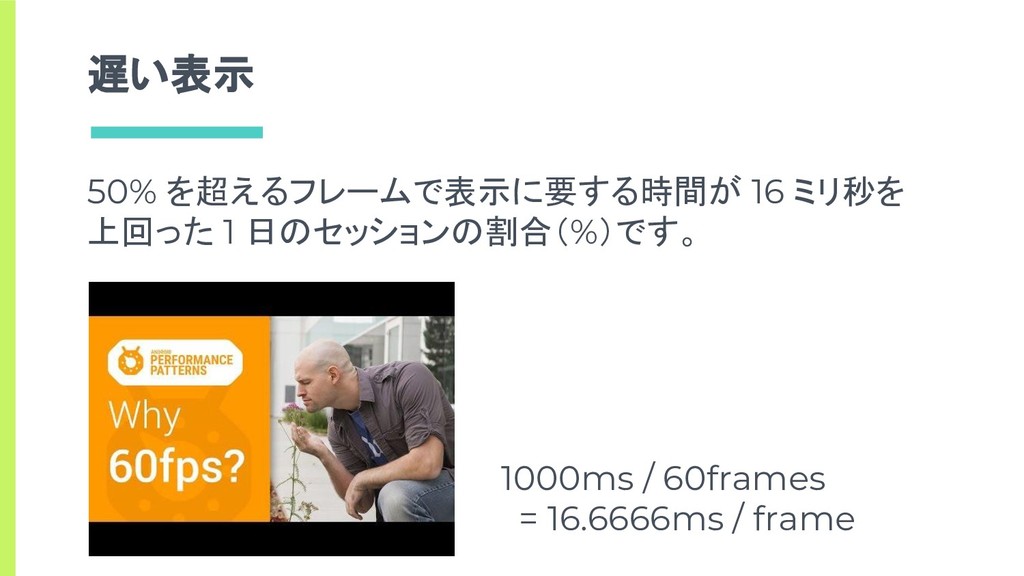
遅い表示 50% を超えるフレームで表示に要する時間が 16 ミリ秒を 上回った 1 日のセッションの割合(%)です。 1000ms /
60frames = 16.6666ms / frame
フリーズしたフレーム 0.1% を超えるフレームで表示に要する時間が 700 ミリ秒 を上回った 1 日のセッションの割合(%)です。
レンダリングしています - まとめ ▣ わかる数値 □ アプリ全体で遅いレンダリング・フリーズしたフレームの継続的 な数値 ▣ できること
□ この数値を追うことで、リリース毎にレンダリングパフォーマンス を意識することができる
どこの画面が遅いのかを知る
どこの画面が遅いのか Firebase Performance Monitoring
Firebase Performance Monitoring ▣ 2018 Google I/O 〜 betaを抜けてGAに ▣
Activityの計測は自動
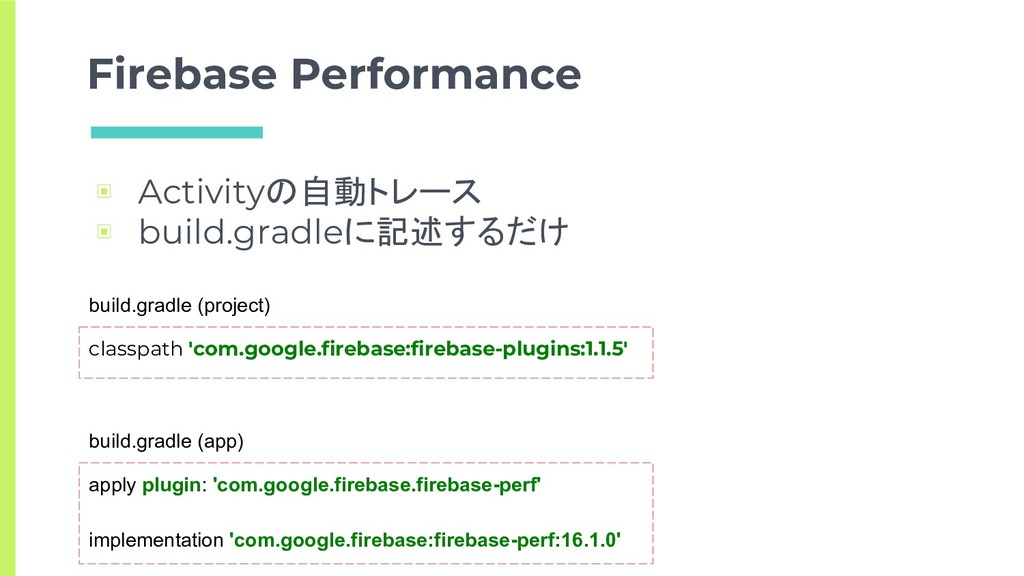
Firebase Performance ▣ Activityの自動トレース ▣ build.gradleに記述するだけ classpath 'com.google.firebase:firebase-plugins:1.1.5' build.gradle (project)
apply plugin: 'com.google.firebase.firebase-perf' implementation 'com.google.firebase:firebase-perf:16.1.0' build.gradle (app)
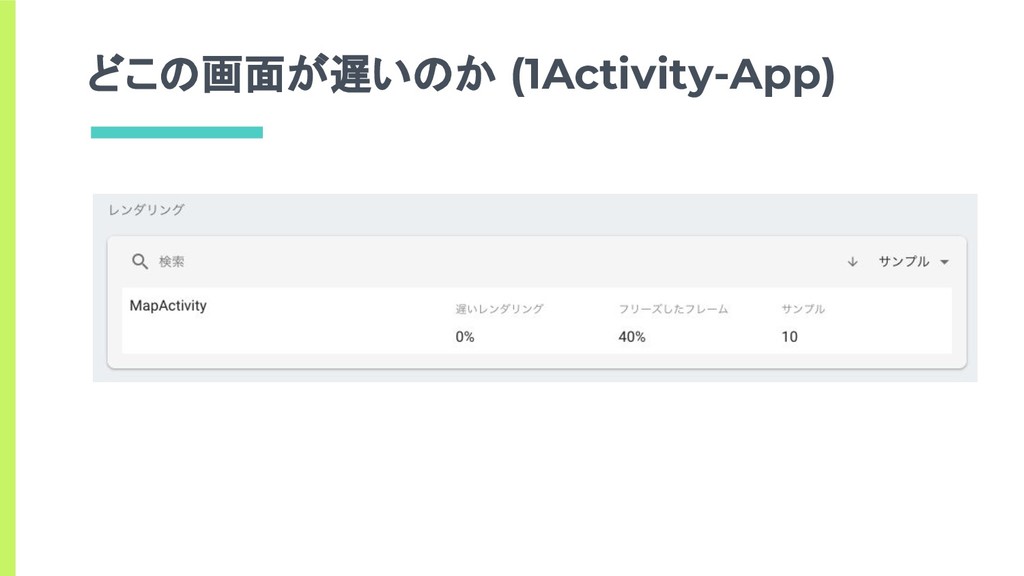
Firebase Performance ▣ Activity毎に遅いレンダリング・フリーズしたフレームが 出る
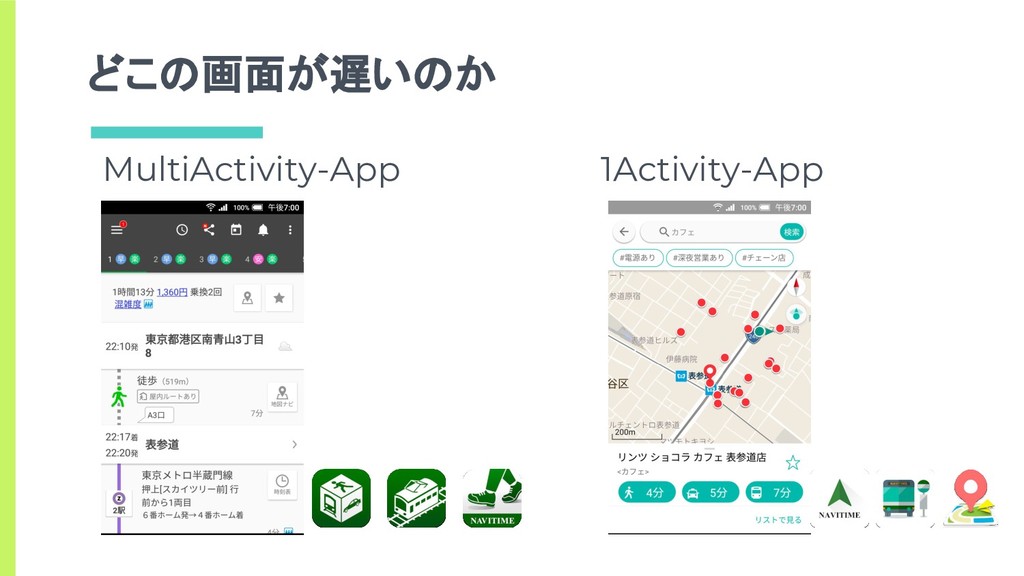
どこの画面が遅いのか MultiActivity-App 1Activity-App
どこの画面が遅いのか (1Activity-App)
どこの画面が遅いのか (1Activity-App) ▣ Firebase Performanceのカスタムトレースを使う
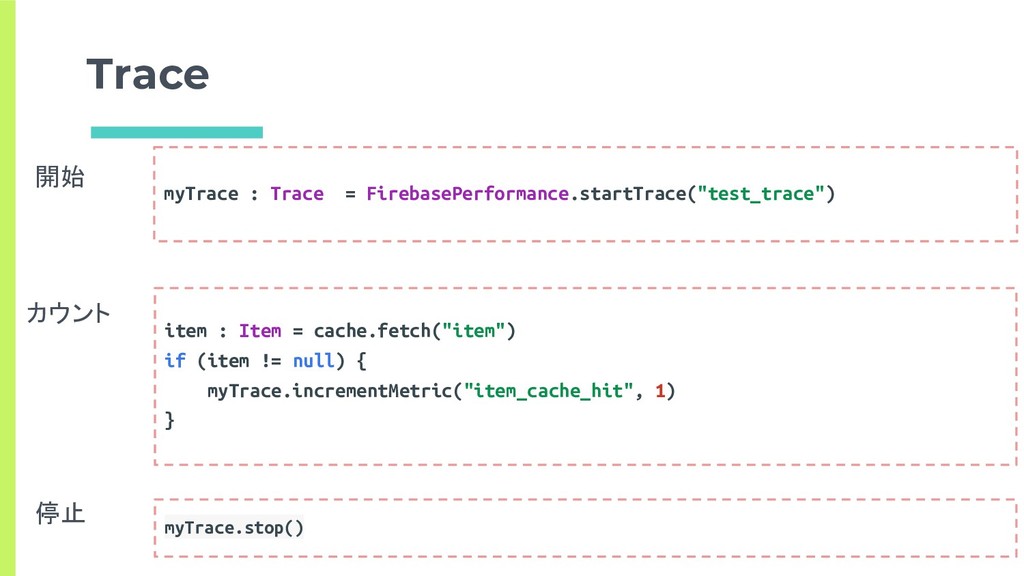
Trace myTrace : Trace = FirebasePerformance.startTrace("test_trace") item : Item =
cache.fetch("item") if (item != null) { myTrace.incrementMetric("item_cache_hit", 1) } myTrace.stop() 開始 カウント 停止
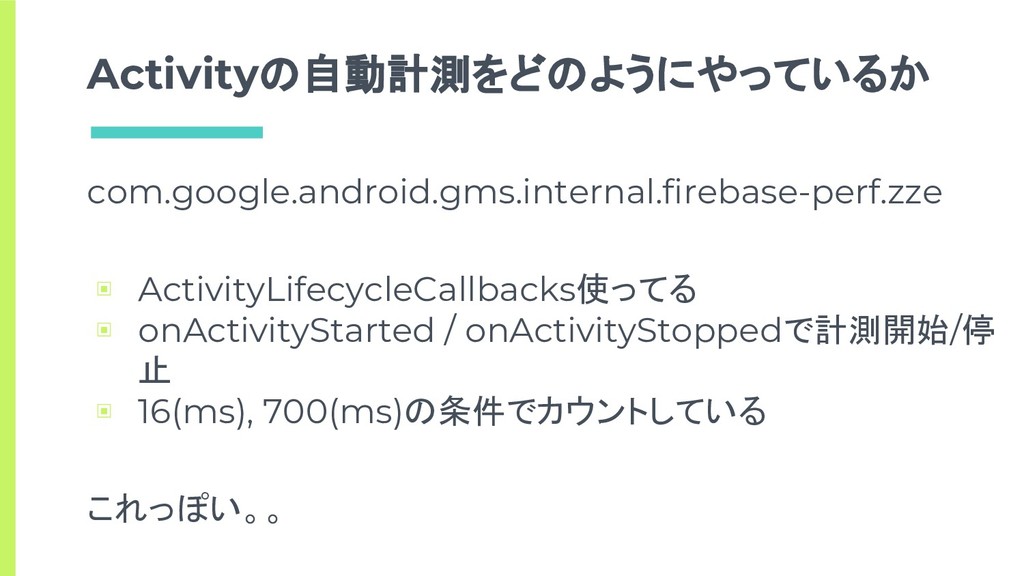
Activityの自動計測をどのようにやっているか com.google.android.gms.internal.firebase-perf.zze ▣ ActivityLifecycleCallbacks使ってる ▣ onActivityStarted / onActivityStoppedで計測開始/停 止 ▣
16(ms), 700(ms)の条件でカウントしている これっぽい。。
やっている処理 ▣ onActivityStarted □ Traceをstart □ FrameMetricsAggregatorにActivityをAdd ▣ onActivityStopped □
FrameMetricsAggregatorからActivityをremoveし計測 値を取得 □ 取得した計測値を加工してTraceのカウントを増やす □ Traceをstop
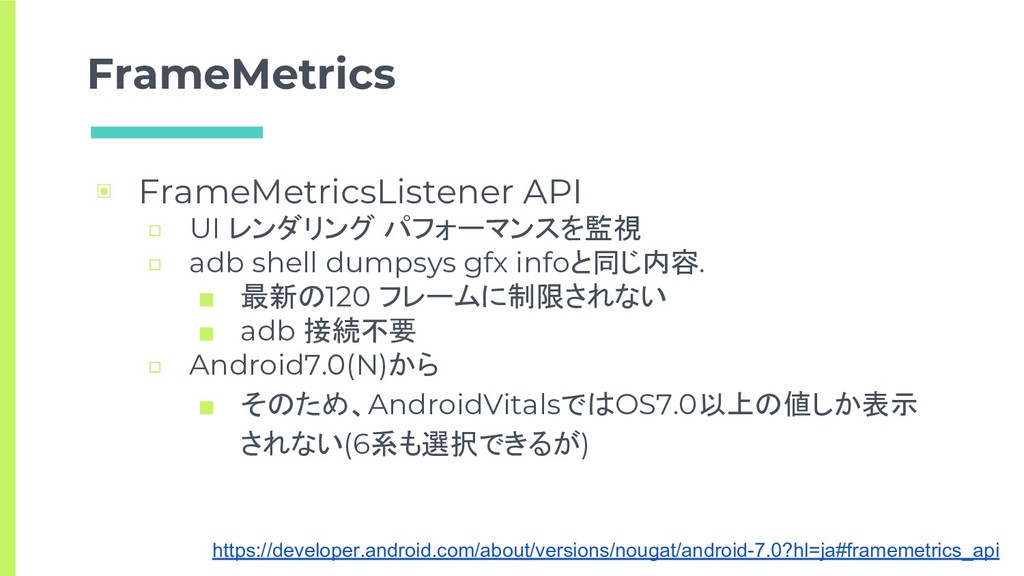
FrameMetrics ▣ FrameMetricsListener API □ UI レンダリング パフォーマンスを監視 □ adb
shell dumpsys gfx infoと同じ内容. ▪ 最新の120 フレームに制限されない ▪ adb 接続不要 □ Android7.0(N)から ▪ そのため、AndroidVitalsではOS7.0以上の値しか表示 されない(6系も選択できるが) https://developer.android.com/about/versions/nougat/android-7.0?hl=ja#framemetrics_api
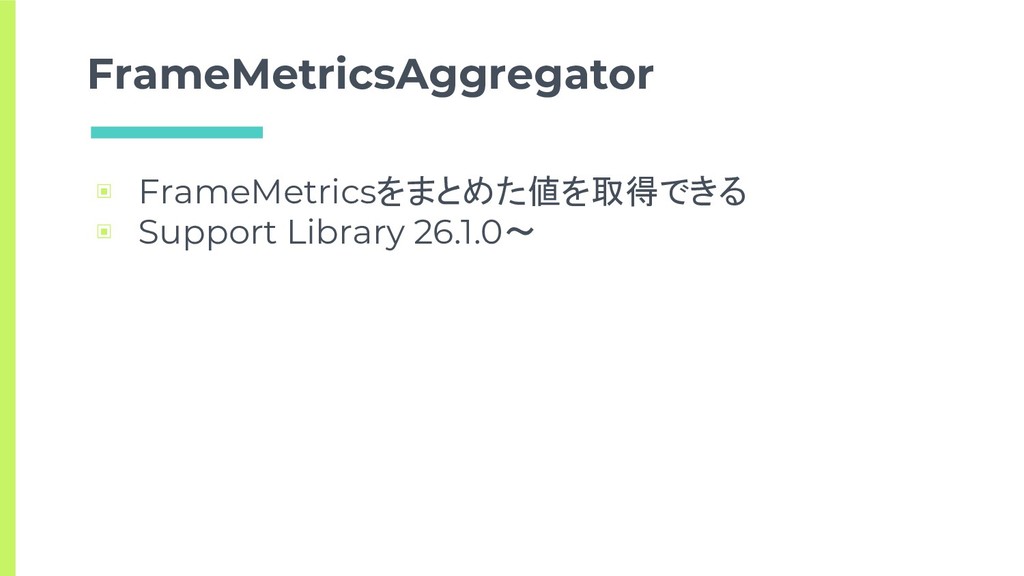
FrameMetricsAggregator ▣ FrameMetricsをまとめた値を取得できる ▣ Support Library 26.1.0〜
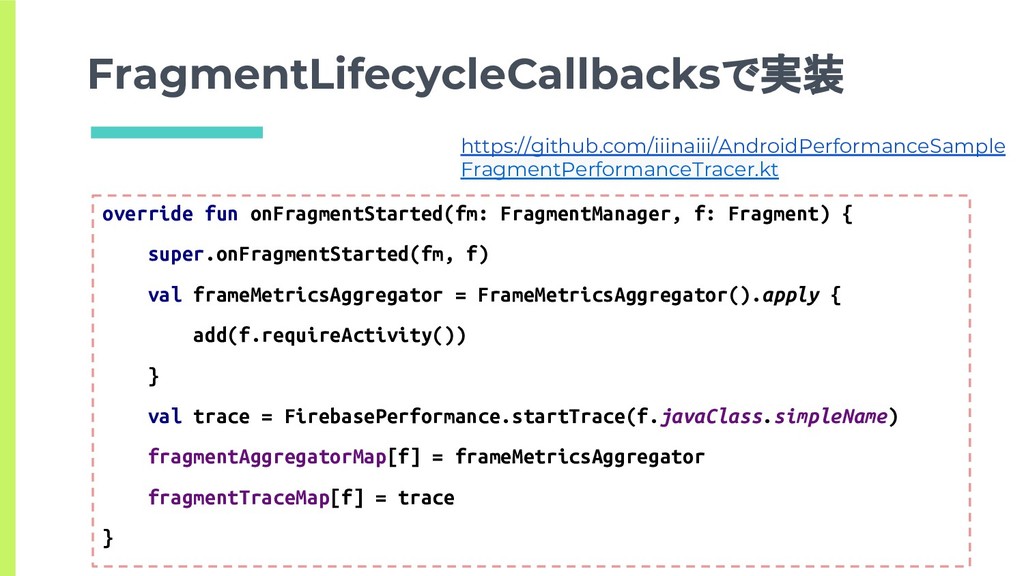
FragmentLifecycleCallbacksで実装 override fun onFragmentStarted(fm: FragmentManager, f: Fragment) { super.onFragmentStarted(fm, f)
val frameMetricsAggregator = FrameMetricsAggregator().apply { add(f.requireActivity()) } val trace = FirebasePerformance.startTrace(f.javaClass.simpleName) fragmentAggregatorMap[f] = frameMetricsAggregator fragmentTraceMap[f] = trace } https://github.com/iiinaiii/AndroidPerformanceSample FragmentPerformanceTracer.kt
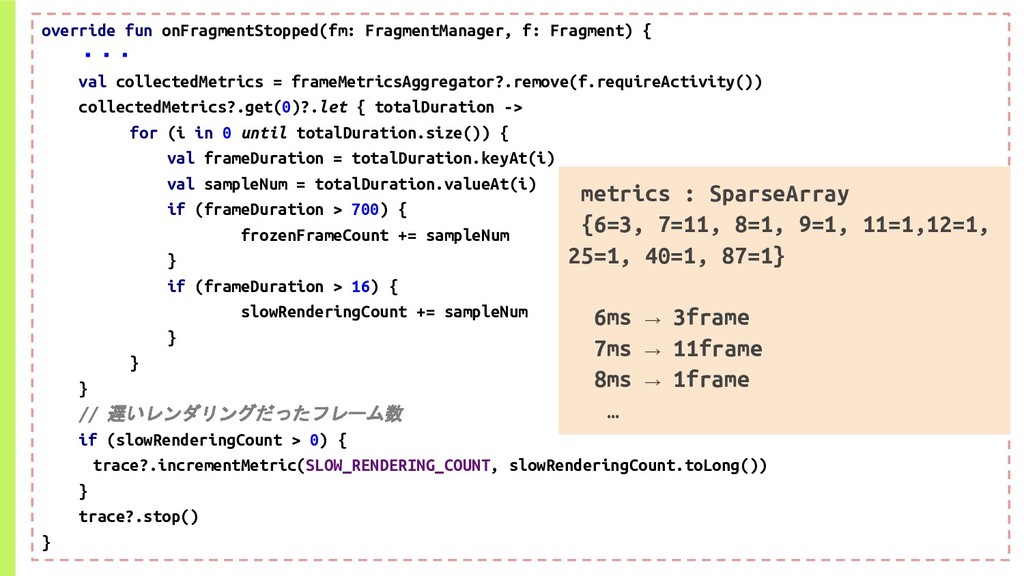
override fun onFragmentStopped(fm: FragmentManager, f: Fragment) { ・・・ val collectedMetrics
= frameMetricsAggregator?.remove(f.requireActivity()) collectedMetrics?.get(0)?.let { totalDuration -> for (i in 0 until totalDuration.size()) { val frameDuration = totalDuration.keyAt(i) val sampleNum = totalDuration.valueAt(i) if (frameDuration > 700) { frozenFrameCount += sampleNum } if (frameDuration > 16) { slowRenderingCount += sampleNum } } } // 遅いレンダリングだったフレーム数 if (slowRenderingCount > 0) { trace?.incrementMetric(SLOW_RENDERING_COUNT, slowRenderingCount.toLong()) } trace?.stop() } metrics : SparseArray {6=3, 7=11, 8=1, 9=1, 11=1,12=1, 25=1, 40=1, 87=1} 6ms → 3frame 7ms → 11frame 8ms → 1frame …
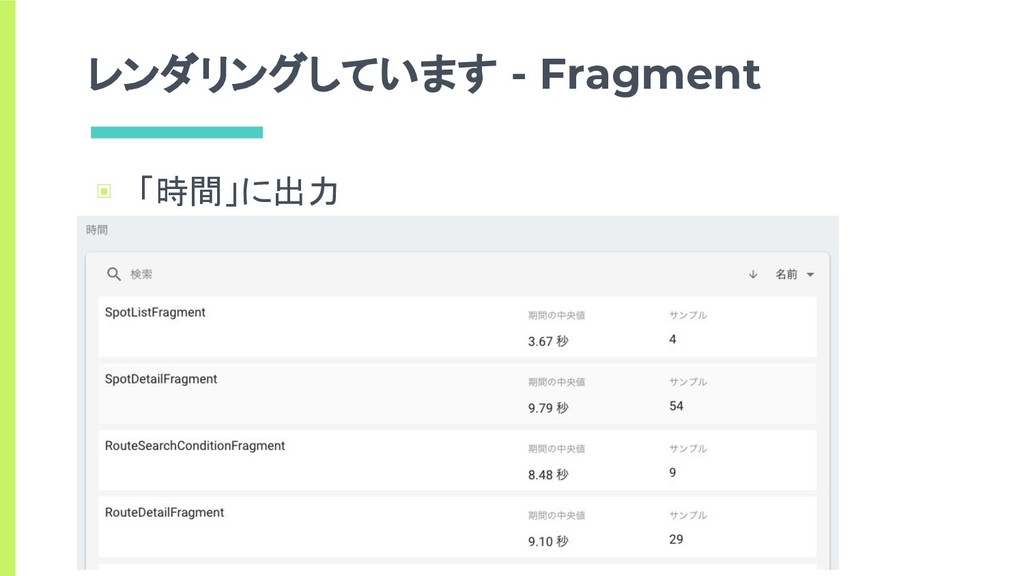
レンダリングしています - Fragment ▣ 「時間」に出力
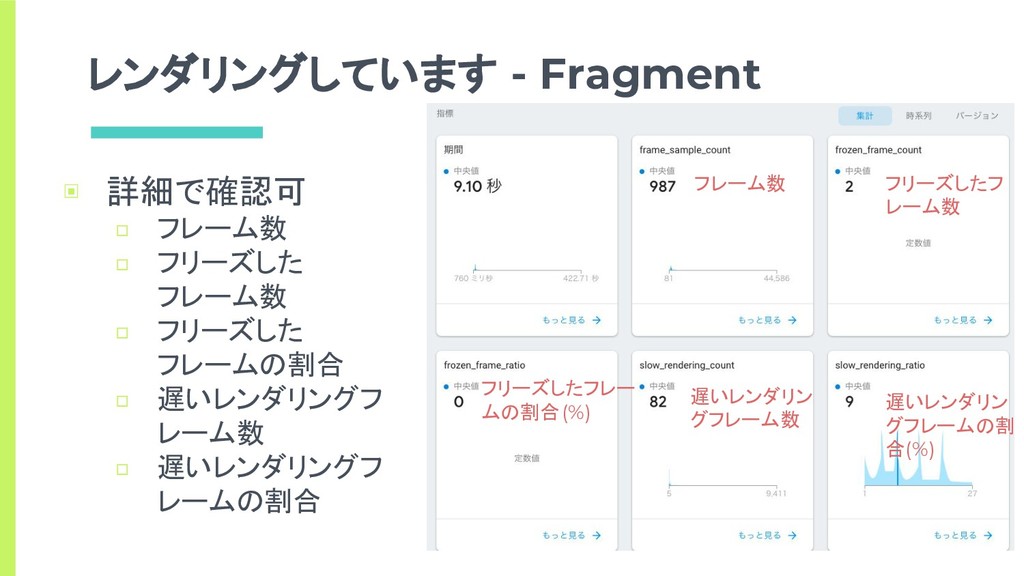
▣ 詳細で確認可 □ フレーム数 □ フリーズした フレーム数 □ フリーズした フレームの割合
□ 遅いレンダリングフ レーム数 □ 遅いレンダリングフ レームの割合 フレーム数 フリーズしたフ レーム数 フリーズしたフレー ムの割合(%) 遅いレンダリン グフレーム数 遅いレンダリン グフレームの割 合(%) レンダリングしています - Fragment
▣ 一覧に遅いレンダリング・フリーズしたフレームが出ないので 画面間の比較がしづらい ▣ 詳細に行けば見れるので、画面毎の数値が見れるのは良さそ う ▣ Activity.getWindowに対してのFrameMetricsなので、 Fragment単体でのレンダリング数値でないことに注意 ▣
どの画面(Fragment)が出ているときに数値が悪いかはわか る レンダリングしています - Fragment
どの画面が遅いのかを知る - まとめ ▣ わかる数値 □ 画面単位で遅い箇所 ▣ できること □
サンプル数と、遅いレンダリング or フリーズしたフレームの値か ら、改修優先度を決めることができる
画面内のどこが遅いのかを知る
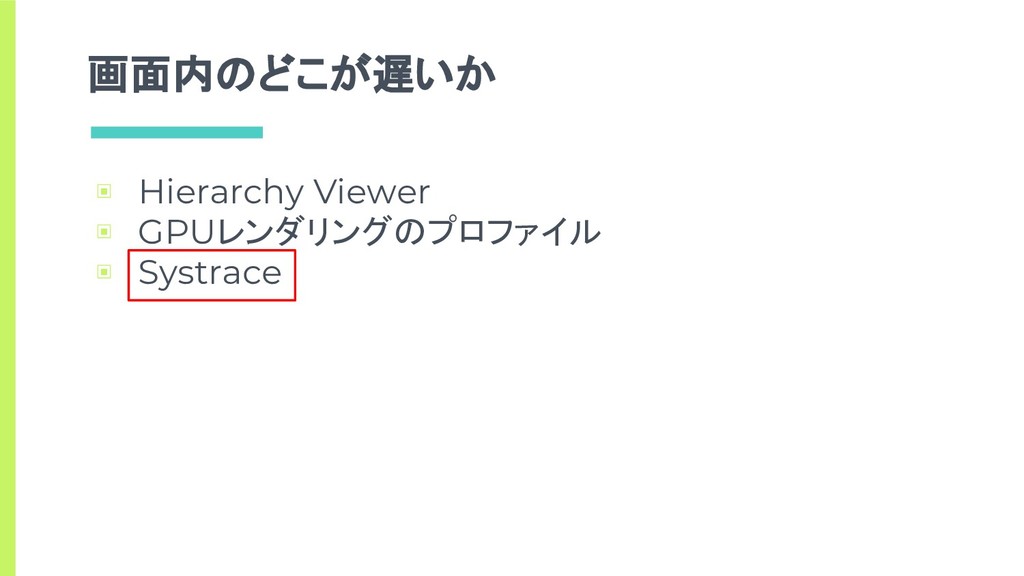
画面内のどこが遅いか ▣ Hierarchy Viewer ▣ GPUレンダリングのプロファイル ▣ Systrace
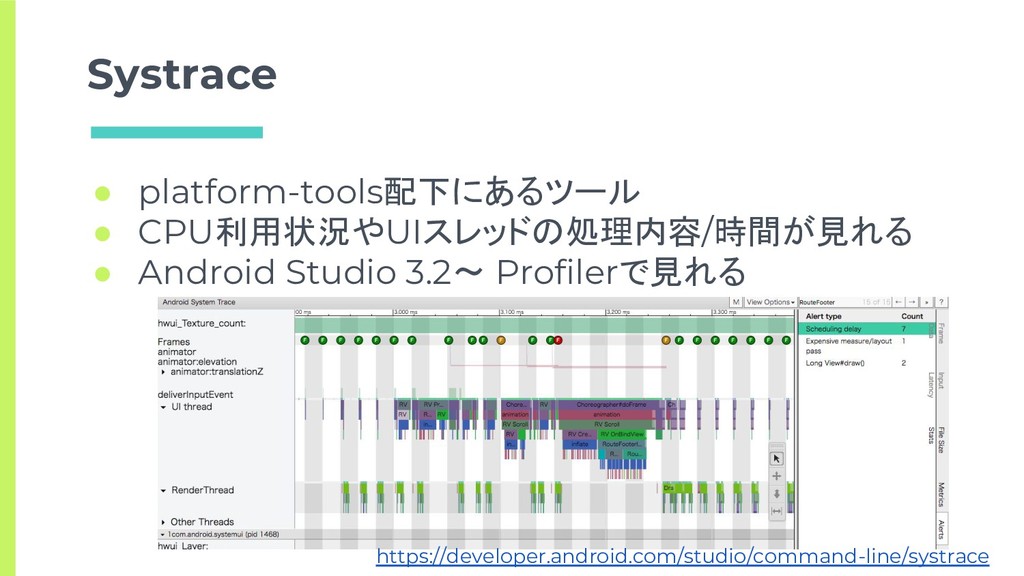
Systrace https://developer.android.com/studio/command-line/systrace • platform-tools配下にあるツール • CPU利用状況やUIスレッドの処理内容/時間が見れる • Android Studio 3.2〜
Profilerで見れる
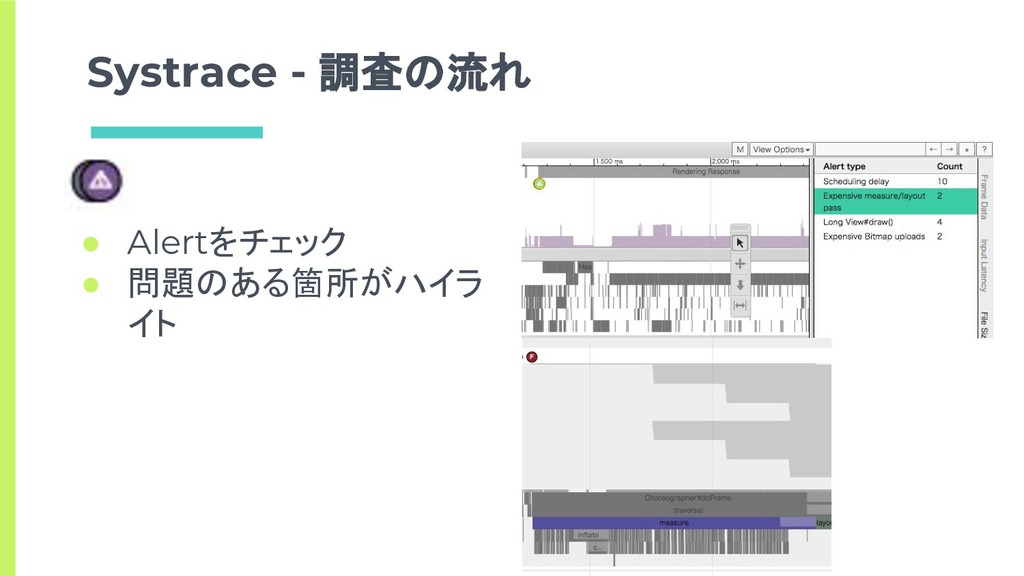
Systrace - 調査の流れ • Alertをチェック • 問題のある箇所がハイラ イト
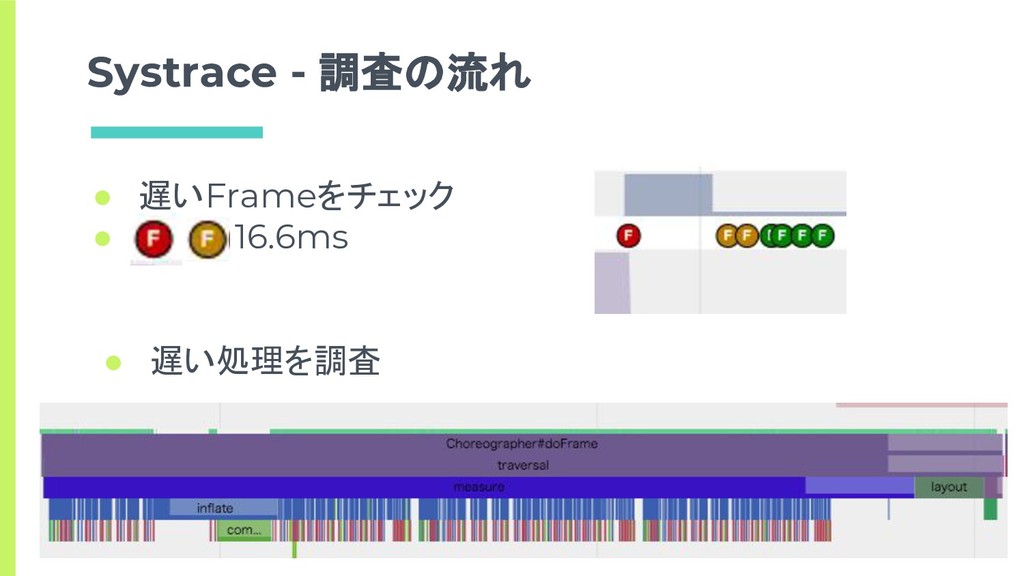
• 遅いFrameをチェック • > 16.6ms Systrace - 調査の流れ • 遅い処理を調査
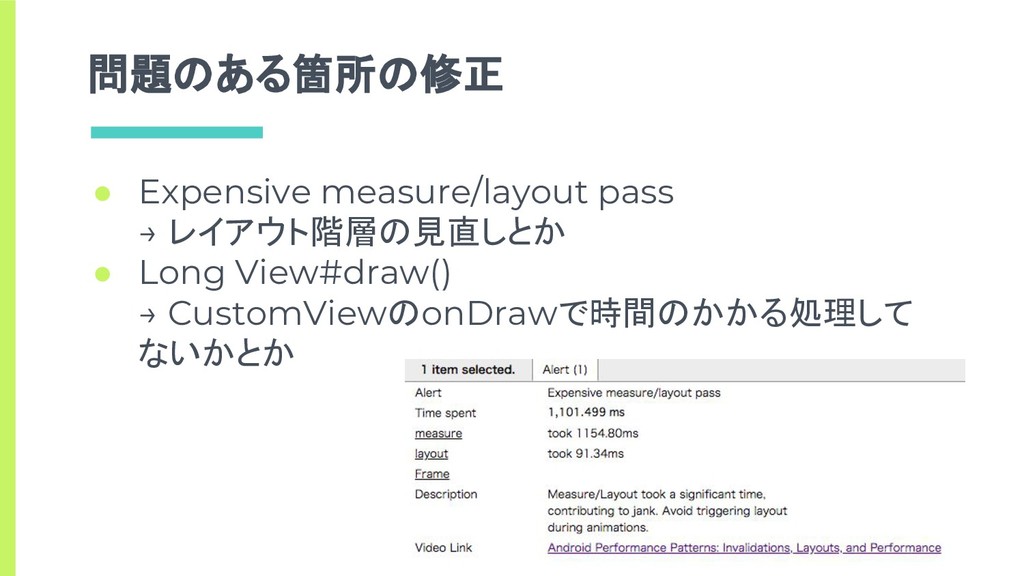
問題のある箇所の修正 • Expensive measure/layout pass → レイアウト階層の見直しとか • Long View#draw()
→ CustomViewのonDrawで時間のかかる処理して ないかとか
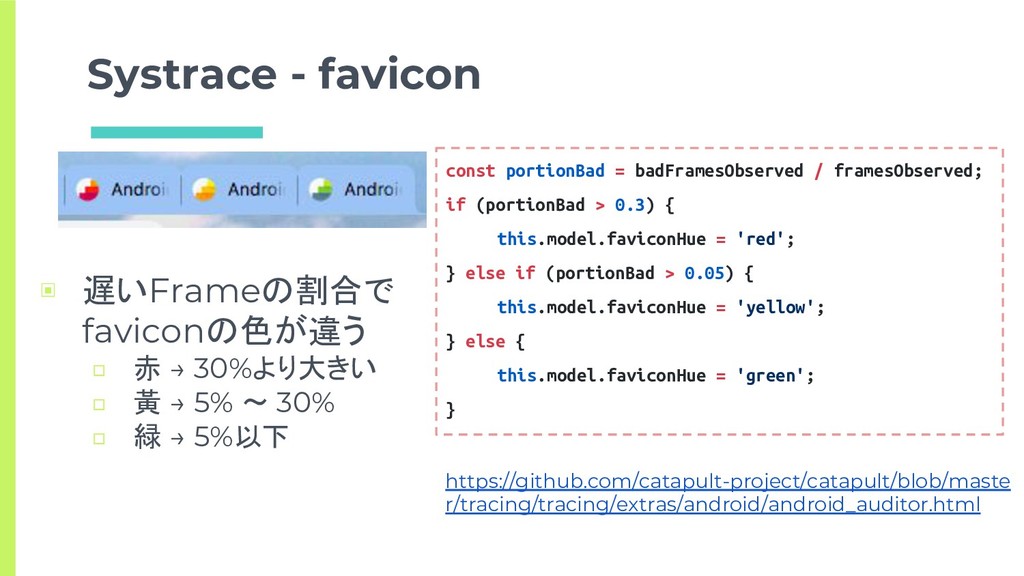
Systrace - favicon ▣ 遅いFrameの割合で faviconの色が違う □ 赤 → 30%より大きい
□ 黃 → 5% 〜 30% □ 緑 → 5%以下 const portionBad = badFramesObserved / framesObserved; if (portionBad > 0.3) { this.model.faviconHue = 'red'; } else if (portionBad > 0.05) { this.model.faviconHue = 'yellow'; } else { this.model.faviconHue = 'green'; } https://github.com/catapult-project/catapult/blob/maste r/tracing/tracing/extras/android/android_auditor.html
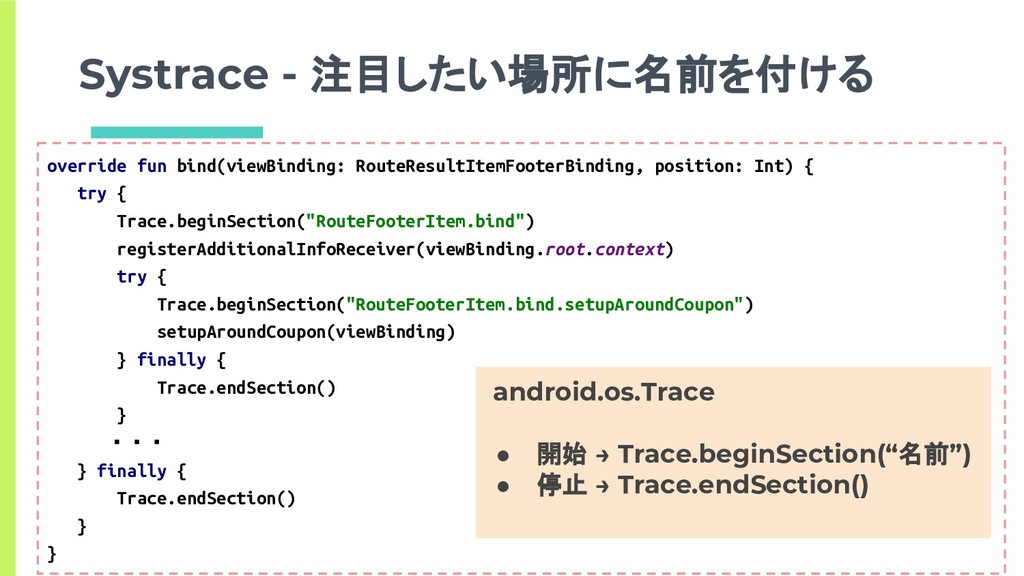
override fun bind(viewBinding: RouteResultItemFooterBinding, position: Int) { try { Trace.beginSection("RouteFooterItem.bind")
registerAdditionalInfoReceiver(viewBinding.root.context) try { Trace.beginSection("RouteFooterItem.bind.setupAroundCoupon") setupAroundCoupon(viewBinding) } finally { Trace.endSection() } ・・・ } finally { Trace.endSection() } } android.os.Trace • 開始 → Trace.beginSection(“名前”) • 停止 → Trace.endSection() Systrace - 注目したい場所に名前を付ける
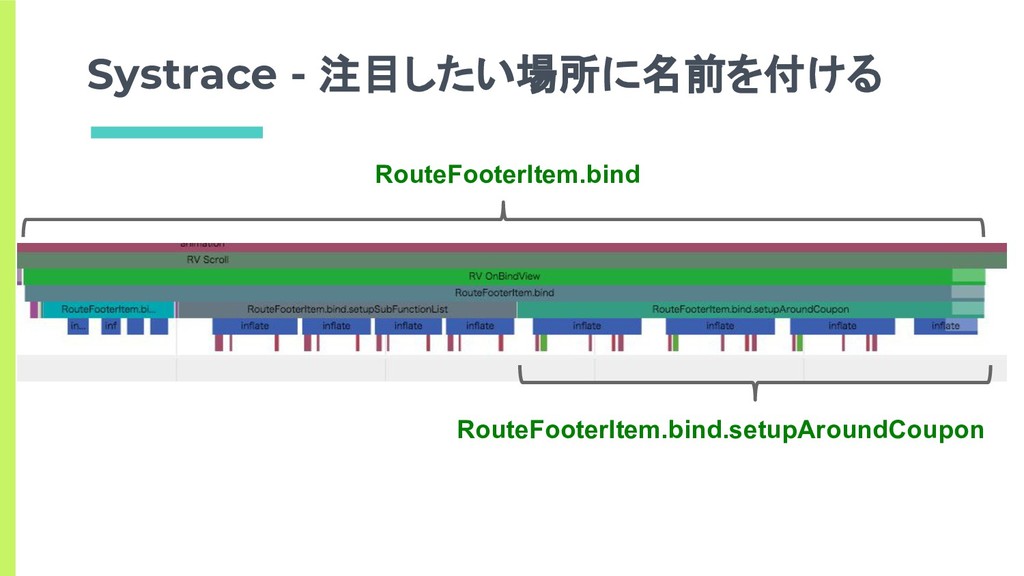
Systrace - 注目したい場所に名前を付ける RouteFooterItem.bind RouteFooterItem.bind.setupAroundCoupon
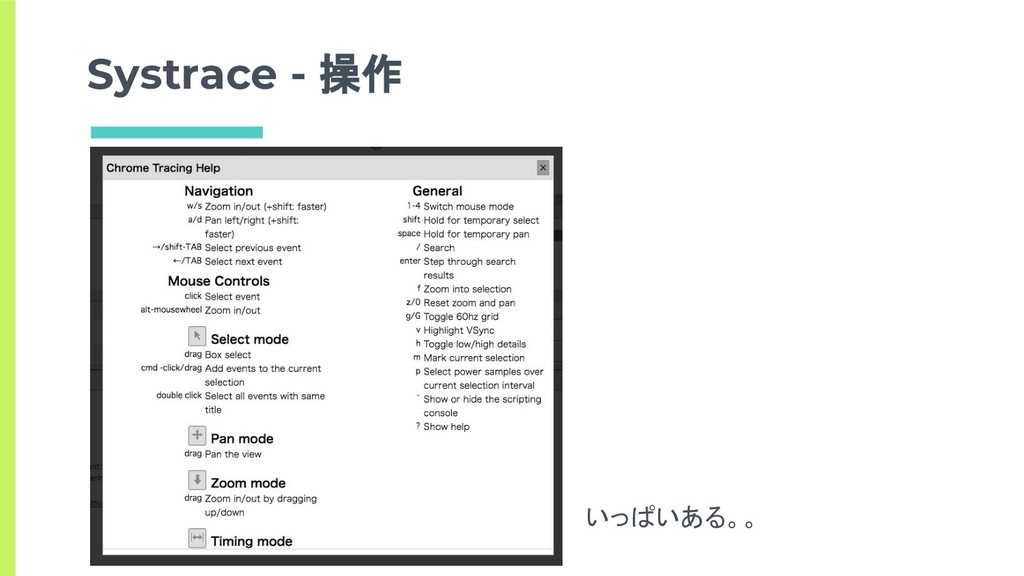
Systrace - 操作 いっぱいある。。
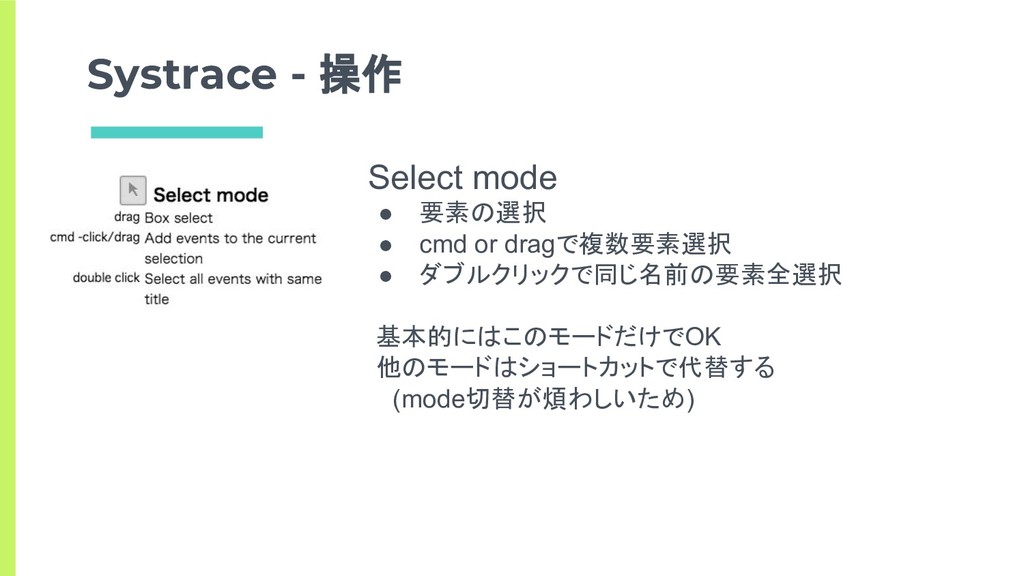
Systrace - 操作 Select mode • 要素の選択 • cmd or
dragで複数要素選択 • ダブルクリックで同じ名前の要素全選択 基本的にはこのモードだけでOK 他のモードはショートカットで代替する (mode切替が煩わしいため)
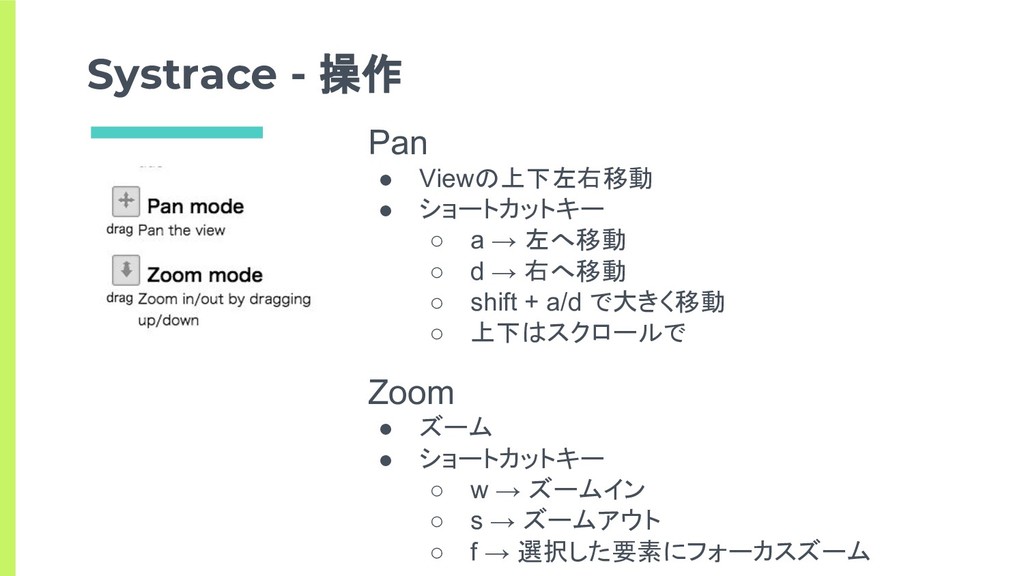
Systrace - 操作 Pan • Viewの上下左右移動 • ショートカットキー ◦ a
→ 左へ移動 ◦ d → 右へ移動 ◦ shift + a/d で大きく移動 ◦ 上下はスクロールで Zoom • ズーム • ショートカットキー ◦ w → ズームイン ◦ s → ズームアウト ◦ f → 選択した要素にフォーカスズーム
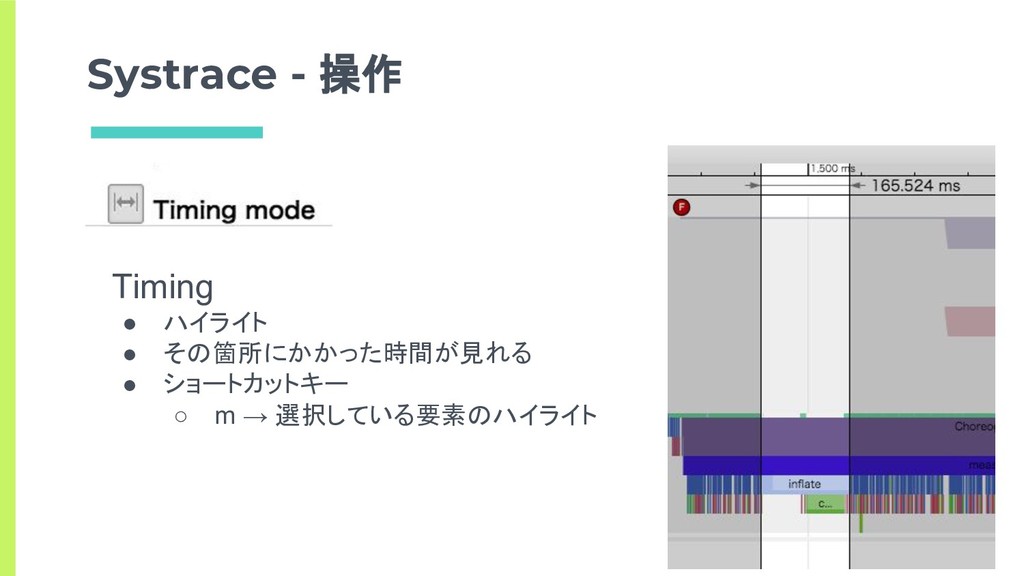
Systrace - 操作 Timing • ハイライト • その箇所にかかった時間が見れる • ショートカットキー
◦ m → 選択している要素のハイライト
画面内のどこが遅いのかを知る - まとめ ▣ わかる数値 □ どの処理が遅いか ▣ できること □
具体的なコードの改修ができる
改善例
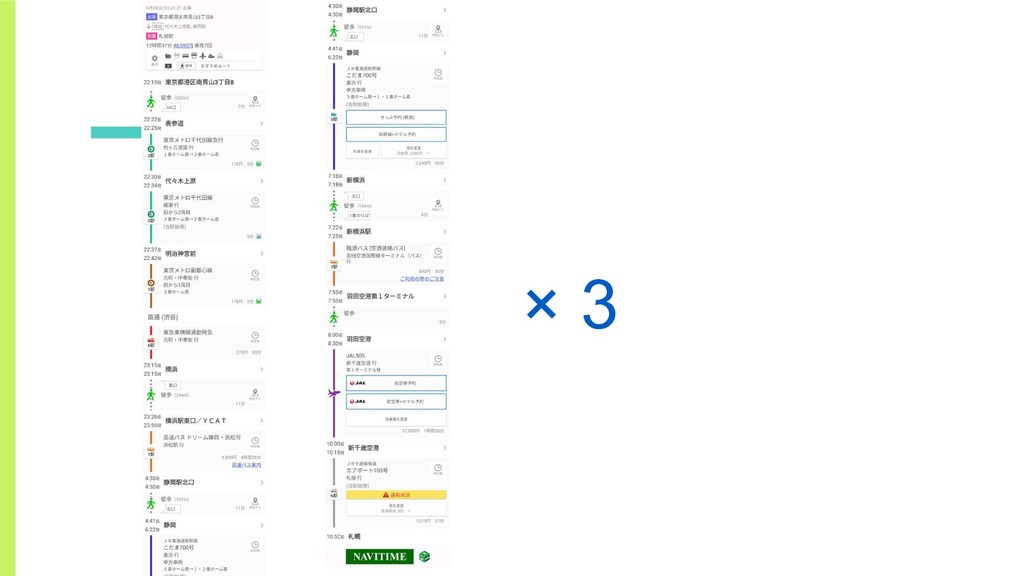
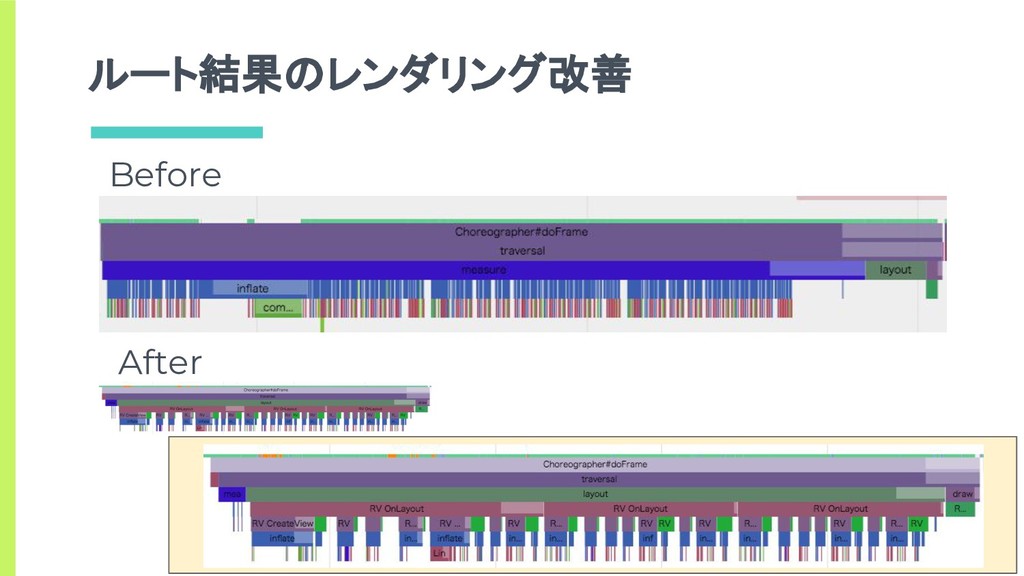
改善したこと ルート結果画面を RecyclerView化しました
× 3
ルート結果のレンダリング改善 Before After
RecyclerView化に際して ▣ 既存画面のリファクタリング(表示パターン多) □ Groupie □ 表示要素毎にItem分け. 表示パターンはItem内で吸収. ▣ パフォーマンス
□ RecycledViewPool □ ViewTypeを分けすぎないようまとめた
まとめ
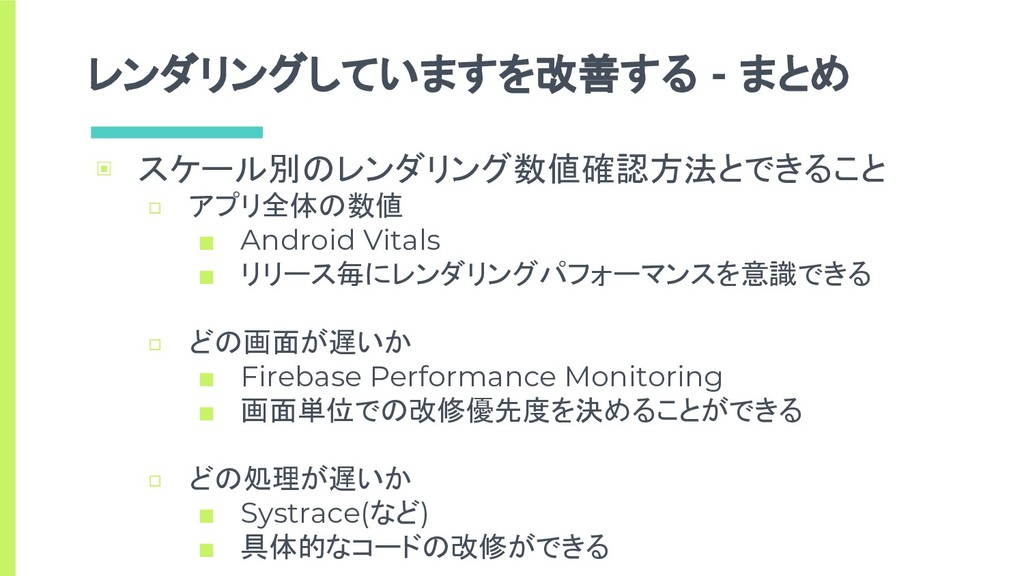
レンダリングしていますを改善する - まとめ ▣ スケール別のレンダリング数値確認方法とできること □ アプリ全体の数値 ▪ Android Vitals
▪ リリース毎にレンダリングパフォーマンスを意識できる □ どの画面が遅いか ▪ Firebase Performance Monitoring ▪ 画面単位での改修優先度を決めることができる □ どの処理が遅いか ▪ Systrace(など) ▪ 具体的なコードの改修ができる
レンダリングしていますを改善する - まとめ ▣ 改善例 □ ルート結果の例
終


 iiinaiii
 448jp
448jp
 yukiny
 econanringo
 steliosf
 andpad
 tomokon
 mpyw
mpyw
 panda728
 taiseiue
 eed3si9n
 j341nono
 neuecc
 danielanewman
 techseoconnect
 samlambert
 aleyda
 axbom
axbom
 marktimemedia
 ivargrimstad
 khoart
 schroneko
 honnibal
 jonoalderson