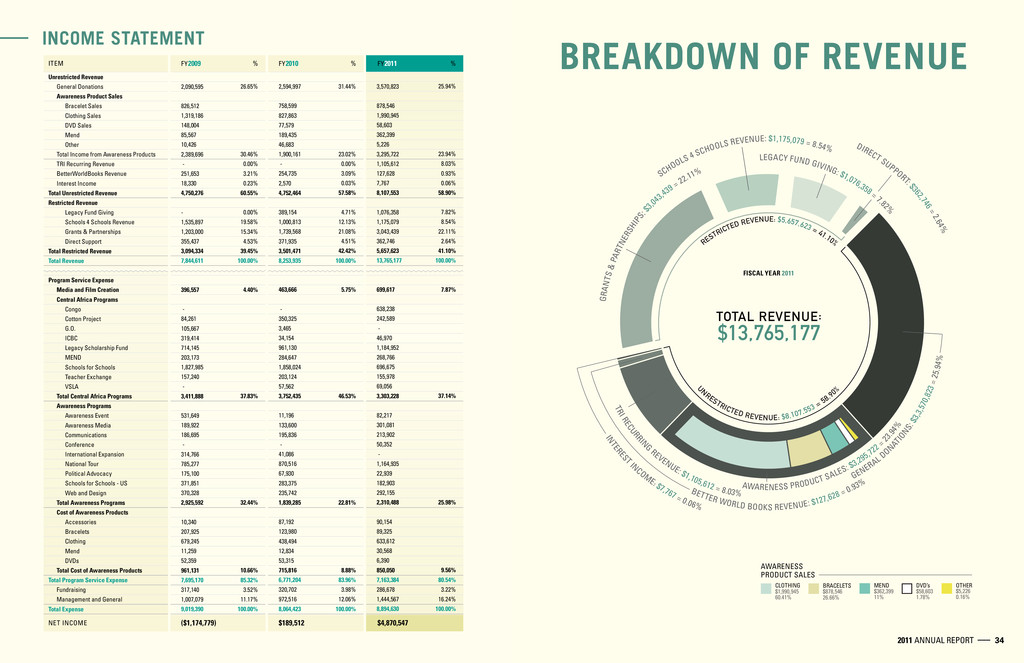
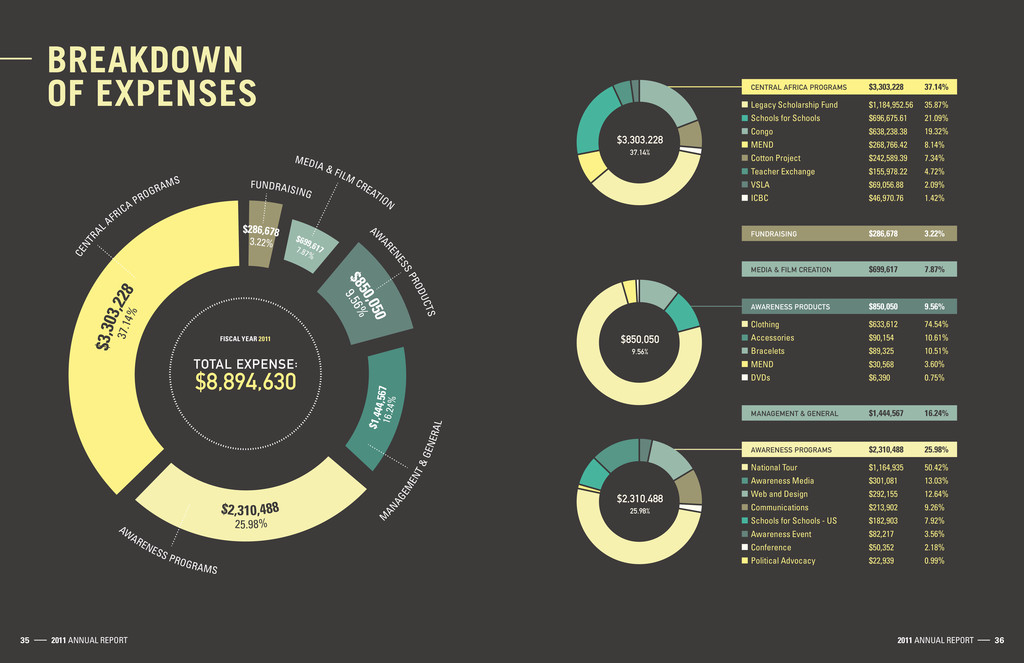
= 58.90 % RESTRICTED REVENUE: $5,657,623 = 41.10% INTEREST INCOM E: $7,767 = 0.06% BETTER WORLD BOOKS REVENUE: $127,628 = 0.93% TRI RECURRIN G REVENUE: $1,105,612 = 8.03% GRANTS & PARTNERSHIPS: $3 ,043,439 = 22.11% AWARENESS PRODUCT SALES: $3,295,722 = 23.94% GENERAL DON ATIONS: $3,3,570,823 = 25.94% AWARENESS PRODUCT SALES $58,603 1.78% DVD’s $1,990,945 60.41% CLOTHING $362,399 11% MEND $5,226 0.16% OTHER BRACELETS $878,546 26.66% SCHOOLS 4 SCHOOLS REVENUE: $1,175,079 = 8.54% LEGACY FUND GIVING: $1,076,358 = 7.8 2% DIRECT SUPPORT : $362,746 = 2.64% Unrestricted Revenue General Donations Awareness Product Sales Bracelet Sales Clothing Sales DVD Sales Mend Other Total Income from Awareness Products TRI Recurring Revenue BetterWorldBooks Revenue Interest Income Total Unrestricted Revenue Restricted Revenue Legacy Fund Giving Schools 4 Schools Revenue Grants & Partnerships Direct Support Total Restricted Revenue Total Revenue Program Service Expense Media and Film Creation Central Africa Programs Congo Cotton Project G.O. ICBC Legacy Scholarship Fund MEND Schools for Schools Teacher Exchange VSLA Total Central Africa Programs Awareness Programs Awareness Event Awareness Media Communications Conference International Expansion National Tour Political Advocacy Schools for Schools - US Web and Design Total Awareness Programs Cost of Awareness Products Accessories Bracelets Clothing Mend DVDs Total Cost of Awareness Products Total Program Service Expense Fundraising Management and General Total Expense 2,090,595 826,512 1,319,186 148,004 85,567 10,426 2,389,696 - 251,653 18,330 4,750,276 - 1,535,897 1,203,000 355,437 3,094,334 7,844,611 396,557 - 84,261 105,667 319,414 714,145 203,173 1,827,985 157,240 - 3,411,888 531,649 189,922 186,695 - 314,766 785,277 175,100 371,851 370,328 2,925,592 10,340 207,925 679,245 11,259 52,359 961,131 7,695,170 317,140 1,007,079 9,019,390 26.65% 30.46% 0.00% 3.21% 0.23% 60.55% 0.00% 19.58% 15.34% 4.53% 39.45% 100.00% 4.40% 37.83% 32.44% 10.66% 85.32% 3.52% 11.17% 100.00% 2,594,997 758,599 827,863 77,579 189,435 46,683 1,900,161 - 254,735 2,570 4,752,464 389,154 1,000,813 1,739,568 371,935 3,501,471 8,253,935 463,666 - 350,325 3,465 34,154 961,130 284,647 1,858,024 203,124 57,562 3,752,435 11,196 133,600 195,836 - 41,086 870,516 67,930 283,375 235,742 1,839,285 87,192 123,980 438,494 12,834 53,315 715,816 6,771,204 320,702 972,516 8,064,423 31.44% 23.02% 0.00% 3.09% 0.03% 57.58% 4.71% 12.13% 21.08% 4.51% 42.42% 100.00% 5.75% 46.53% 22.81% 8.88% 83.96% 3.98% 12.06% 100.00% 3,570,823 878,546 1,990,945 58,603 362,399 5,226 3,295,722 1,105,612 127,628 7,767 8,107,553 1,076,358 1,175,079 3,043,439 362,746 5,657,623 13,765,177 699,617 638,238 242,589 - 46,970 1,184,952 268,766 696,675 155,978 69,056 3,303,228 82,217 301,081 213,902 50,352 - 1,164,935 22,939 182,903 292,155 2,310,488 90,154 89,325 633,612 30,568 6,390 850,050 7,163,384 286,678 1,444,567 8,894,630 25.94% 23.94% 8.03% 0.93% 0.06% 58.90% 7.82% 8.54% 22.11% 2.64% 41.10% 100.00% 7.87% 37.14% 25.98% 9.56% 80.54% 3.22% 16.24% 100.00% ITEM FY2009 % FY2010 % FY2011 NET INCOME ($1,174,779) $189,512 $4,870,547 % !"(%,12-#+#1,1"# 0$1+8&%:"2%.2$141"'1 2011 ANNUAL REPORT ––– 34

 SiteGround - Reliable hosting with speed, security, and support you can count on.


 falcon8823
 texmeijin
 ichirokano2
 kmars0605
 tosite
 seike460
 guaca
 akit37
 ryu1013
 clockmaker
 yumnumm
 nokomoro3
 helenjbeal
 ipullrank
 honzajavorek
 stephenakadiri
 lemiorhan
 cassininazir
 cromwellryan
 livdayseo
 destraynor
 reverentgeek
 emna__ayadi