Upgrade to Pro
— share decks privately, control downloads, hide ads and more …
Speaker Deck
Features
Speaker Deck
PRO
Sign in
Sign up for free
Search
Search
d3.js: the core concepts
Search
itszero
July 19, 2015
Programming
2.5k
1
Share
Embed
Copy iframe code
Copy JS code
Copy link
Start on current slide
d3.js: the core concepts
A very introductory view of d3.js, comes with some code example people can play with.
itszero
July 19, 2015
More Decks by itszero
See All by itszero
Routing OpenStreetMap
itszero
0
1.4k
EcoSec
itszero
1
210
TaipeiFever
itszero
0
320
Other Decks in Programming
See All in Programming
そこに3びきプロダクトがいるじゃろう——生成AI時代における“価値が届かない理由”の構造
kosuket
0
220
関数型プログラミングのメリットって何だろう?
wanko_it
0
200
AWS DevOps AgentのAzure接続機能を検証して見えた活用法/Use Cases Verified for the AWS DevOps Agent's Azure Connectivity Feature
masakiokuda
0
140
[RVD26] Vibe Architecture en 2040 : Darwin a-t-il (enfin) eu raison des architectes ?
alexandretouret
0
110
えっ!!コードを読まずに開発を!?
hananouchi
0
270
Terraform標準の組織で AWS CDKをどう使うか
mu7889yoon
1
390
テーブルをDELETEした
yuzneri
0
110
為什麼你並不需要ViewModel / No, you don't need a ViewModel
lovee
1
430
PHP Application における Kubernetes 内 gRPC 通信
ganchiku
0
550
音楽のための関数型プログラミング言語mimiumにおける多段階計算の活用
tomoyanonymous
1
360
Haskell/Servantを通してWebミドルウェアを捉え直す
pizzacat83
1
620
Apache Hive: Toward a Cloud Native Lakehouse
okumin
0
160
Featured
See All Featured
Everyday Curiosity
cassininazir
0
260
Become a Pro
speakerdeck
PRO
31
6k
Jess Joyce - The Pitfalls of Following Frameworks
techseoconnect
PRO
1
310
Mozcon NYC 2025: Stop Losing SEO Traffic
samtorres
1
430
How to audit for AI Accessibility on your Front & Back End
davetheseo
0
470
HU Berlin: Industrial-Strength Natural Language Processing with spaCy and Prodigy
inesmontani
PRO
0
570
Ruling the World: When Life Gets Gamed
codingconduct
0
290
Marketing Yourself as an Engineer | Alaka | Gurzu
gurzu
0
260
How STYLIGHT went responsive
nonsquared
100
6.2k
How to Align SEO within the Product Triangle To Get Buy-In & Support - #RIMC
aleyda
2
1.7k
Deep Space Network (abreviated)
tonyrice
0
230
Designing for Timeless Needs
cassininazir
1
410
Transcript
d3.js: the Core Concepts Zero Cho
data visualization…?
None
so what is D3? d3 is an data visualization library
None
None
Data-Driven Documents notice how visualization is NOT in the title?
[ 1, 2, 3, 4 ] data <div/> <svg/> <canvas/>
HTML/SVG/else
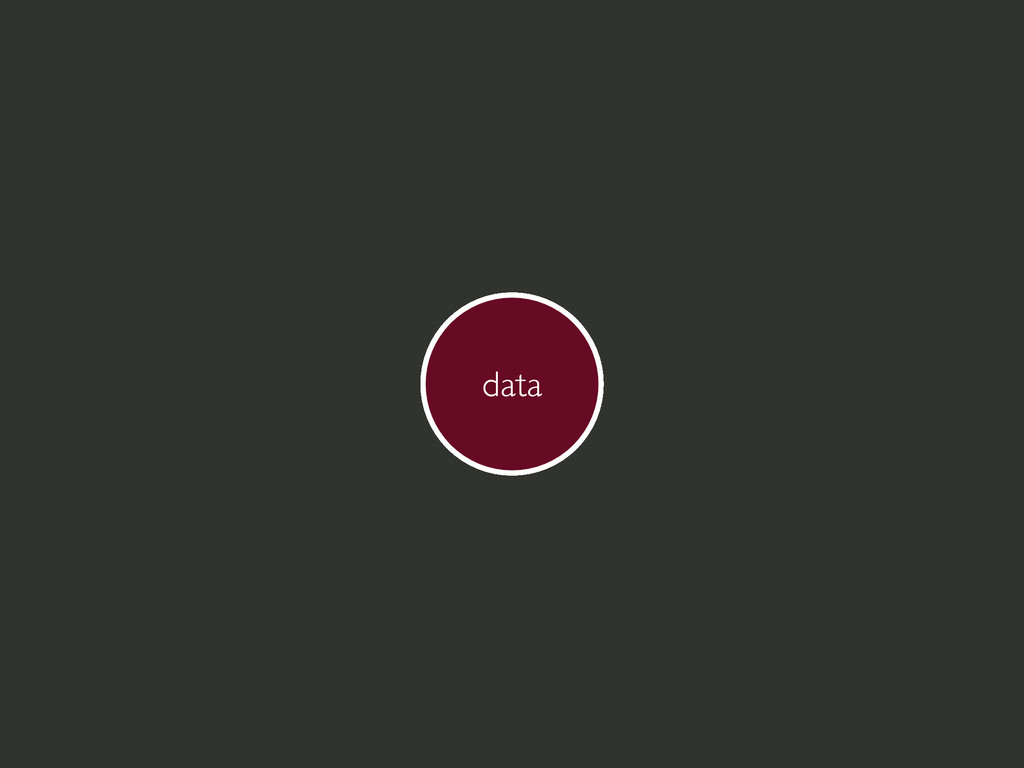
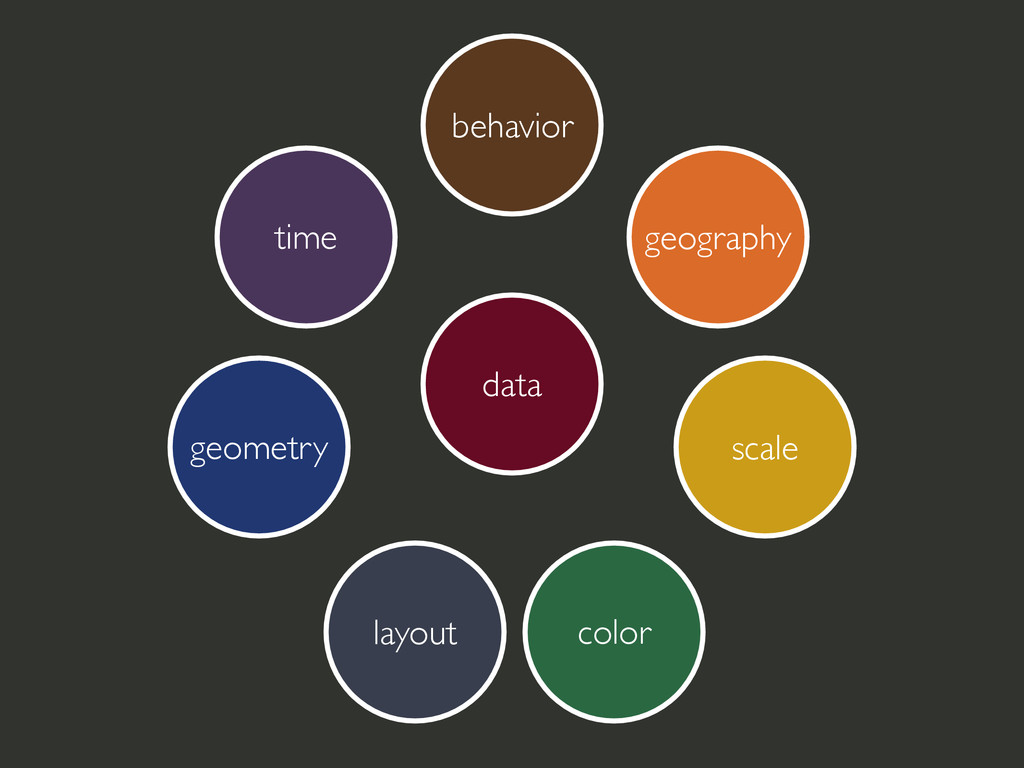
geography time scale color geometry layout behavior data
geography time scale color geometry layout behavior data
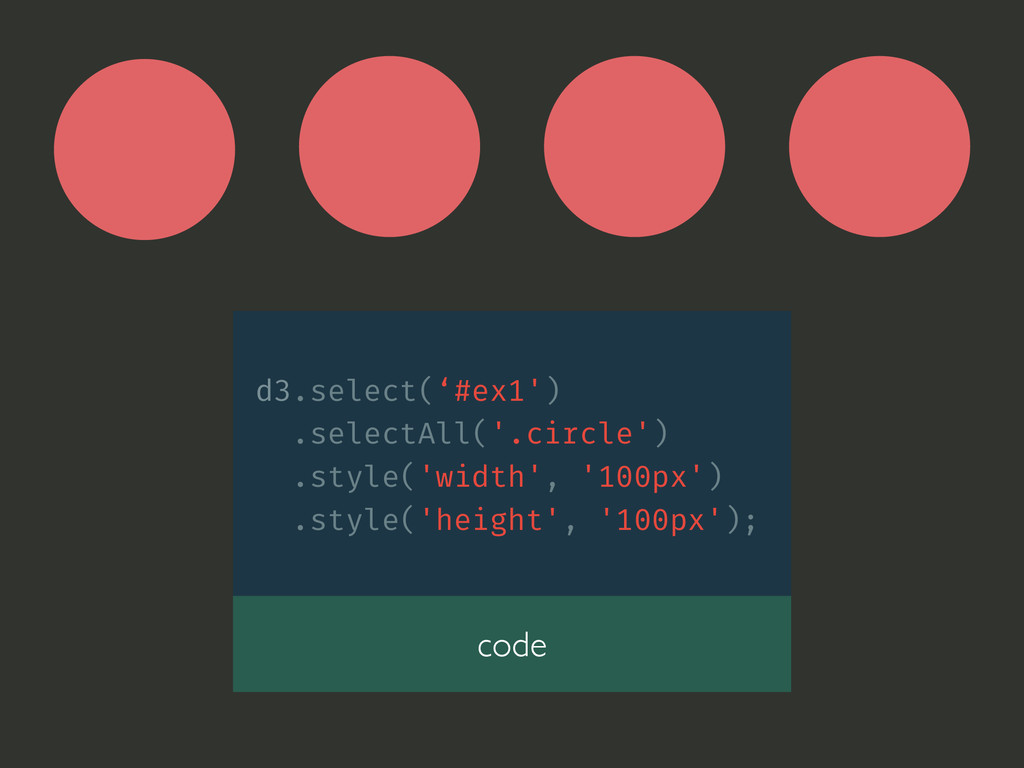
step 1: SELECT … just like jQuery
d3.select(‘#ex1') .selectAll('.circle') .style('width', '100px') .style('height', '100px'); code
step 2: BINDING … where magic happens
const data = [50, 100, 200, 300]; const funNumToPx =
(num) => `${num}px`; d3.select(‘#ex2') .selectAll('.circle') .data(data) .style('width', funNumToPx) .style('height', funNumToPx); code http://codepen.io/itszero/pen/LVrwPJ
that’s not dynamic but, you say
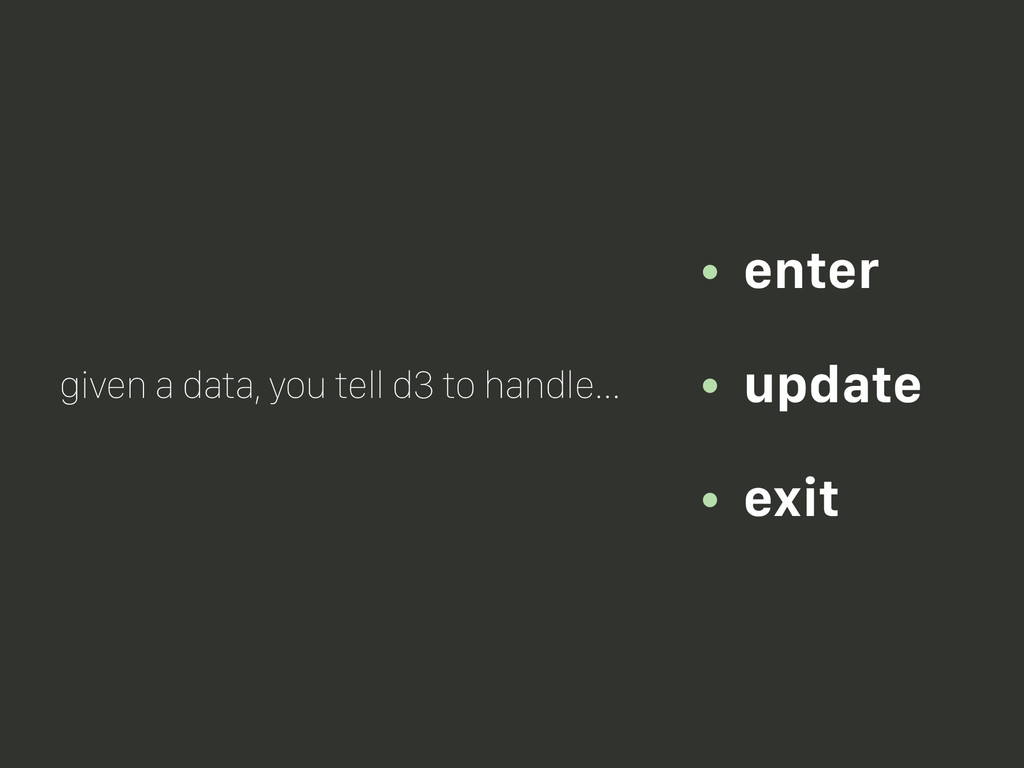
given a data, you tell d3 to handle… • enter
• update • exit
let data = []; const count = nextInt(20); for(let i=0;i<count;i++)
{ data.push(nextInt(400)); } const funNumToPx = (num) => `${num}px`; const sel = d3.select('#ex3') .selectAll('.circle') .data(data); sel.enter() .append('div') .attr('class', 'circle'); sel.transition() .duration(500) .style('width', funNumToPx) .style('height', funNumToPx); sel.exit() .remove(); code enter: create basic div exit: remove the div update: update style prep: generate an array of random numbers http://codepen.io/itszero/pen/rVKXMp
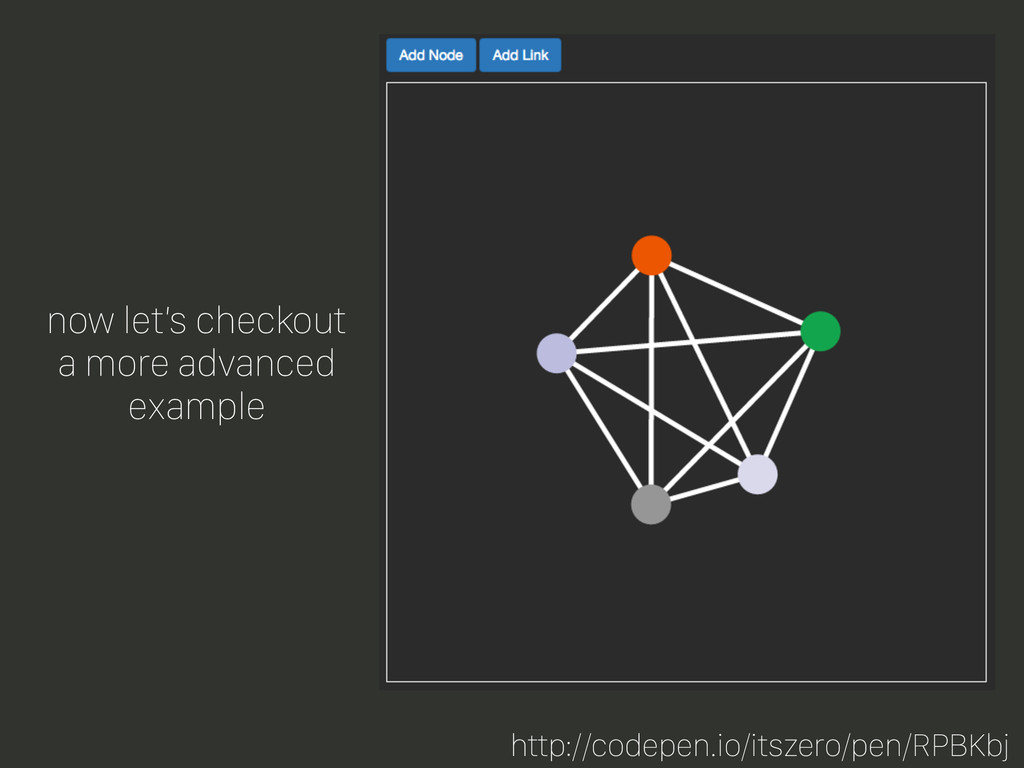
now let’s checkout a more advanced example http://codepen.io/itszero/pen/RPBKbj
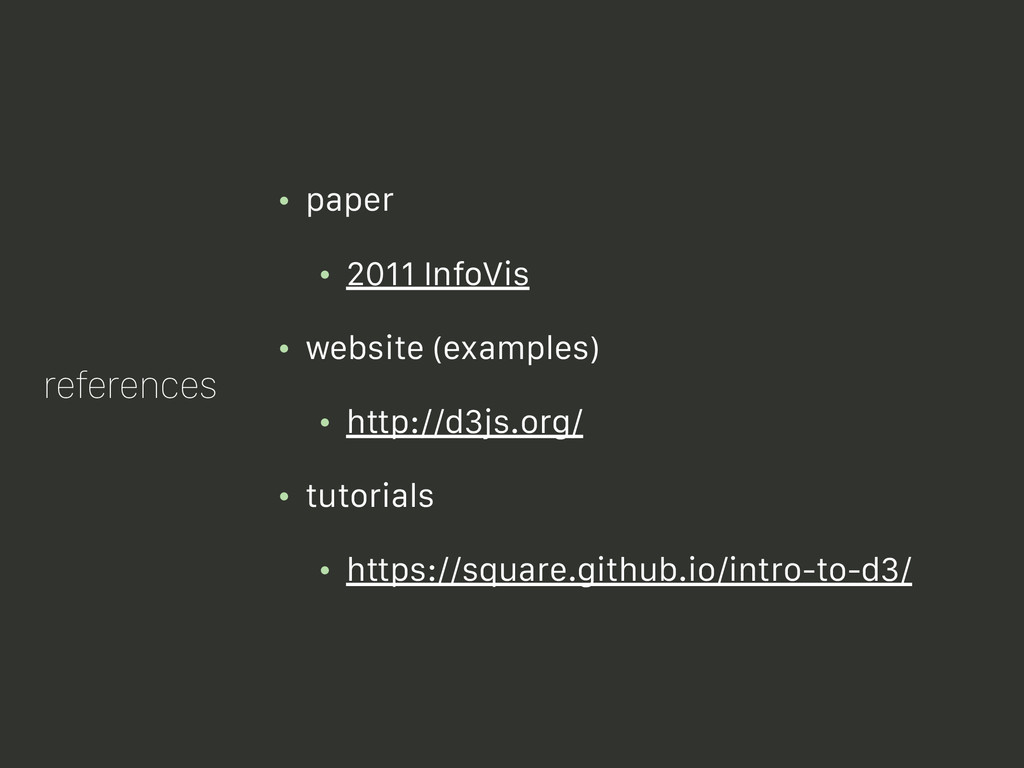
references • paper • 2011 InfoVis • website (examples) •
http://d3js.org/ • tutorials • https://square.github.io/intro-to-d3/
![[ 1, 2, 3, 4 ] data <div/> <svg/> <canvas/>](https://files.speakerdeck.com/presentations/114223fcdc1240bfbfc6afdc4235bcf1/slide_7.jpg)
![const data = [50, 100, 200, 300]; const funNumToPx =](https://files.speakerdeck.com/presentations/114223fcdc1240bfbfc6afdc4235bcf1/slide_13.jpg)
![let data = []; const count = nextInt(20); for(let i=0;i<count;i++)](https://files.speakerdeck.com/presentations/114223fcdc1240bfbfc6afdc4235bcf1/slide_16.jpg)