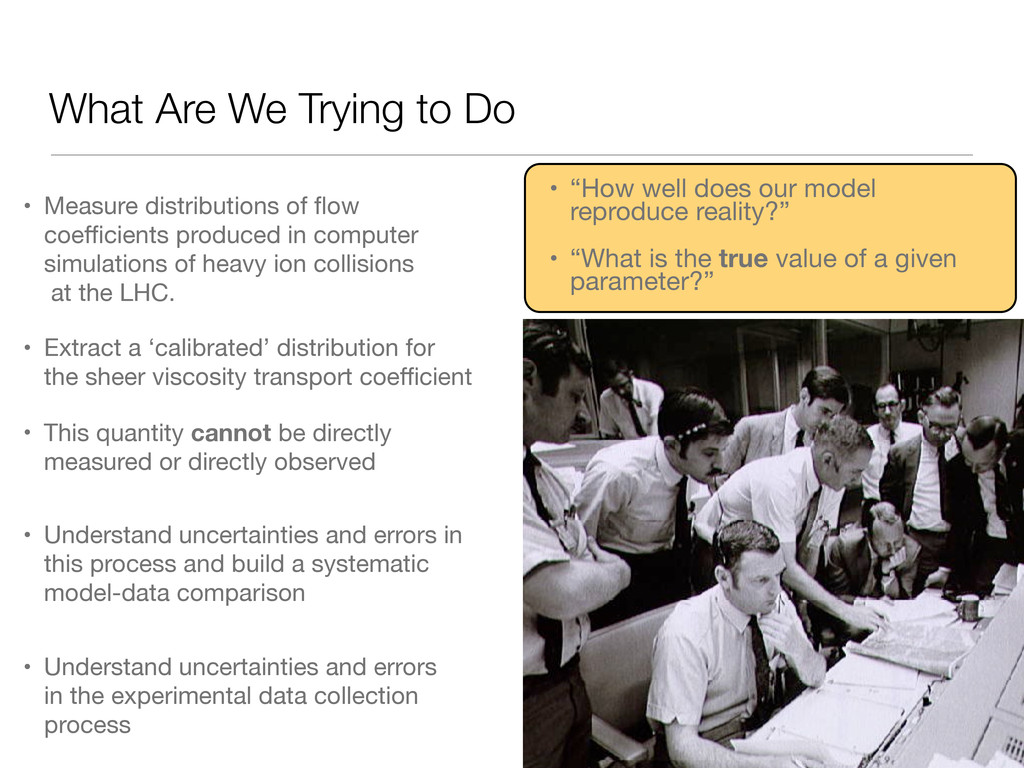
flow coefficients produced in computer simulations of heavy ion collisions at the LHC. • Extract a ‘calibrated’ distribution for the sheer viscosity transport coefficient • This quantity cannot be directly measured or directly observed • Understand uncertainties and errors in this process and build a systematic model-data comparison • Understand uncertainties and errors in the experimental data collection process • “How well does our model reproduce reality?” • “What is the true value of a given parameter?”
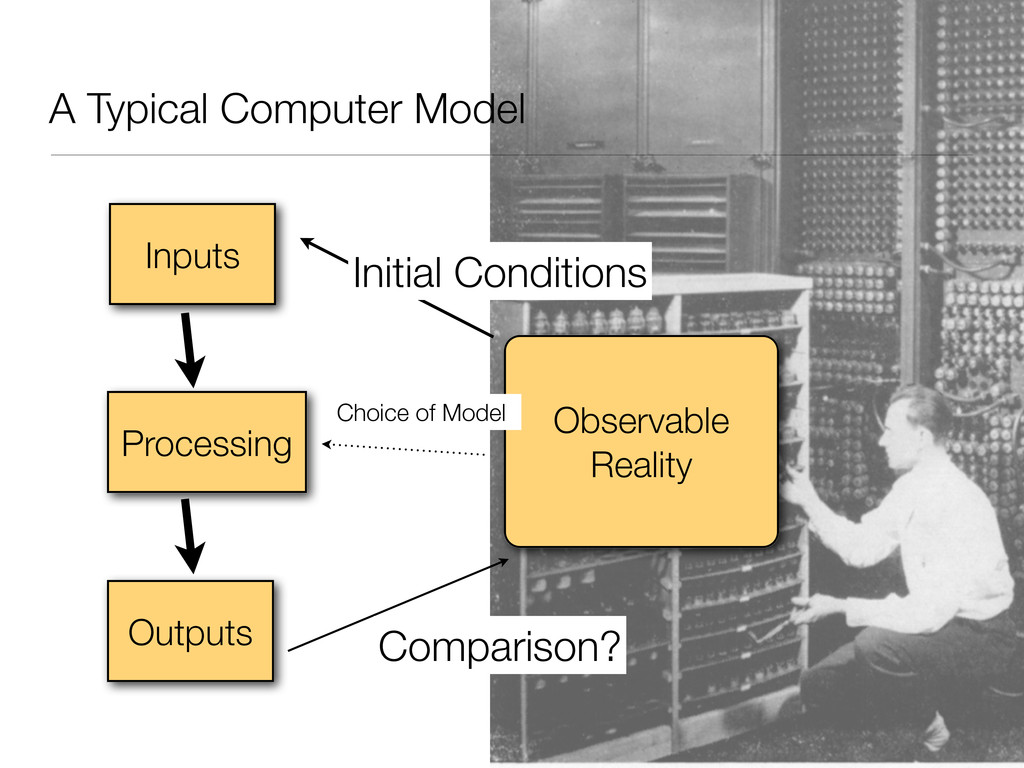
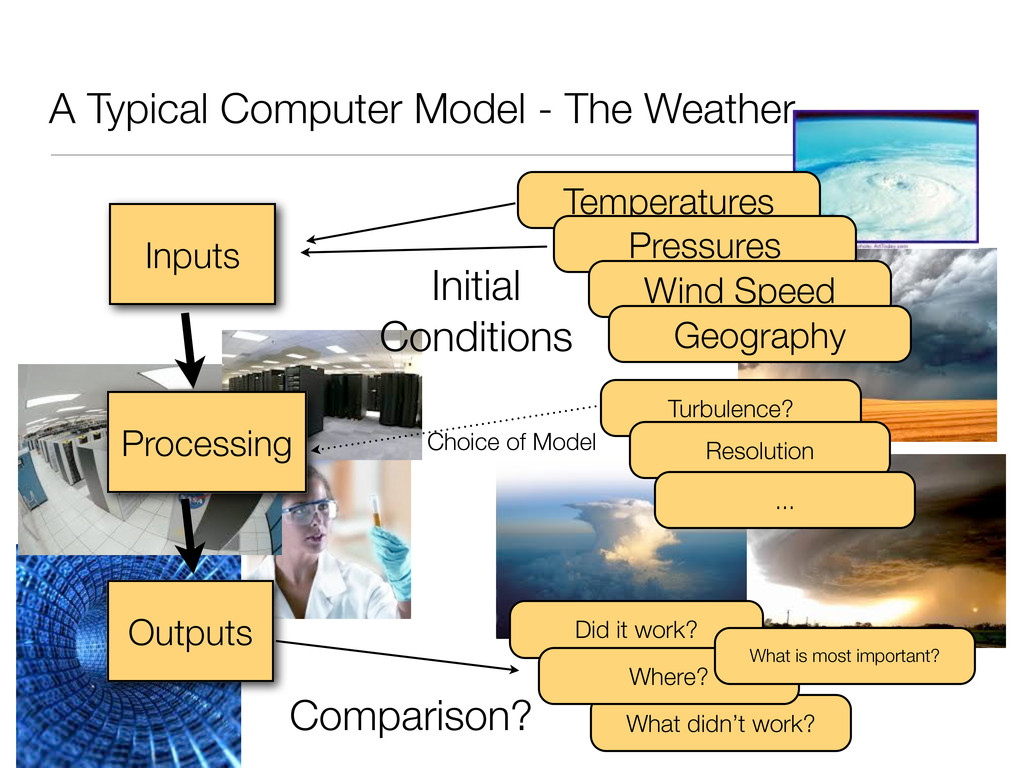
Comparison? Initial Conditions Choice of Model Temperatures Pressures Wind Speed Geography Turbulence? Resolution ... Did it work? What didn’t work? Where? What is most important?
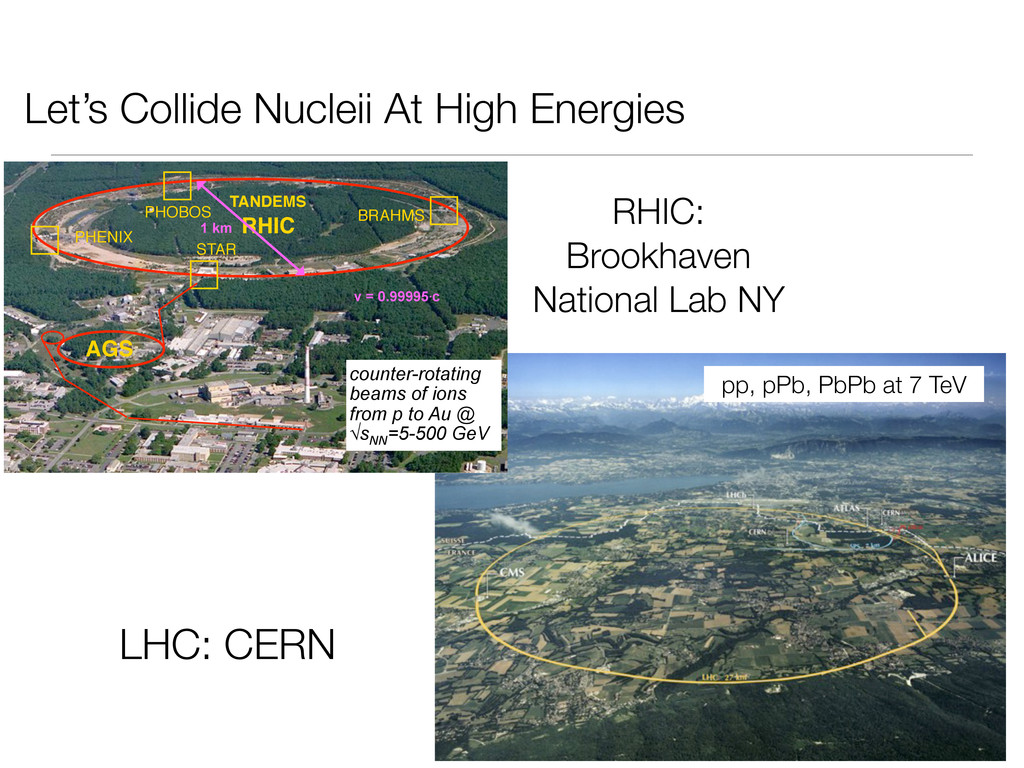
UK Summer School - Sept. 2009 22 1 km v = 0.99995⋅c counter-rotating beams of ions from p to Au @ √sNN =5-500 GeV RHIC - a collider nesday, September 16, 2009 Let’s Collide Nucleii At High Energies RHIC: Brookhaven National Lab NY LHC: CERN pp, pPb, PbPb at 7 TeV
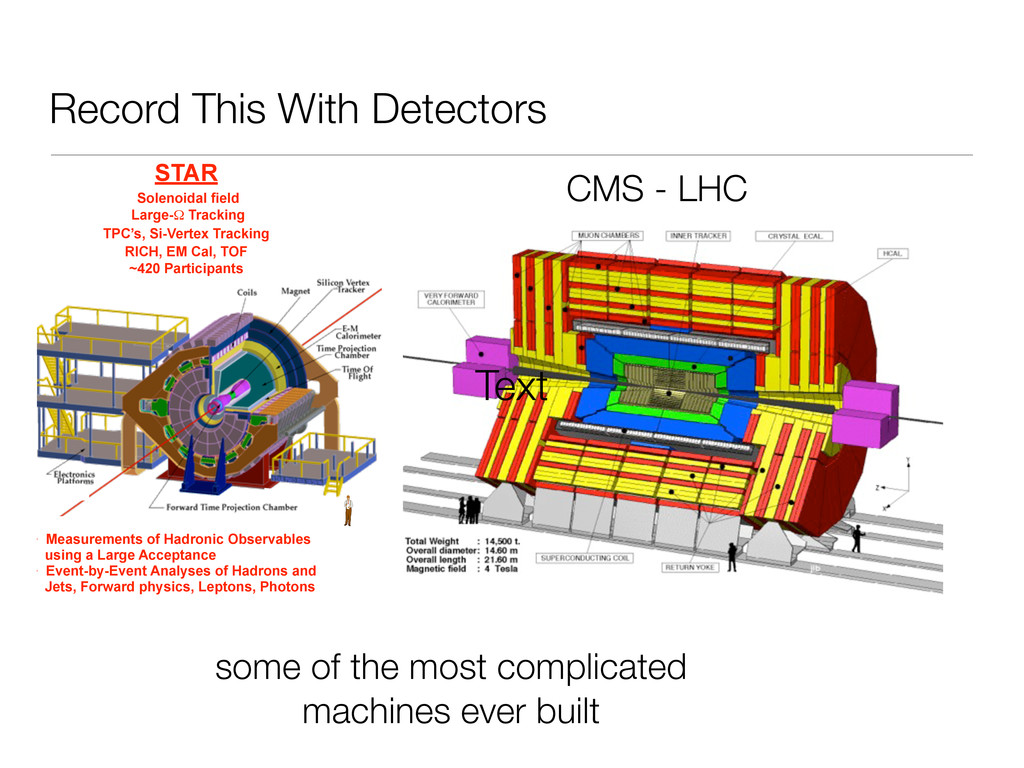
- Sept. 2009 35 STAR Solenoidal field Large-Ω Tracking TPC’s, Si-Vertex Tracking RICH, EM Cal, TOF ~420 Participants • Measurements of Hadronic Observables using a Large Acceptance • Event-by-Event Analyses of Hadrons and Jets, Forward physics, Leptons, Photons PHENIX Axial Field High Resolution & Rates 2 Central Arms, 2 Forward Arms TEC, RICH, EM Cal, Si, TOF, µ-ID ~450 Participants • Leptons, Photons, and Hadrons in Selected Solid Angles • Simultaneous Detection of Various Phase Transition Phenomena RHIC - the two “large” experiments Wednesday, September 16, 2009 some of the most complicated machines ever built Text CMS - LHC
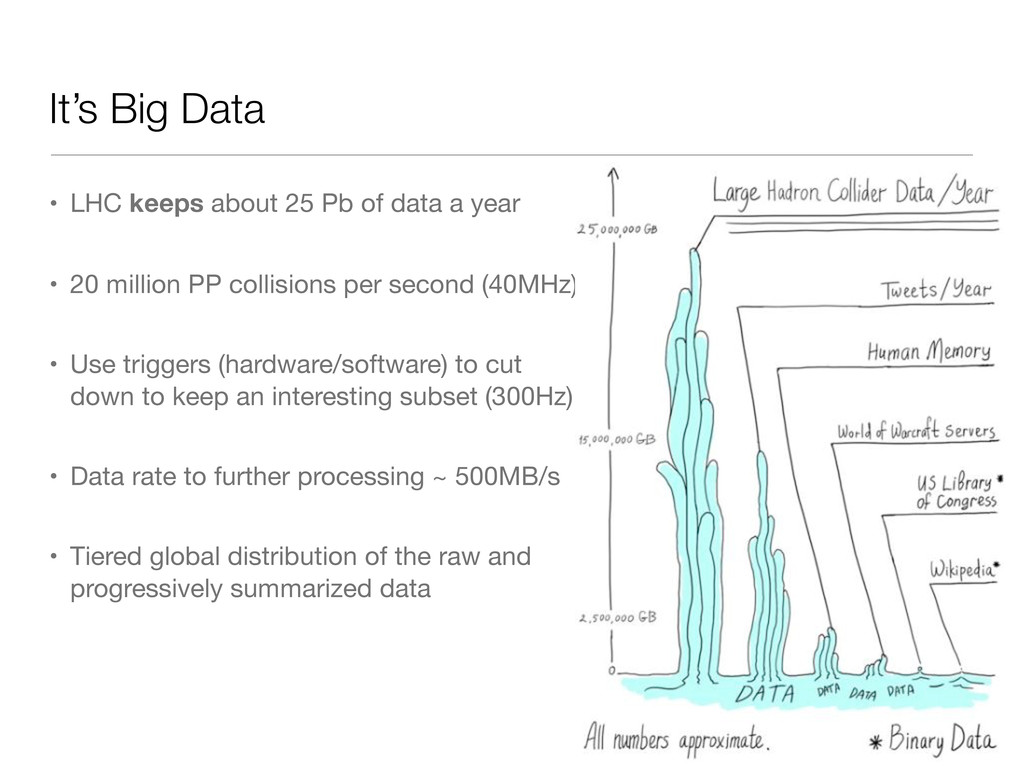
data a year • 20 million PP collisions per second (40MHz) • Use triggers (hardware/software) to cut down to keep an interesting subset (300Hz) • Data rate to further processing ~ 500MB/s • Tiered global distribution of the raw and progressively summarized data
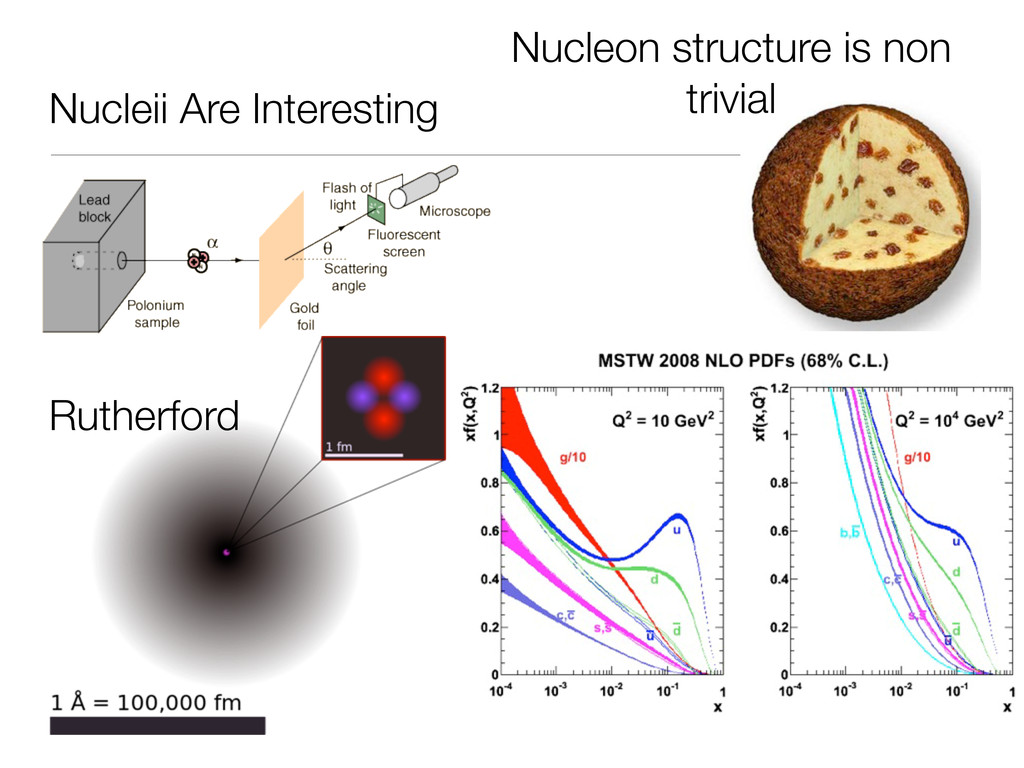
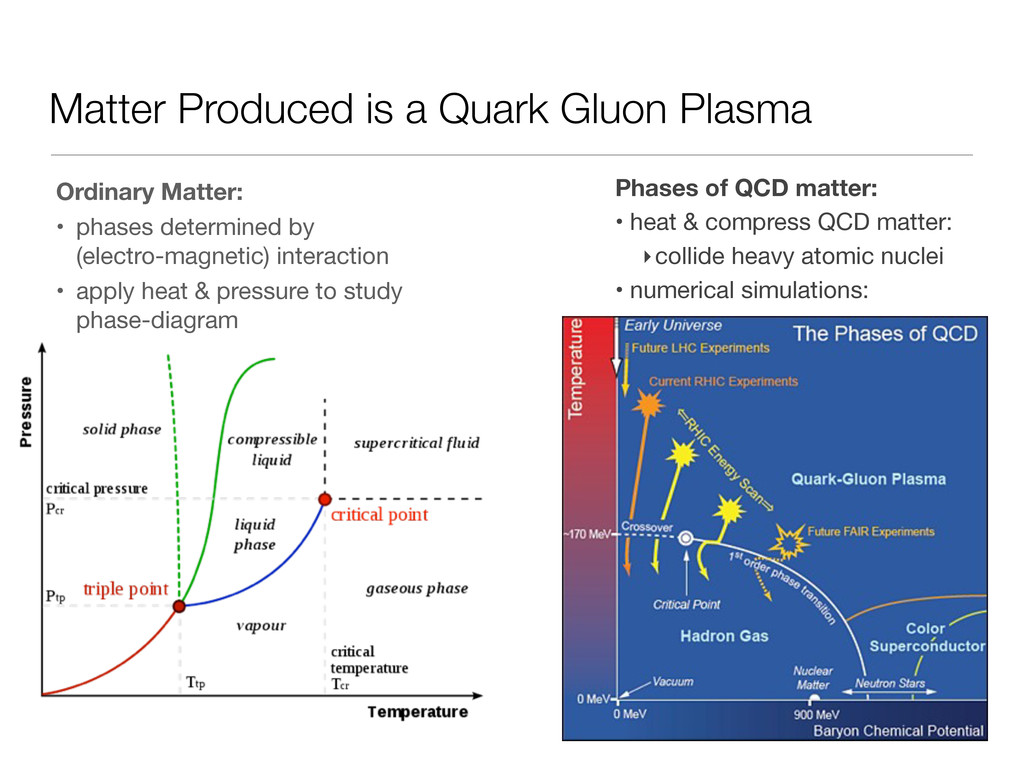
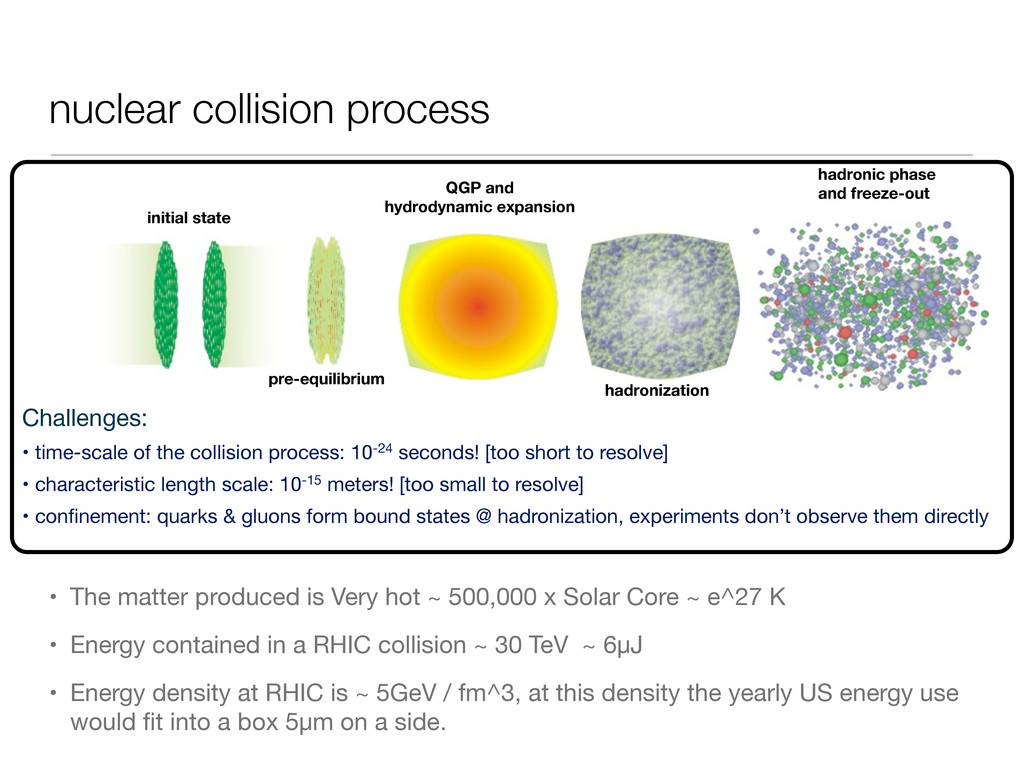
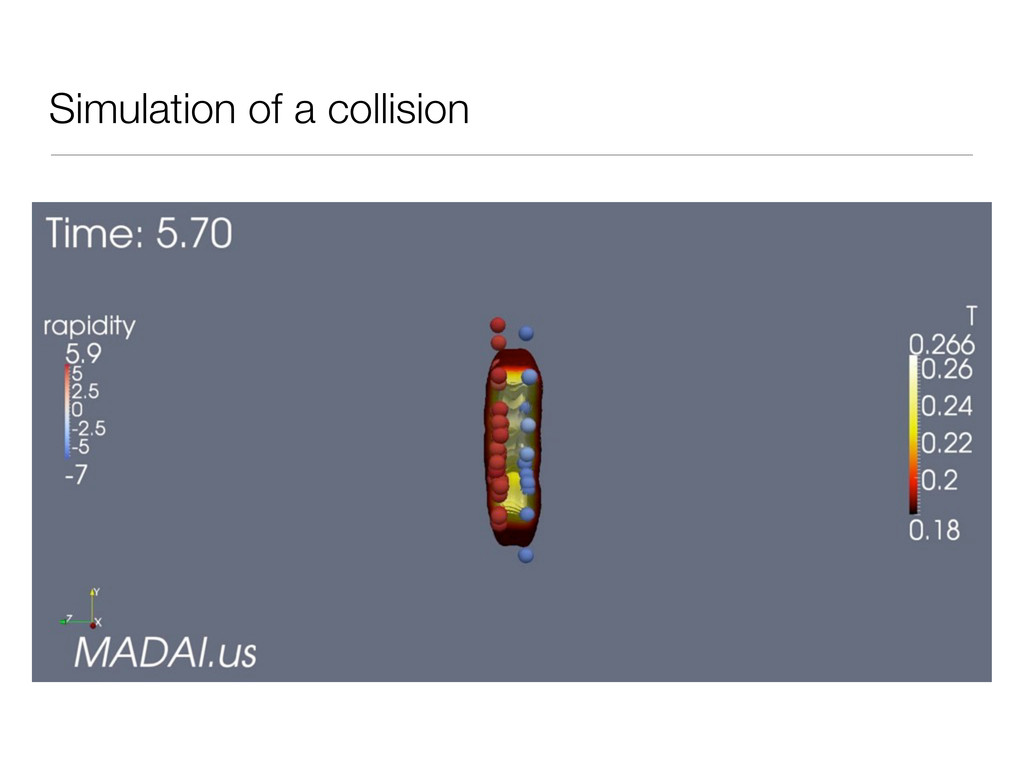
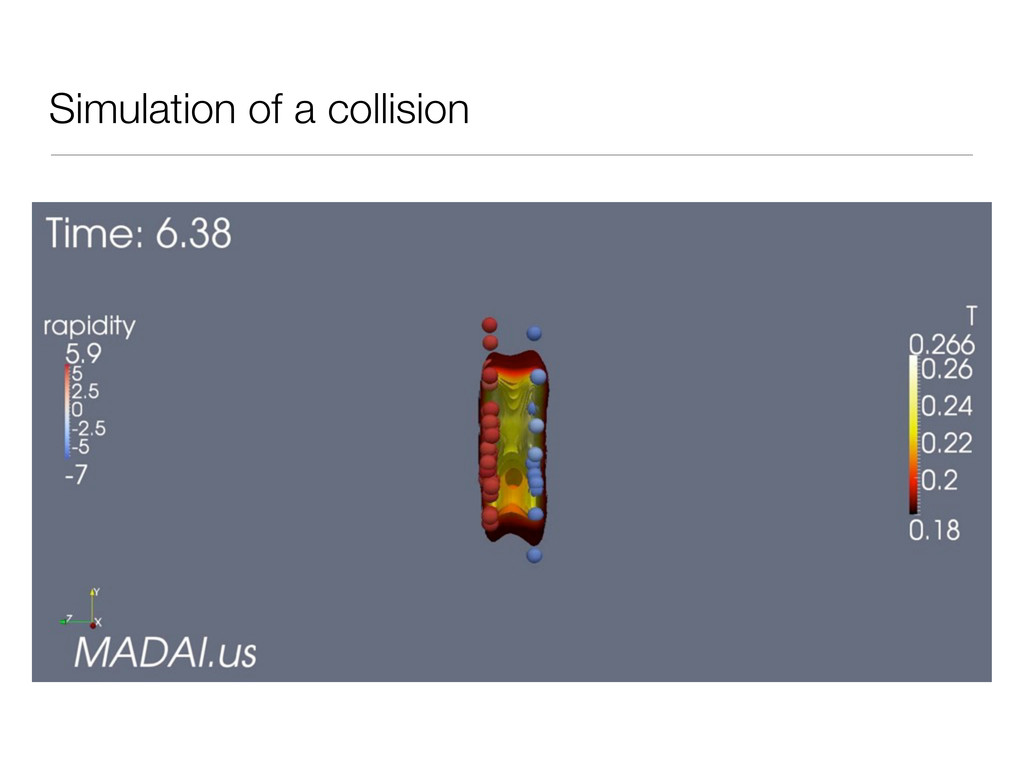
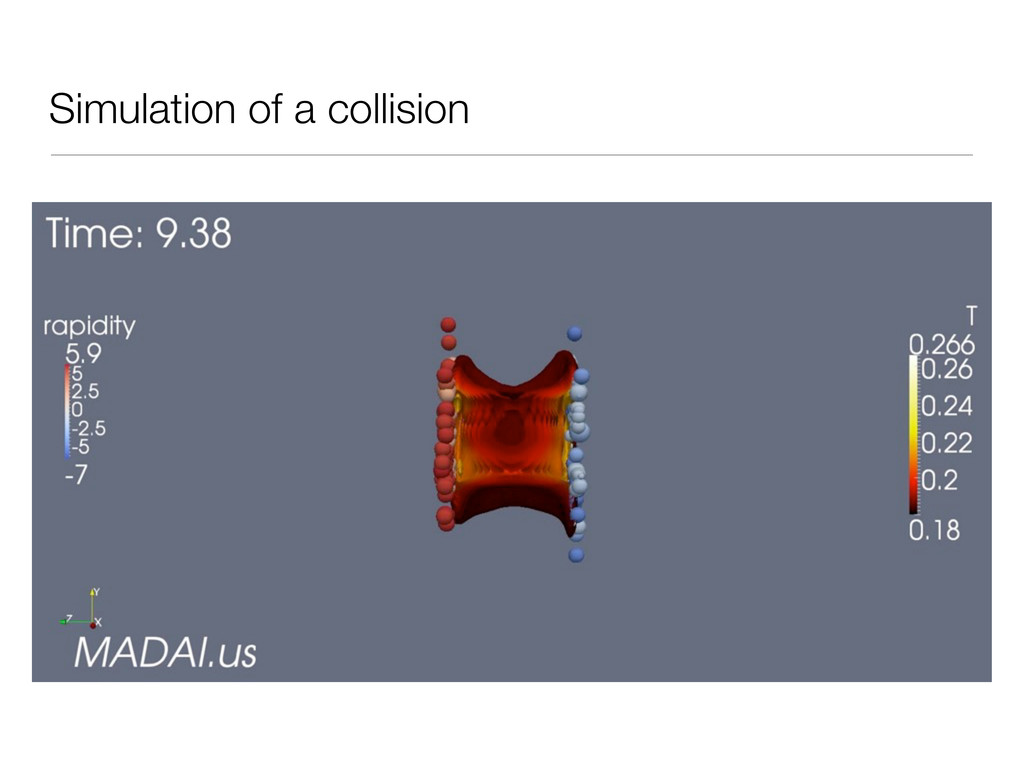
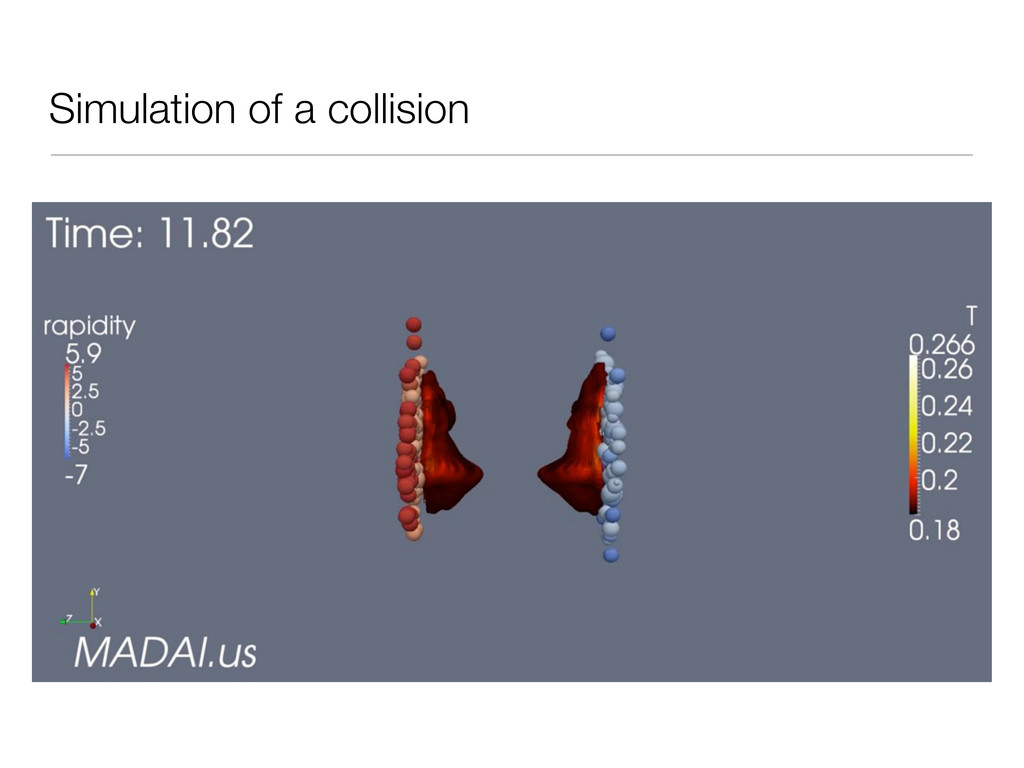
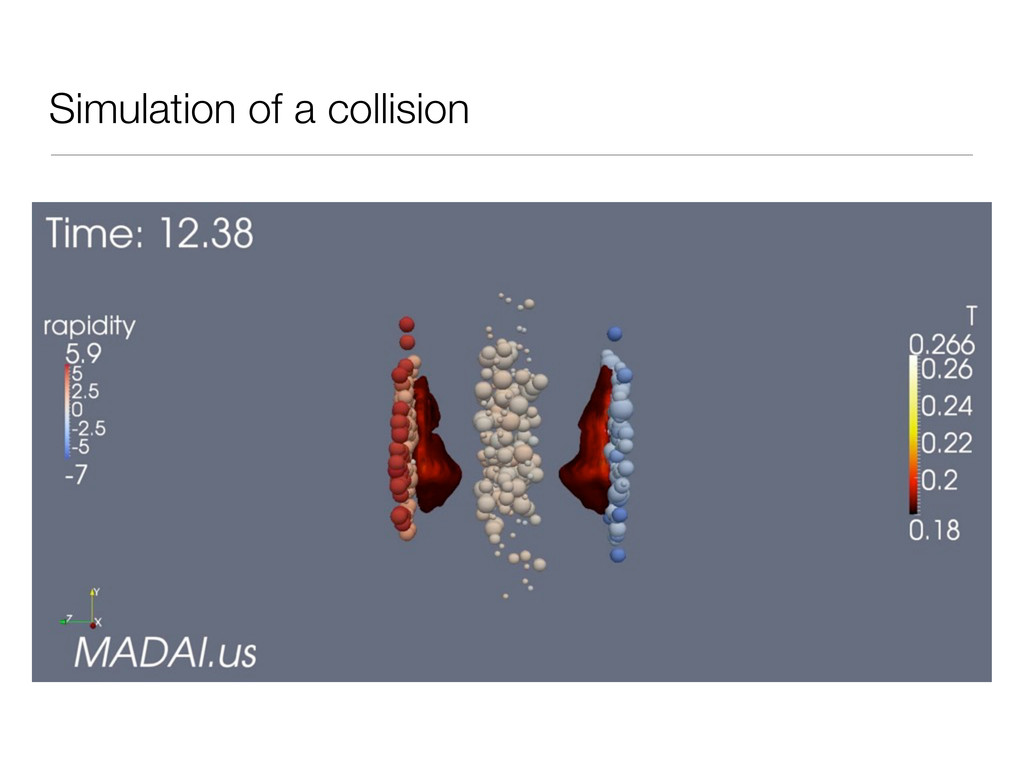
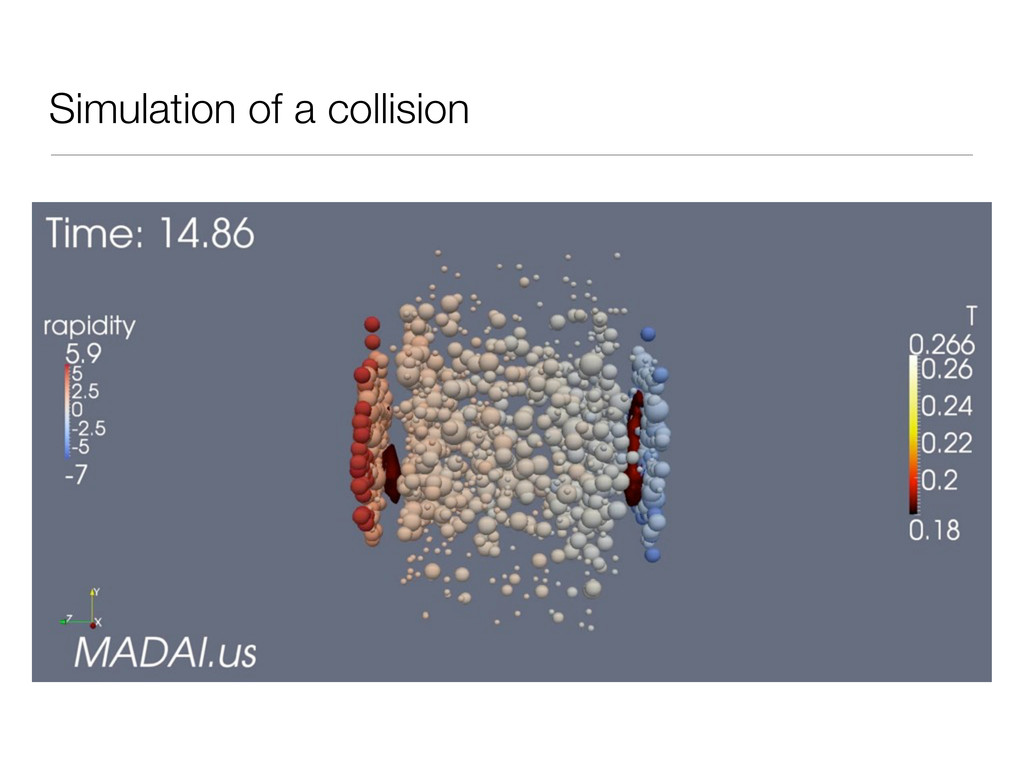
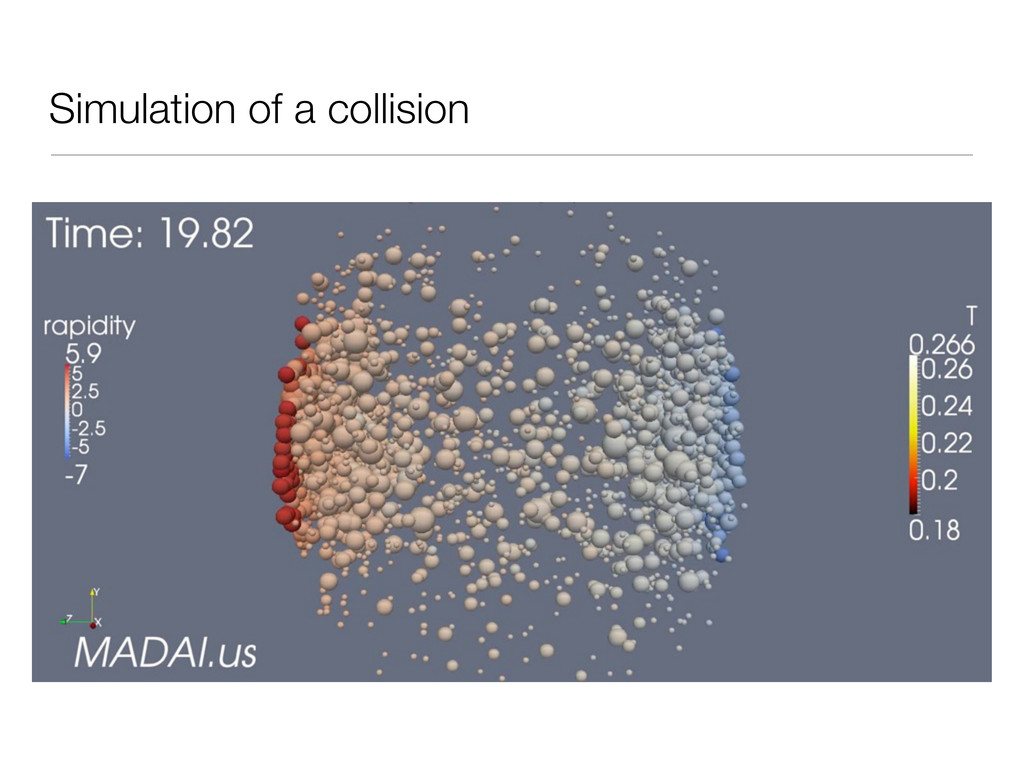
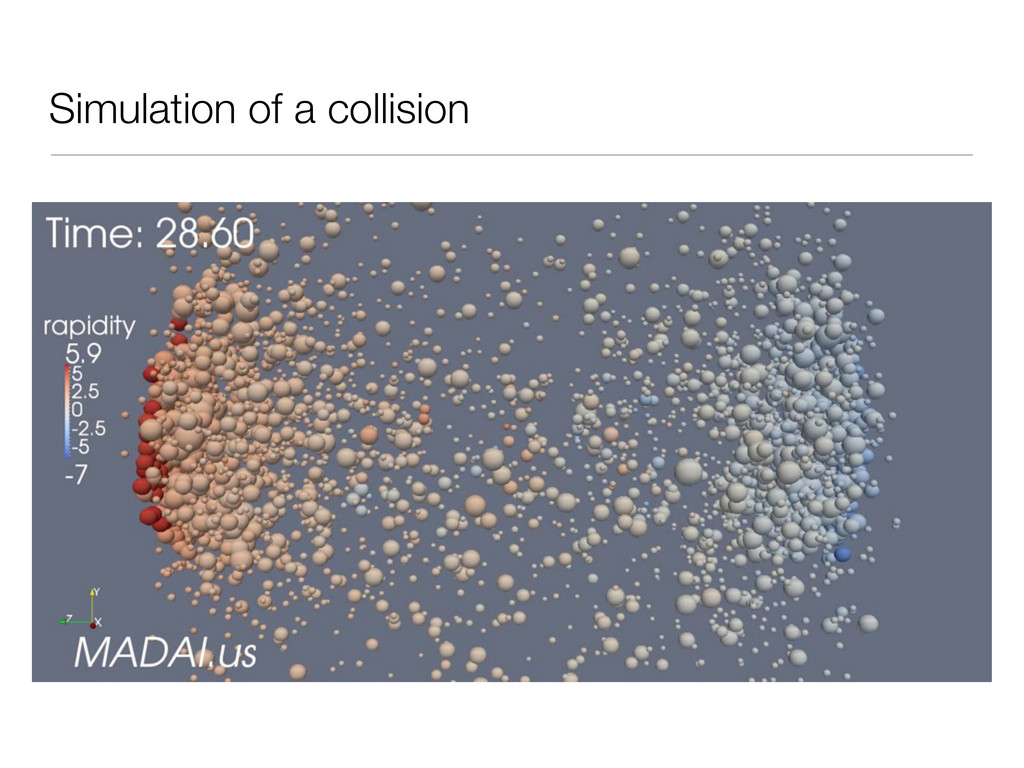
10-24 seconds! [too short to resolve] • characteristic length scale: 10-15 meters! [too small to resolve] • confinement: quarks & gluons form bound states @ hadronization, experiments don’t observe them directly initial state pre-equilibrium QGP and hydrodynamic expansion hadronization hadronic phase and freeze-out • The matter produced is Very hot ~ 500,000 x Solar Core ~ e^27 K • Energy contained in a RHIC collision ~ 30 TeV ~ 6µJ • Energy density at RHIC is ~ 5GeV / fm^3, at this density the yearly US energy use would fit into a box 5µm on a side.
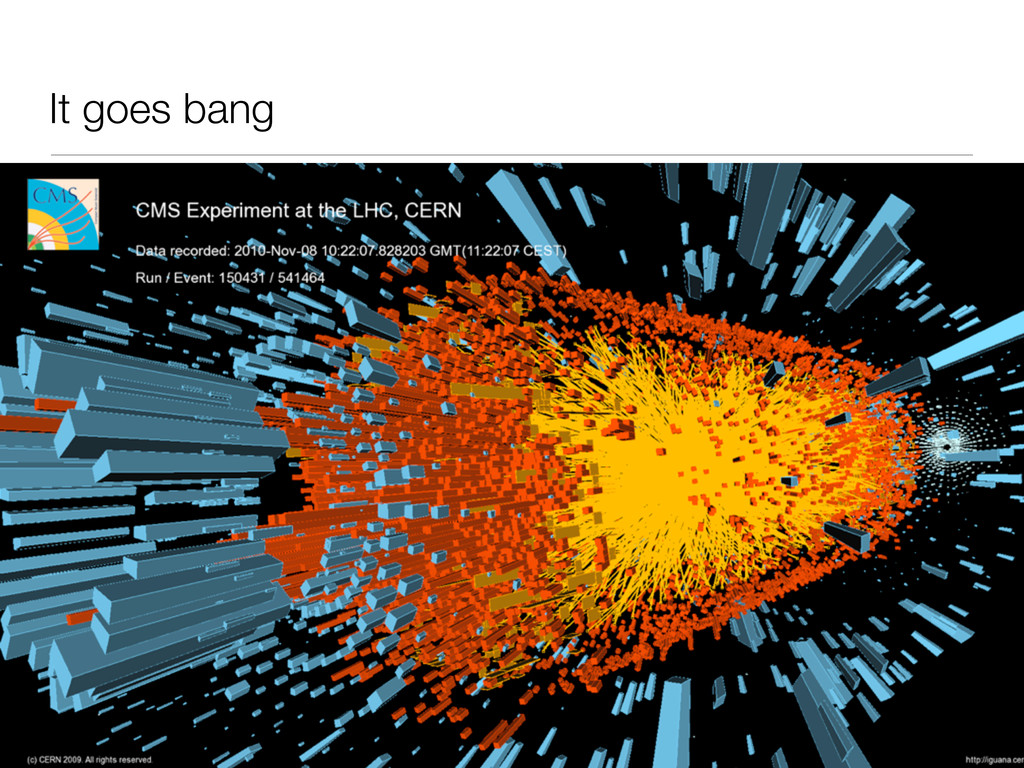
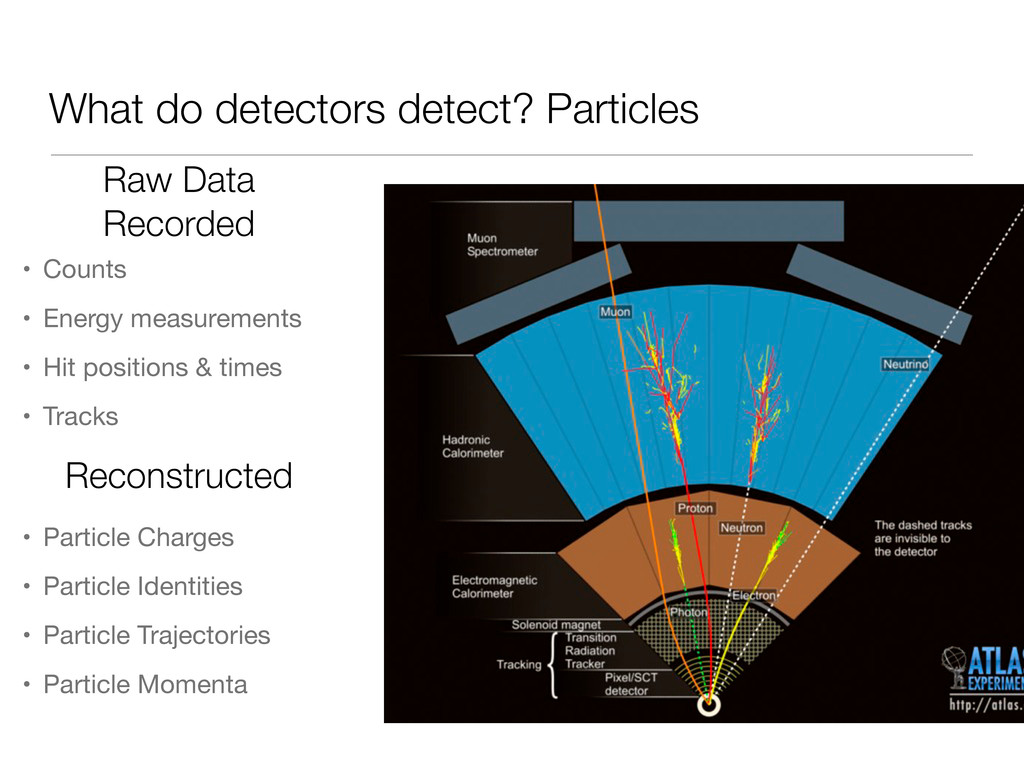
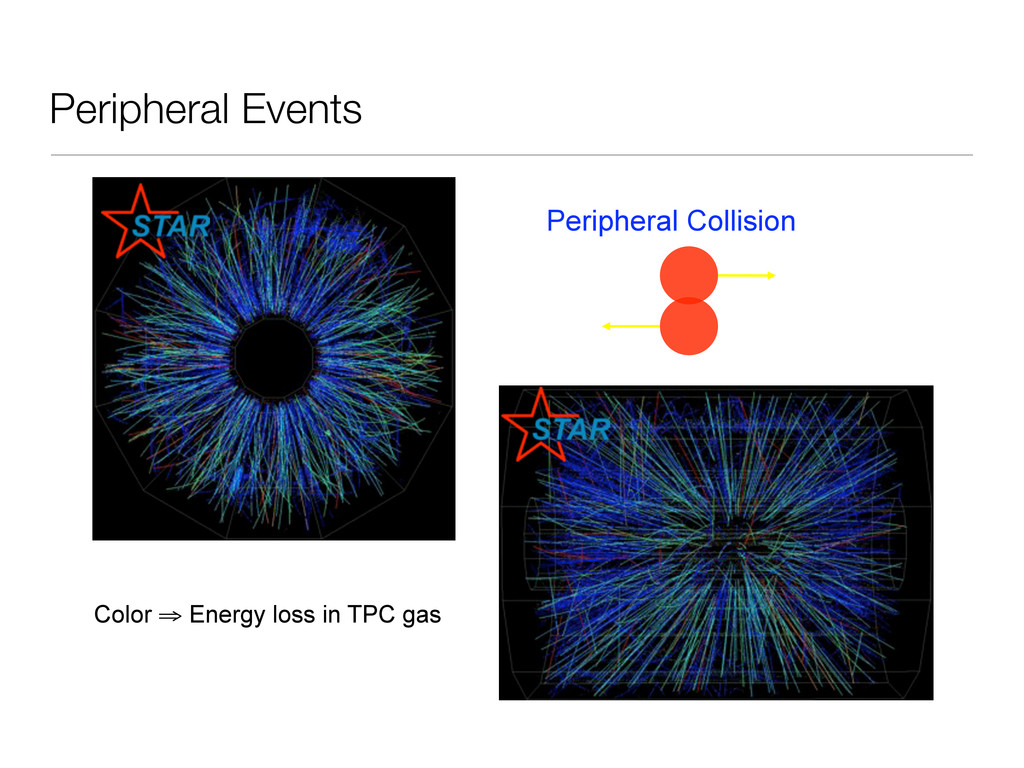
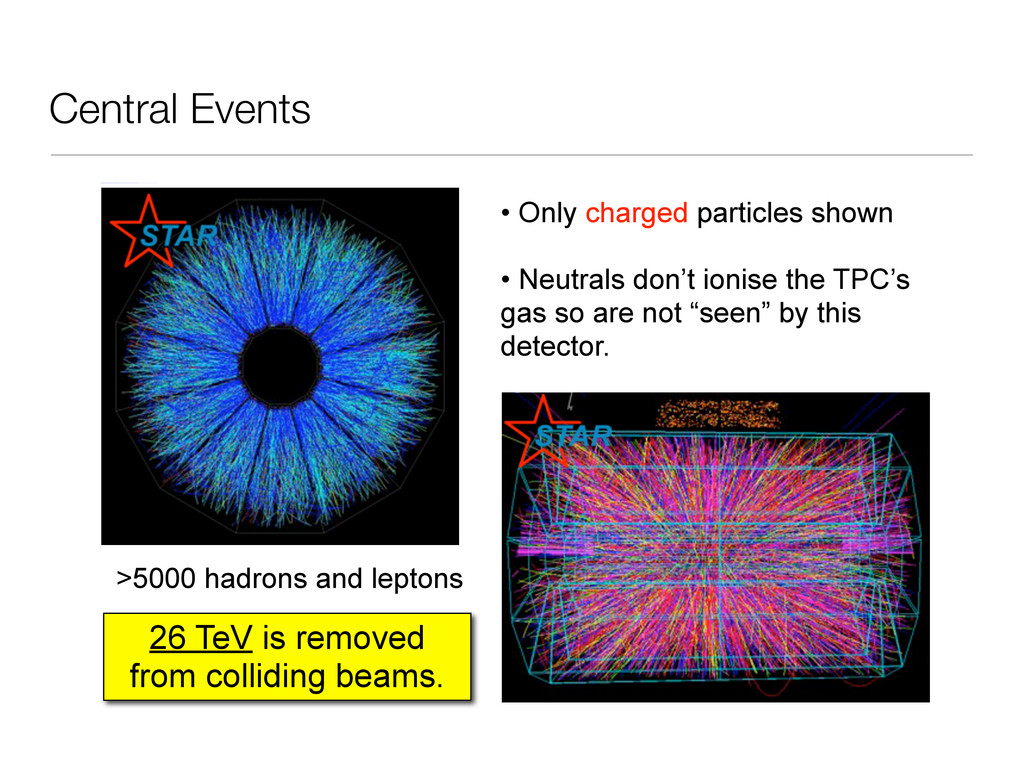
• Only charged particles shown • Neutrals don’t ionise the TPC’s gas so are not “seen” by this detector. 39.4 TeV in central Au-Au collision 26 TeV is removed from colliding beams. >5000 hadrons and leptons Central Events
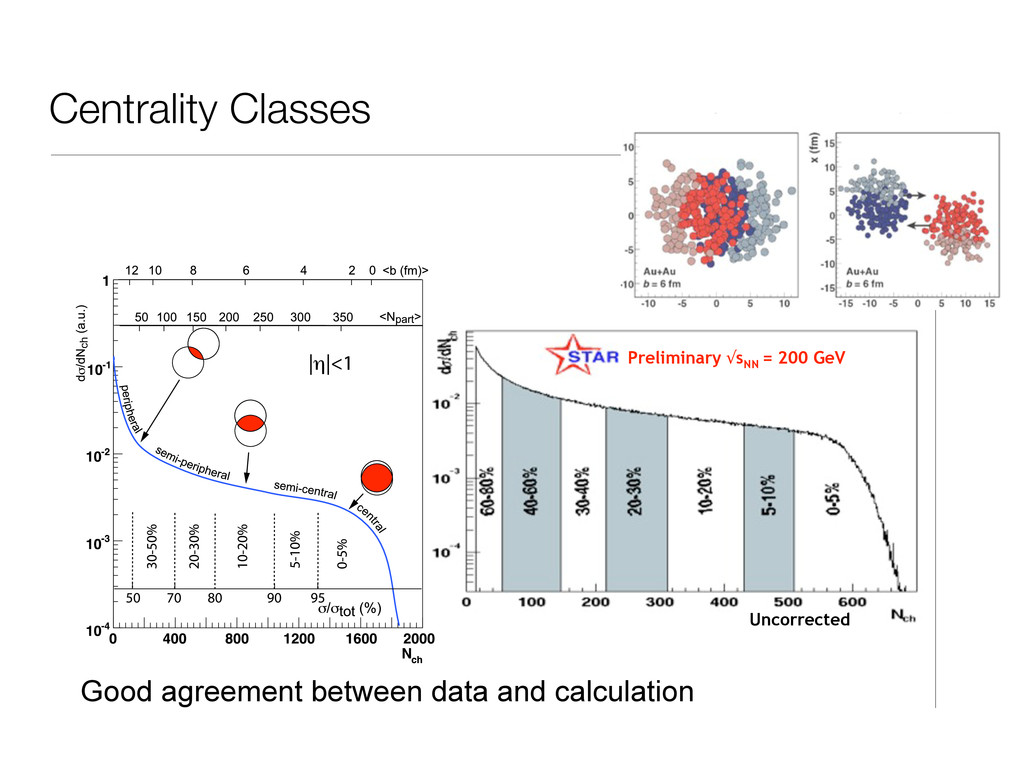
data and calculation Preliminary √sNN = 200 GeV Uncorrected Mean values of such quantities can be extracted for classes of (Nevt) mea- events via a mapping procedure. Typically a measured distribution (e.g., /dNch) is mapped to the corresponding distribution obtained from phe- nological Glauber calculations. This is done by defining “centrality classes” h the measured and calculated distributions and then connecting the mean from the same centrality class in the two distributions. The specifics of this ng procedure differ both between experiments as well as between collision ms within a given experiment. Herein we briefly summarize the principles arious implementations of centrality definition. Methodology e 8: A cartoon example of the correlation of the final state observable ith Glauber calculated quantities (b, Npart). The plotted distribution and s values are illustrative and not actual measurements (T. Ullrich, private Helen Caines -XVth UK Summer School - Sept. 2009 13 – Analytic overlap calculation from integration over nuclear shape functions, weighted with appropriate N-N cross-section • Monte Carlo Glauber – Randomly initialize nucleons sampling nuclear shape – At randomly selected impact parameter, allow nuclei to interact – Randomly sample probability of nucleons to interact from interaction cross-section • e.g. if distance d between nucleons is < √σint /π Wednesday, September 16, 2009
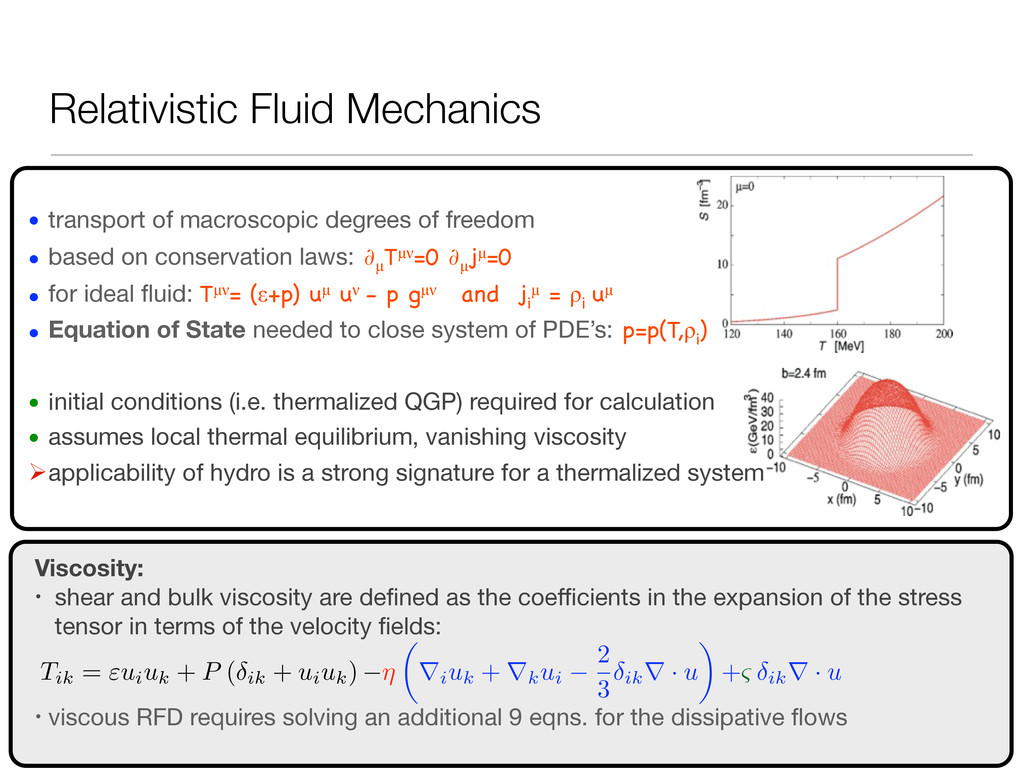
• based on conservation laws: ∂µ Tµν=0 ∂µ jµ=0 • for ideal fluid: Tµν= (ε+p) uµ uν - p gµν and j i µ = ρi uµ • Equation of State needed to close system of PDE’s: p=p(T,ρi ) • initial conditions (i.e. thermalized QGP) required for calculation • assumes local thermal equilibrium, vanishing viscosity applicability of hydro is a strong signature for a thermalized system Viscosity: • shear and bulk viscosity are defined as the coefficients in the expansion of the stress tensor in terms of the velocity fields: • viscous RFD requires solving an additional 9 eqns. for the dissipative flows Tik = ⇤uiuk + P ( ik + uiuk ) ⇥ ⇤iuk + ⇤kui 2 3 ik ⇤ · u ⇥ +⌅ ik ⇤ · u
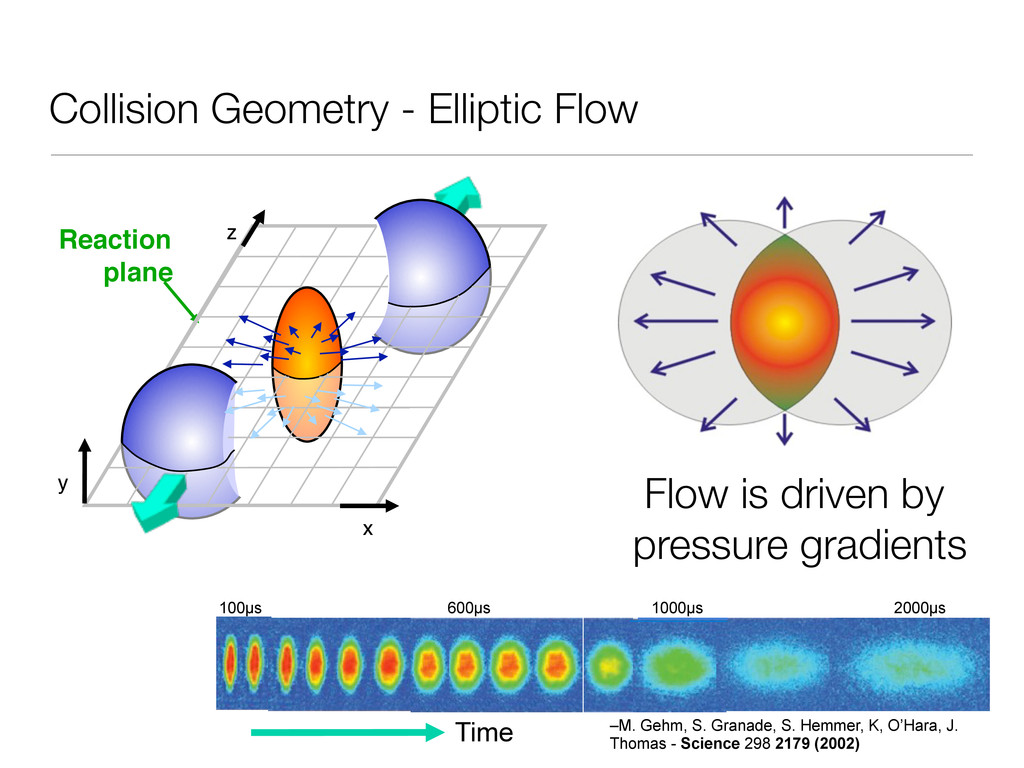
φ pT Anisotropic/Elliptic flow Almond shape overlap region in coordinate space Anisotropy in momentum space Interactions/ Rescattering dN/dφ ~ 1+2 v 2 (p T )cos(2φ) + …. φ=atan(p y /p x ) v 2 =〈cos2φ〉 v 2 : 2nd harmonic Fourier coefficient in dN/dφ with respect to the reaction plane Time –M. Gehm, S. Granade, S. Hemmer, K, O’Hara, J. Thomas - Science 298 2179 (2002) 2000µs 1000µs 100µs 600µs Flow is driven by pressure gradients
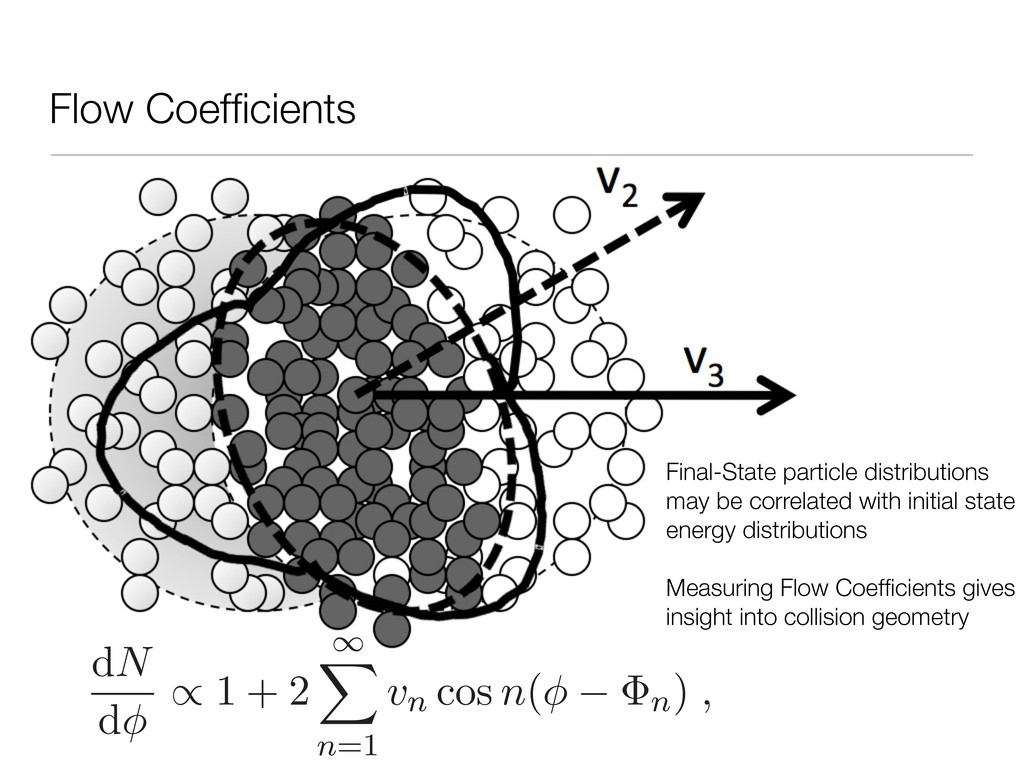
La hot, dense matter that is thought to be composed of s luons. A useful tool to study the properties of this m f particle emission in the transverse plane [1, 2]. This m pressure-driven anisotropic expansion (referred to as d is described by a Fourier expansion of the particle dist und the beam direction: dN dφ ∝ 1 + 2 ∞ n=1 vn cos n(φ − Φn) , Final-State particle distributions may be correlated with initial state energy distributions Measuring Flow Coefficients gives insight into collision geometry
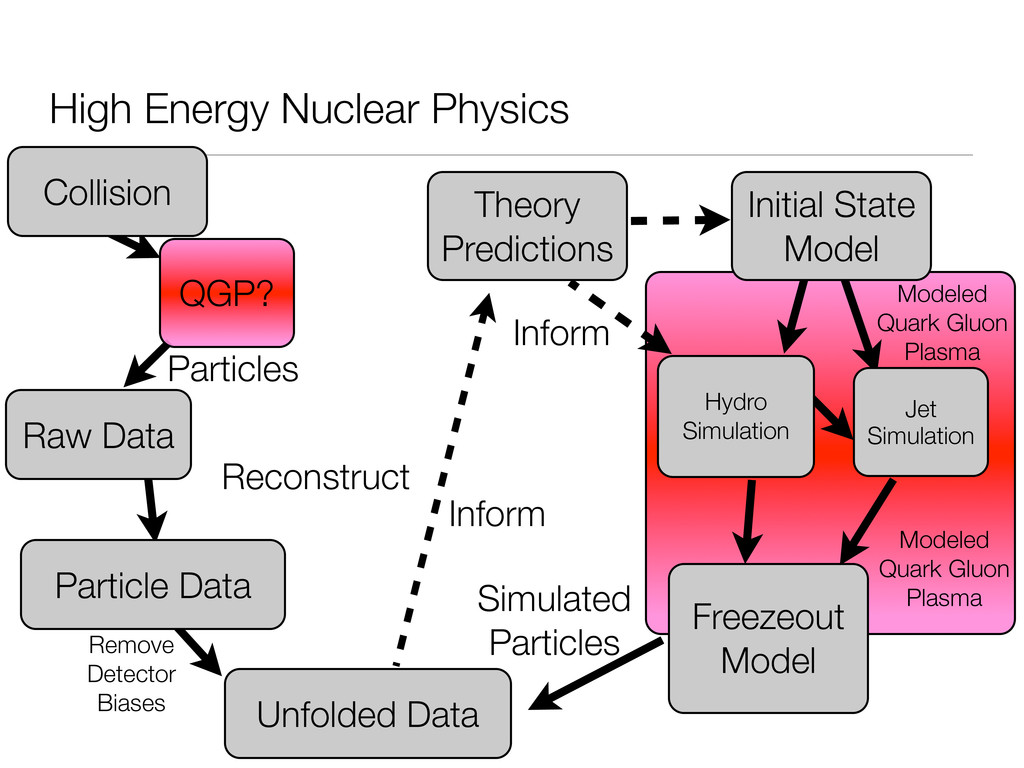
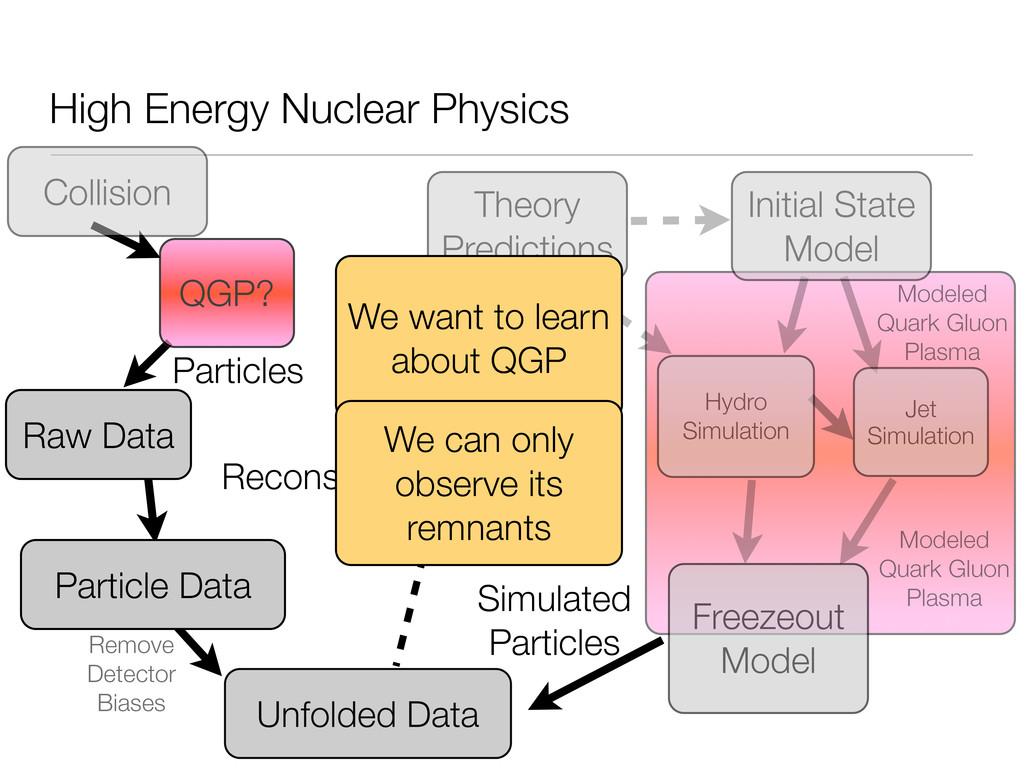
Detector Biases Particle Data Reconstruct Theory Predictions Inform Modeled Quark Gluon Plasma Freezeout Model Simulated Particles Inform Jet Simulation Initial State Model Hydro Simulation QGP? Collision Modeled Quark Gluon Plasma We want to learn about QGP We can only observe its remnants
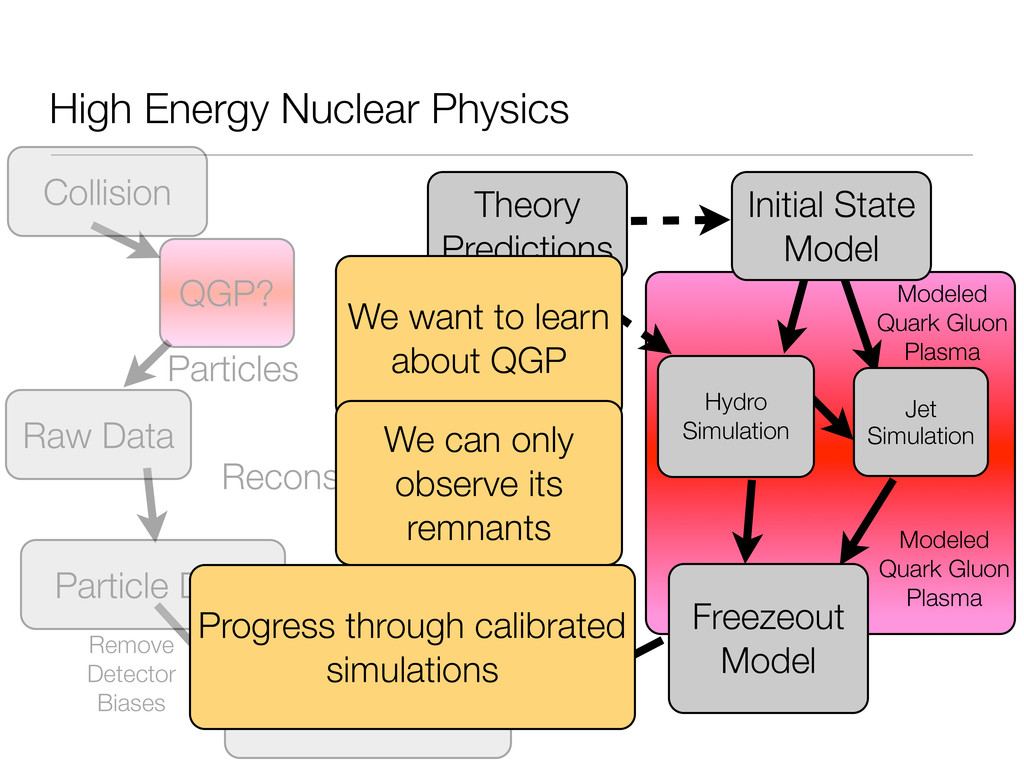
Detector Biases Particle Data Reconstruct Theory Predictions Inform Modeled Quark Gluon Plasma Freezeout Model Simulated Particles Inform Jet Simulation Initial State Model Hydro Simulation QGP? Collision Modeled Quark Gluon Plasma We want to learn about QGP We can only observe its remnants Progress through calibrated simulations
Vn distributions, measured on a per event basis, used to be averaged over many collisions) • Data available for many centrality classes. Try to model the centrality dependence along with the rest of the physics. • VISHNew fluid dynamics + particle transport state of the art model. End to end simulation, collision -> hydro -> final state particle production • A large set of calibration parameters, including fundamental properties of the QGP: shear-viscosity to entropy ratio. • Use this new data set to calibrate the model and infer distributions on the shear-viscosity to entropy ratio. Never been rigorously done before • Model-Data based Inference is the only way we can learn about this.
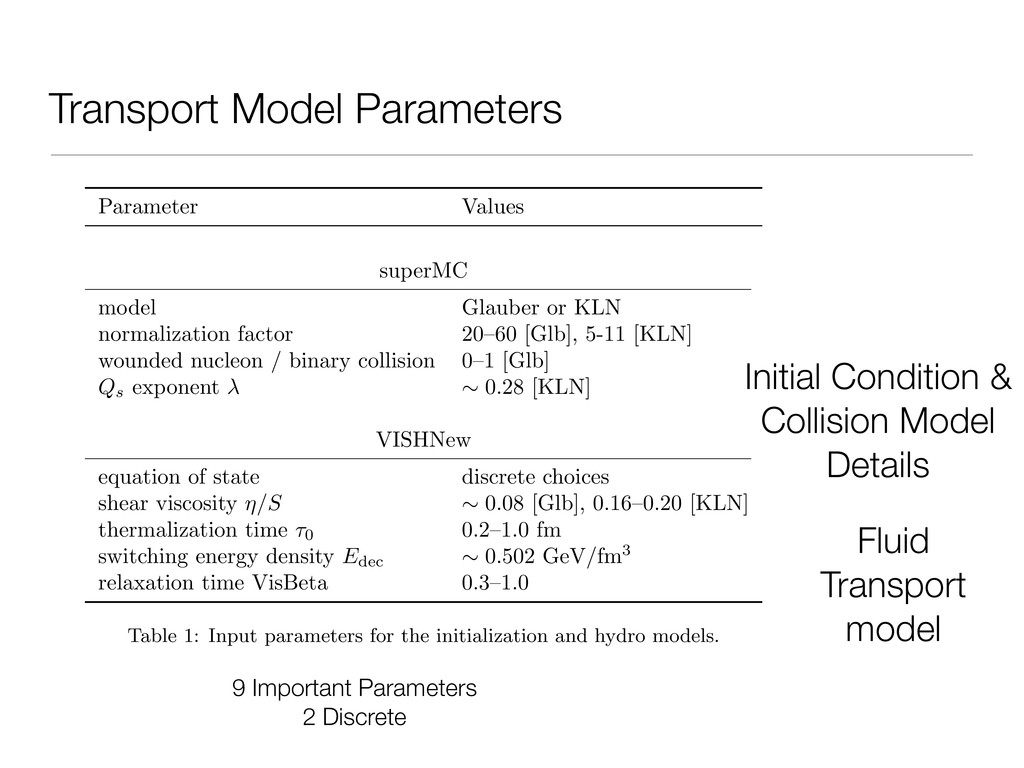
Transport model 9 Important Parameters 2 Discrete 6.1 Input parameters A number input parameters must be set for the various event-by-event com- ponents. Ideally, all of them would be varied in order to determine the best possible fit. In practice, this will be limited or the parameter space will become impossibly large, even with an emulator. Therefore we must choose judiciously. Table 1 presents the most interesting input parameters. Since the choice of Parameter Values superMC model Glauber or KLN normalization factor 20–60 [Glb], 5-11 [KLN] wounded nucleon / binary collision 0–1 [Glb] Qs exponent ⇠ 0.28 [KLN] VISHNew equation of state discrete choices shear viscosity ⌘/S ⇠ 0.08 [Glb], 0.16–0.20 [KLN] thermalization time ⌧0 0.2–1.0 fm switching energy density Edec ⇠ 0.502 GeV/fm3 relaxation time VisBeta 0.3–1.0 Table 1: Input parameters for the initialization and hydro models. initialization model is discrete, each is e↵ectively a separate experiment. There are several parameters related to centrality—number of participants Npart , impart parameter b, and total initial entropy dS/dy—which must be
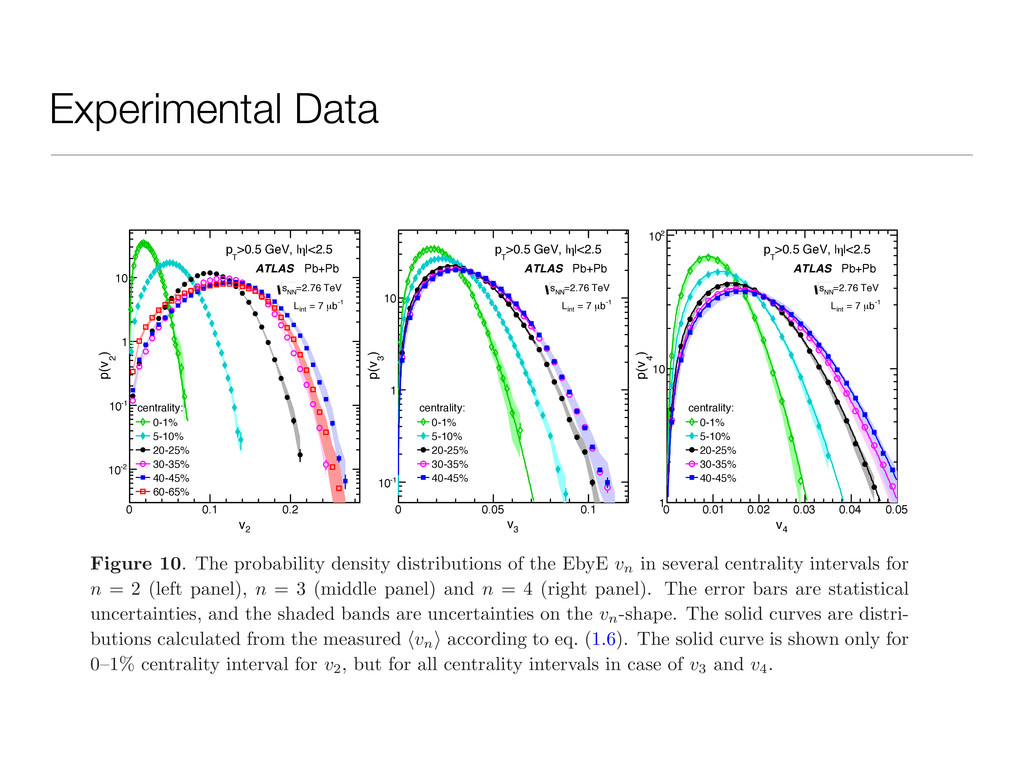
-2 10 -1 10 1 10 |<2.5 η >0.5 GeV, | T p centrality: 0-1% 5-10% 20-25% 30-35% 40-45% 60-65% ATLAS Pb+Pb =2.76 TeV NN s -1 b µ = 7 int L 3 v 0 0.05 0.1 ) 3 p(v -1 10 1 10 |<2.5 η >0.5 GeV, | T p centrality: 0-1% 5-10% 20-25% 30-35% 40-45% ATLAS Pb+Pb =2.76 TeV NN s -1 b µ = 7 int L 4 v 0 0.01 0.02 0.03 0.04 0.05 ) 4 p(v 1 10 2 10 |<2.5 η >0.5 GeV, | T p centrality: 0-1% 5-10% 20-25% 30-35% 40-45% ATLAS Pb+Pb =2.76 TeV NN s -1 b µ = 7 int L Figure 10. The probability density distributions of the EbyE vn in several centrality intervals for n = 2 (left panel), n = 3 (middle panel) and n = 4 (right panel). The error bars are statistical uncertainties, and the shaded bands are uncertainties on the vn -shape. The solid curves are distri- butions calculated from the measured vn according to eq. (1.6). The solid curve is shown only for 0–1% centrality interval for v2 , but for all centrality intervals in case of v3 and v4 . 10 centrality: 20-25% 10 ATLAS Pb+Pb =2.76 TeV NN s -1 b µ = 7 int L centrality: 20-25% centrality: 20-25%
with experimental data to infer properties of the QGP • Proposed experiment with VISHNew and Vn distributions to infer shear- viscosity/entropy ratio. • Grid computing framework is up and running • Have to finalize an experimental design: • How likely are interactions? • How expensive are runs? • How many model runs do we need to get a good-enough Vn distribution • Look for results soon!
![High Energy Nuclear Physics & Computer Experiments C.Coleman-Smith [email protected] May](https://files.speakerdeck.com/presentations/37273b80a17601304c7e227bb3c2be12/slide_0.jpg)