Presentation given at the ALM Workshop in San Francisco, October 10-12, 2013
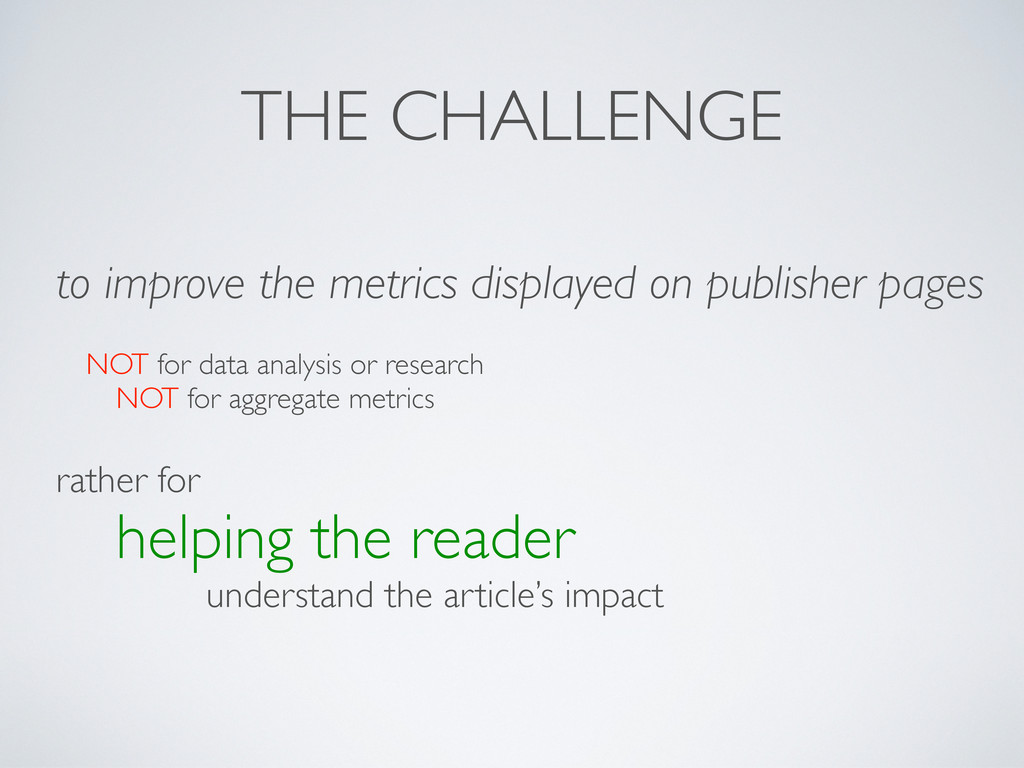
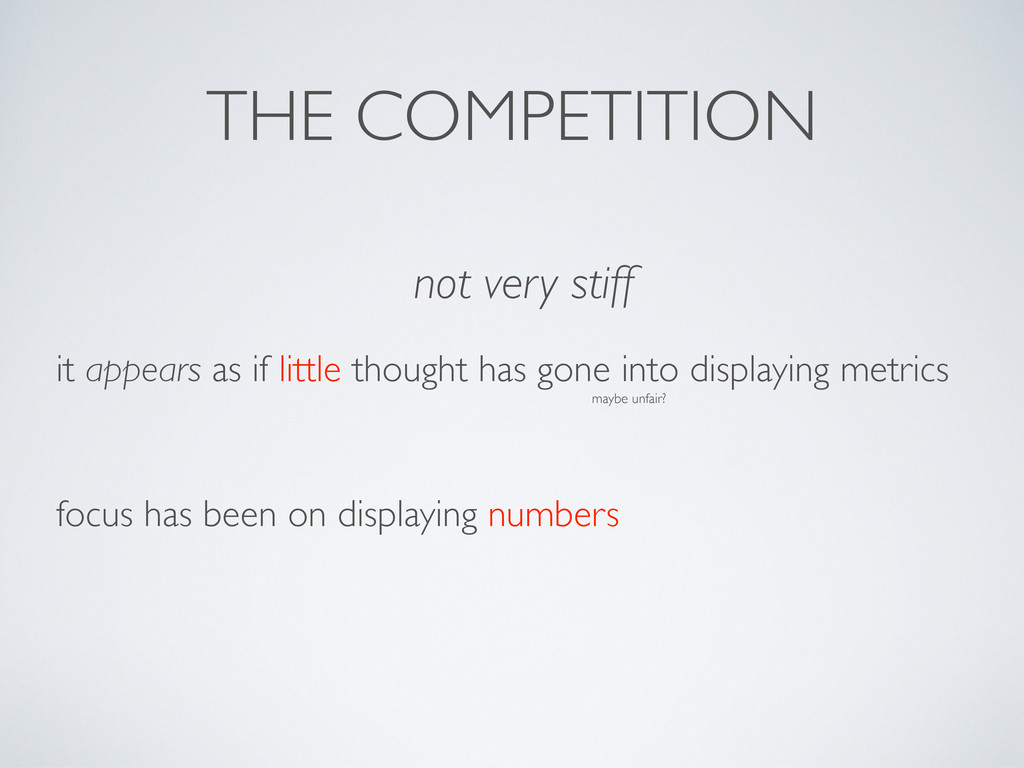
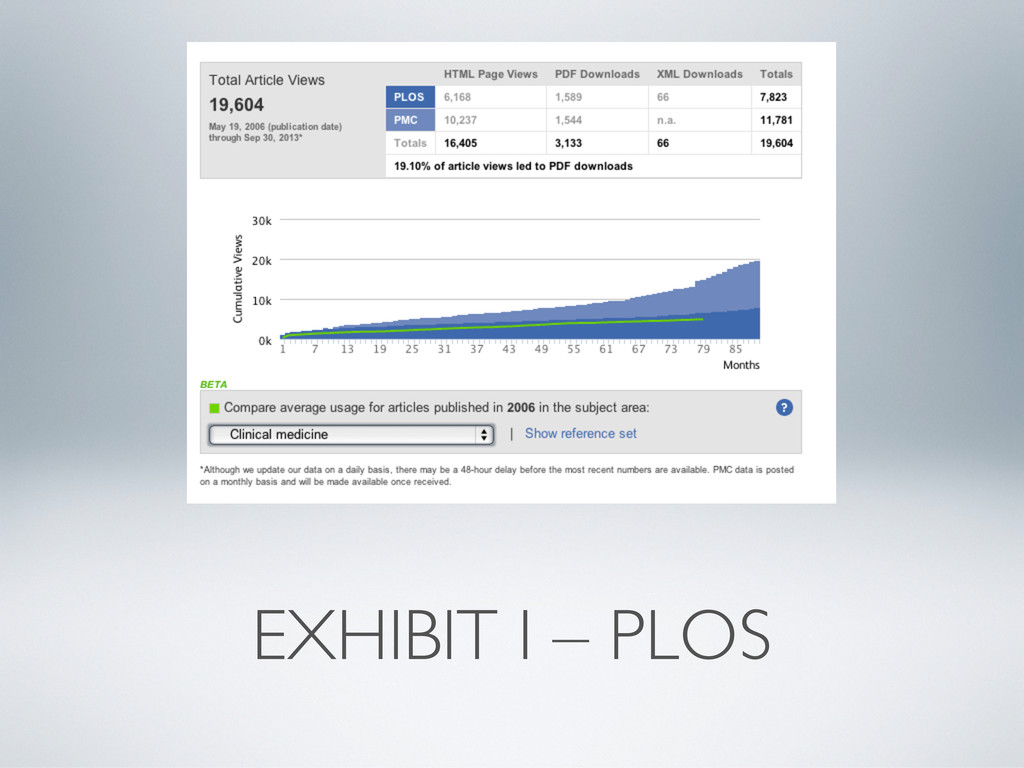
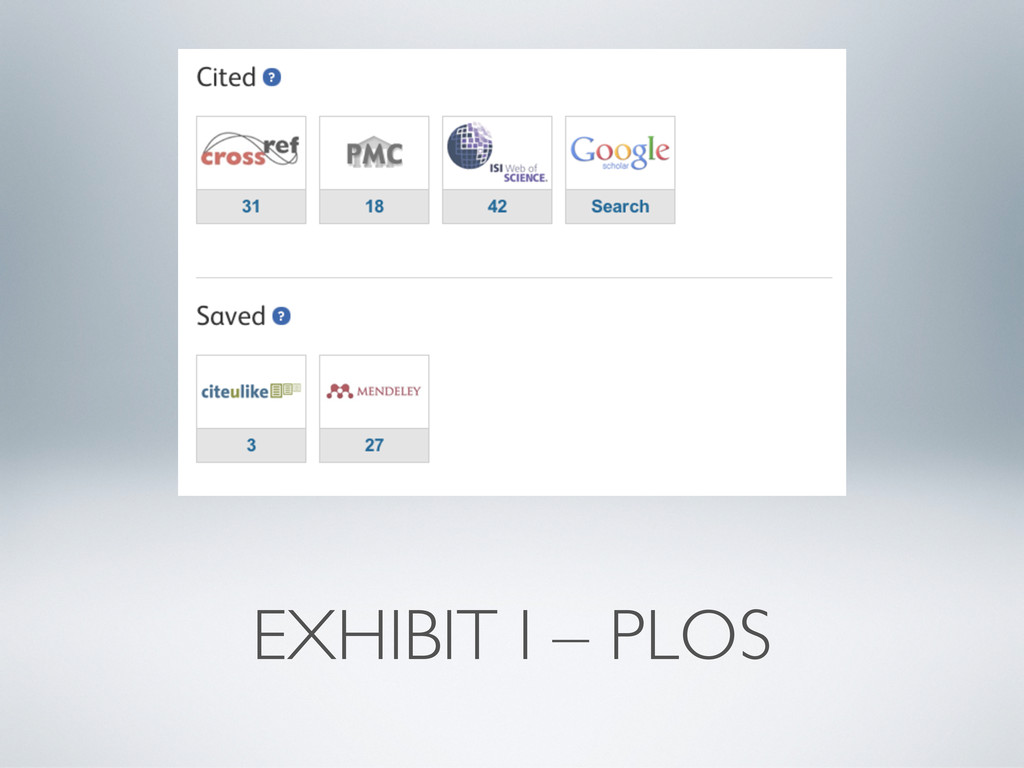
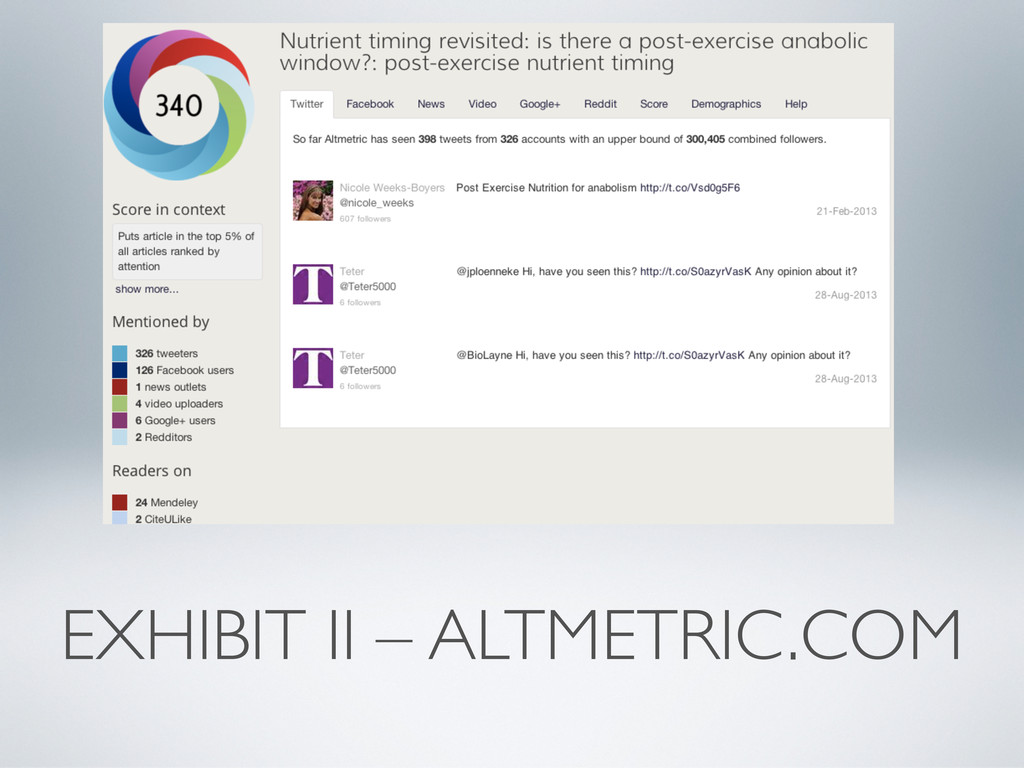
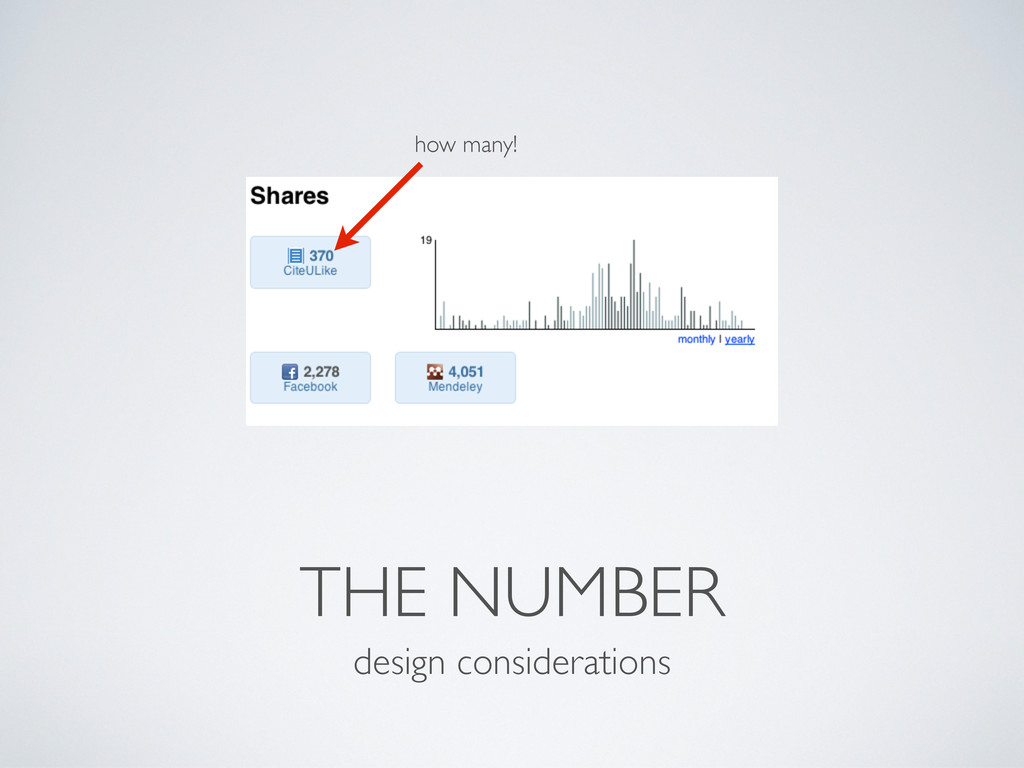
When scouring the literature for hidden gems, readers must be able to quickly dissern the value of a research product. Skilled readers rely on a series of cues from the product page in order to pass judgement, even before engaging with the text at hand. In more recent years, with the advent of Article Level Metrics (ALMs), readers started ahving a new set of value signals at their disposal. ALMs provide metrics of peer use, ranging from downloads to citations to social media. Yet, while ALMs and altmetrics have been growing in popularity, there has been little attention on how these metrics should be displayed as to maximize their utility for readers.
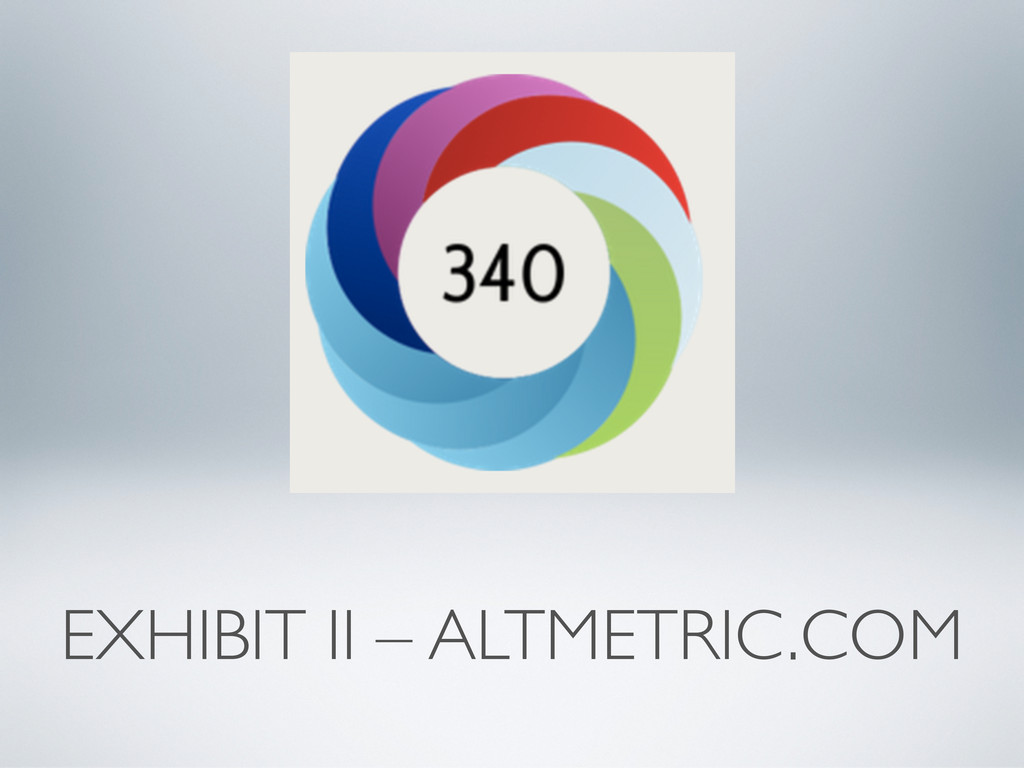
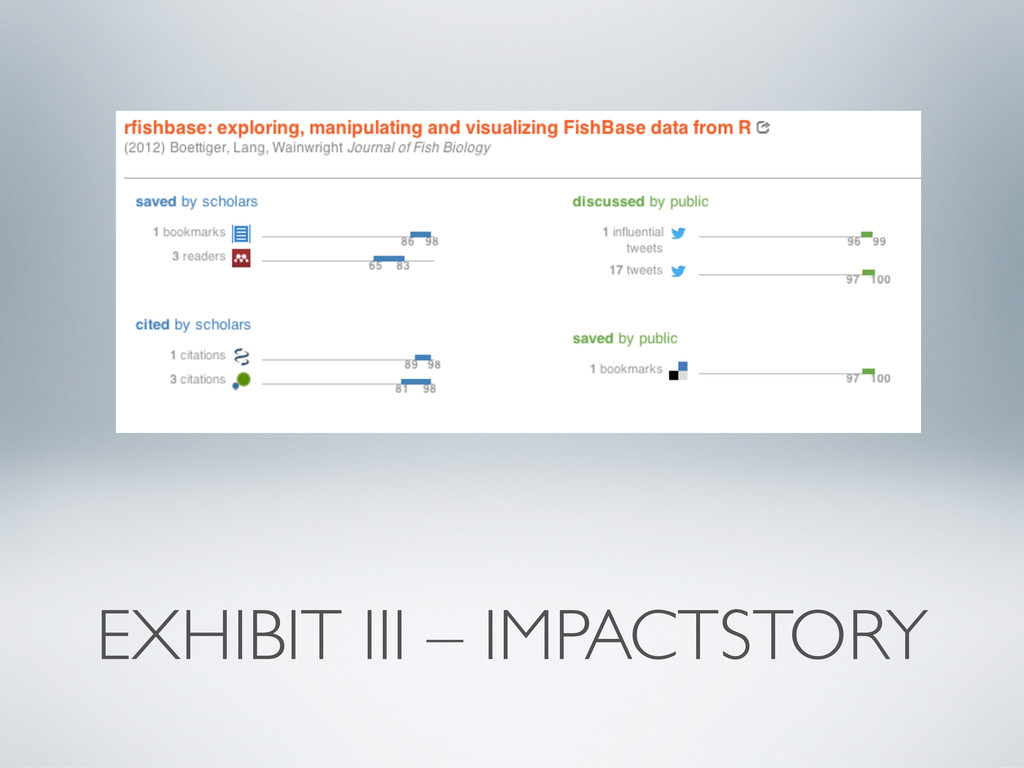
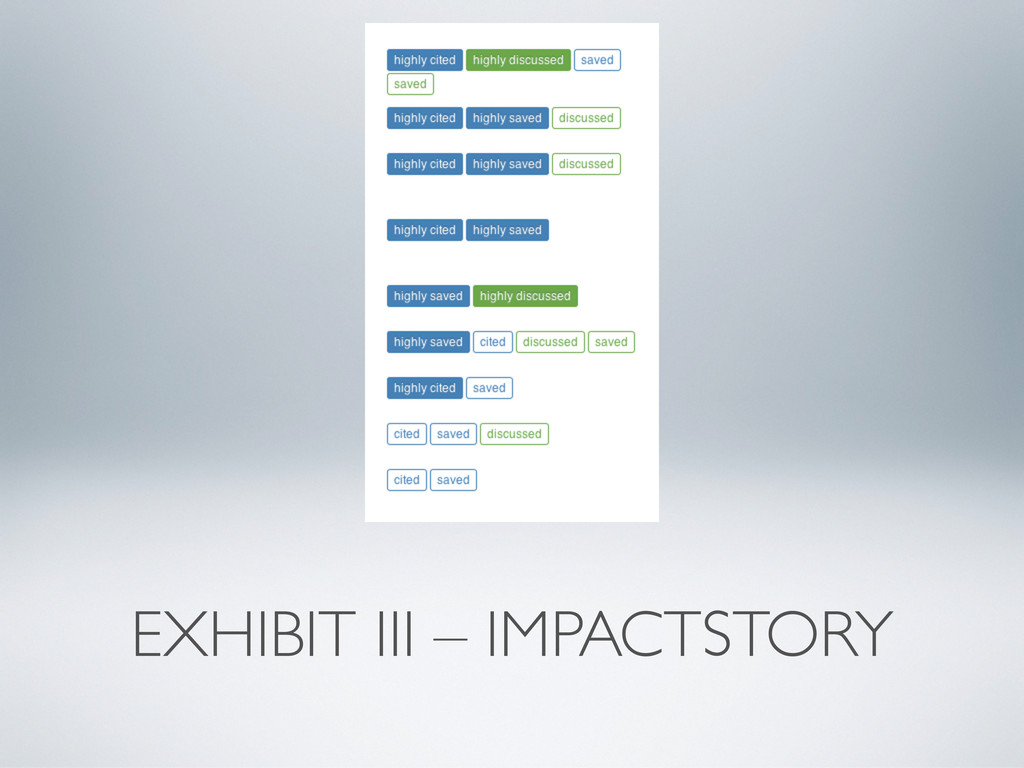
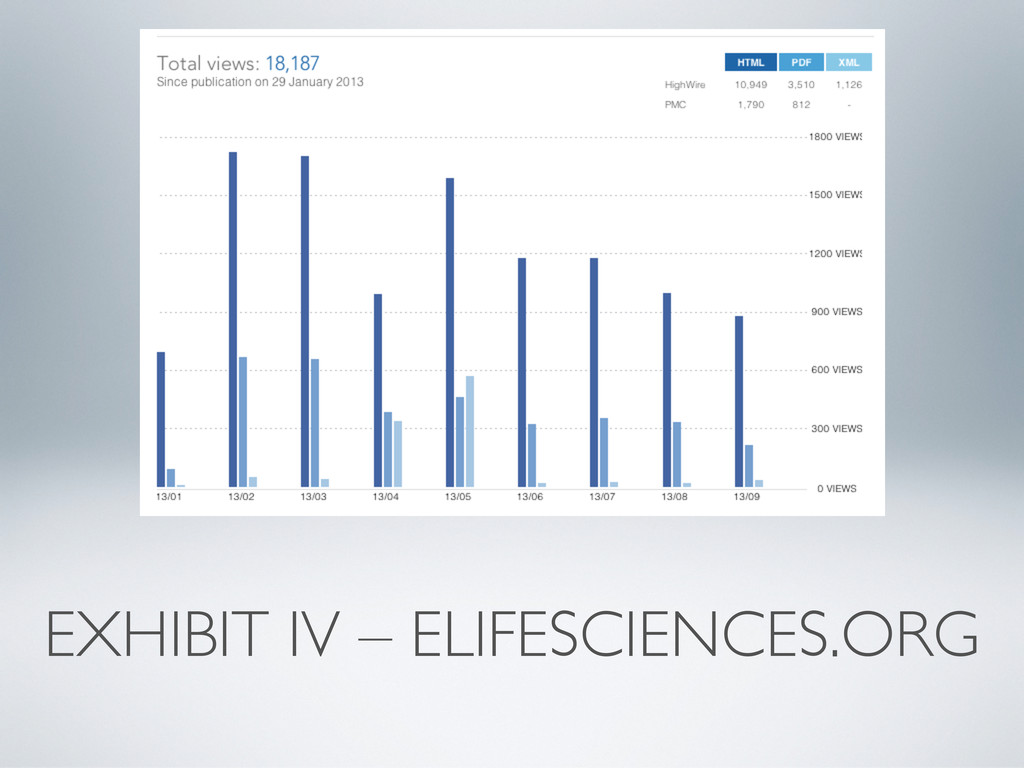
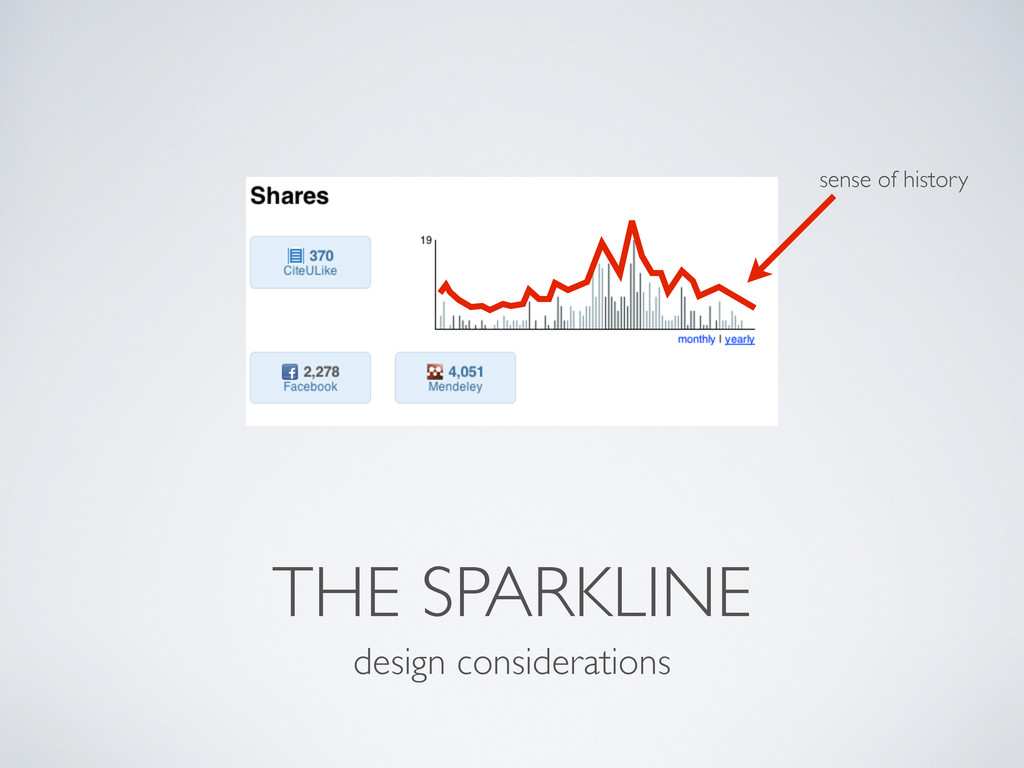
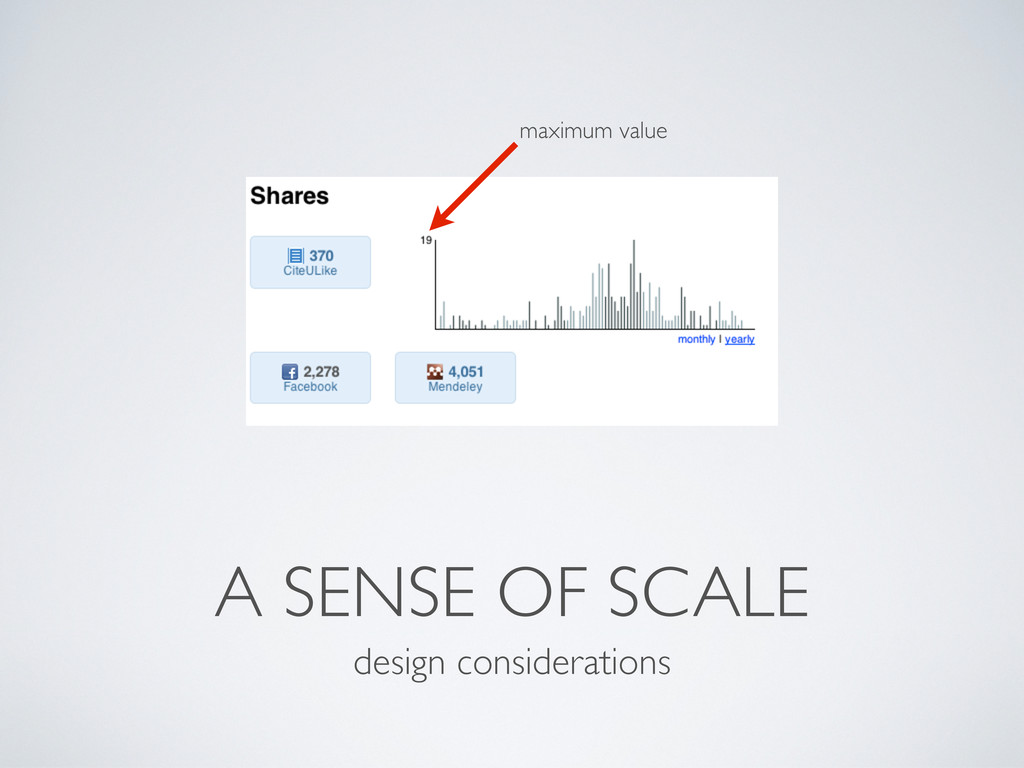
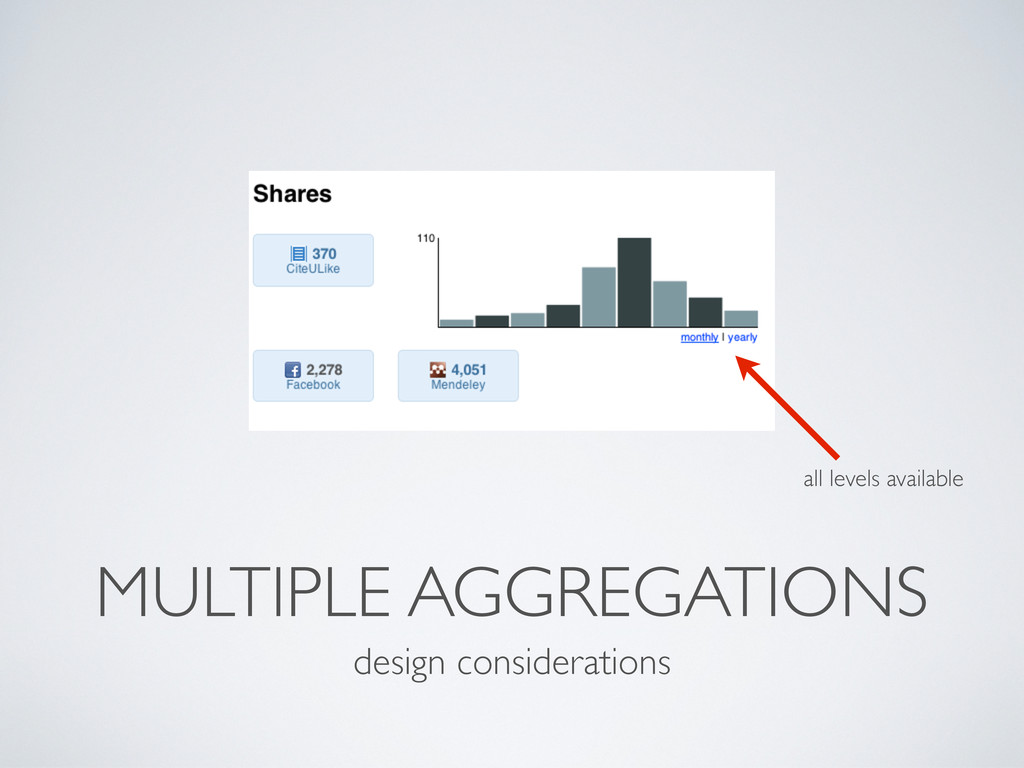
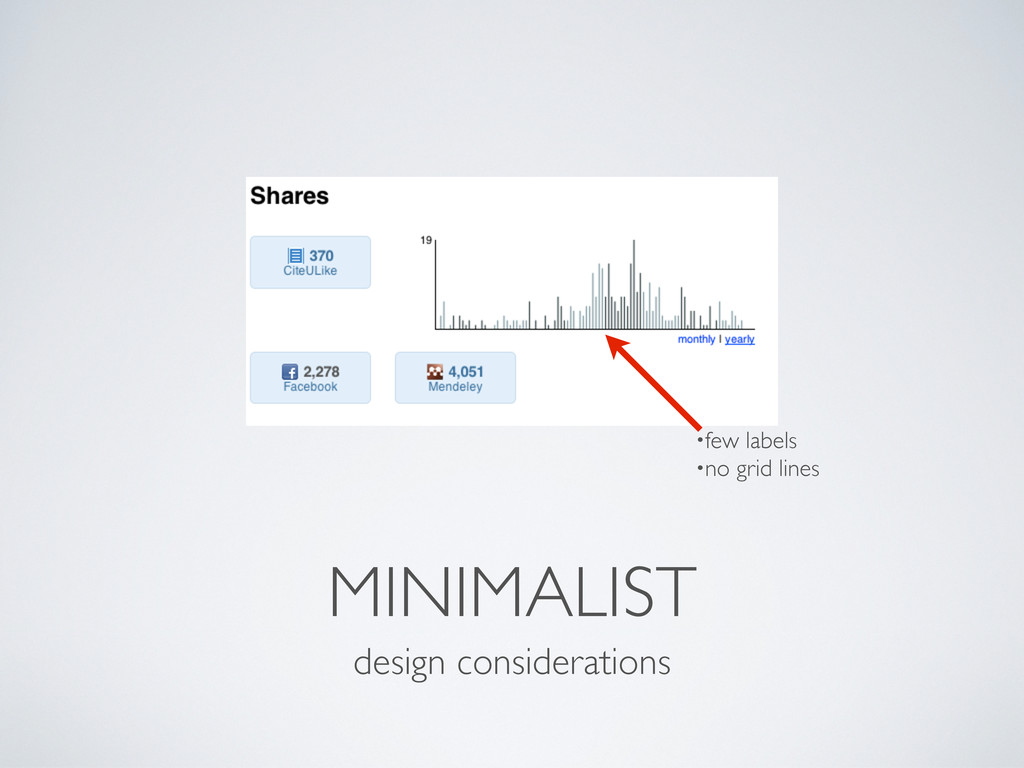
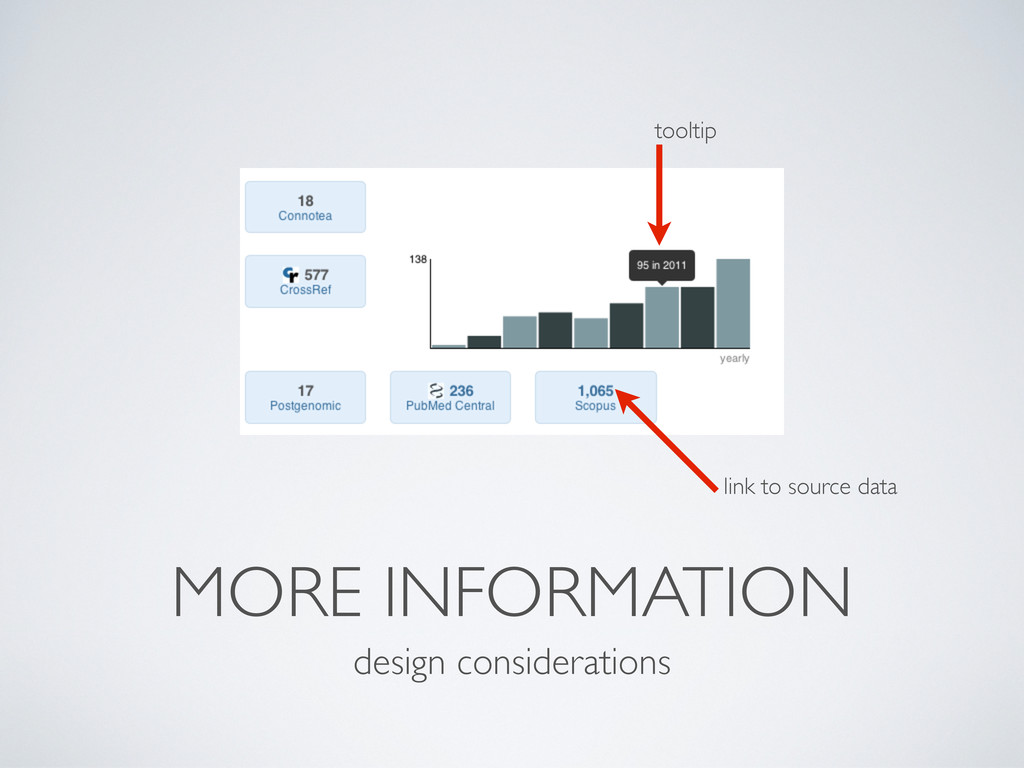
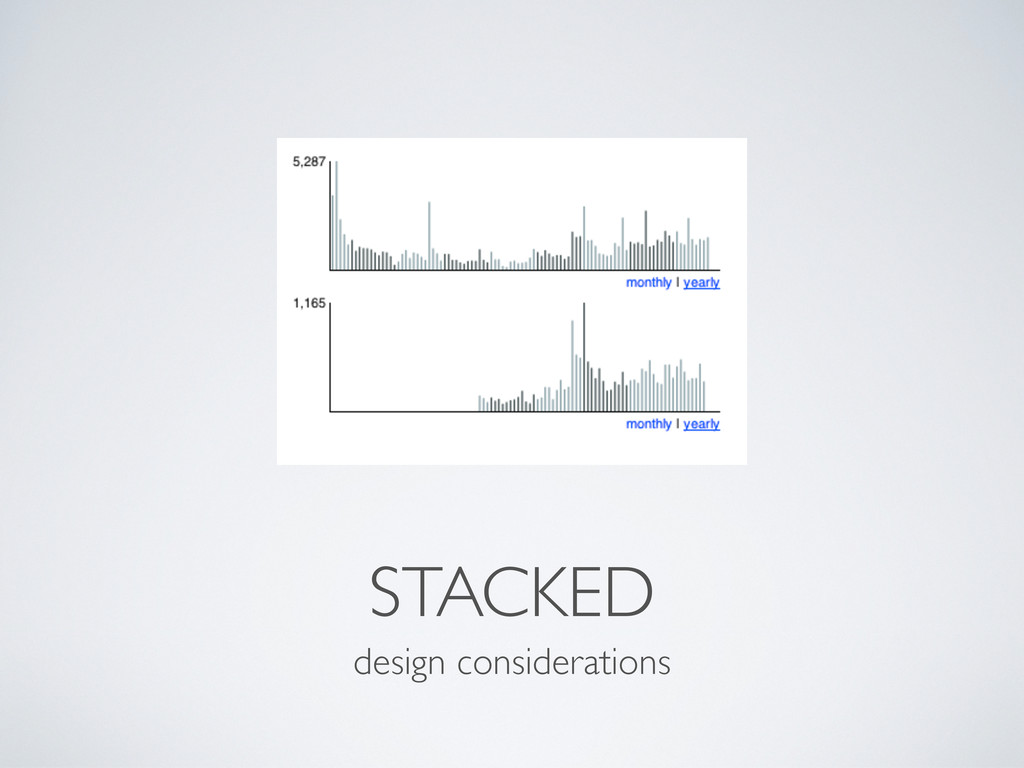
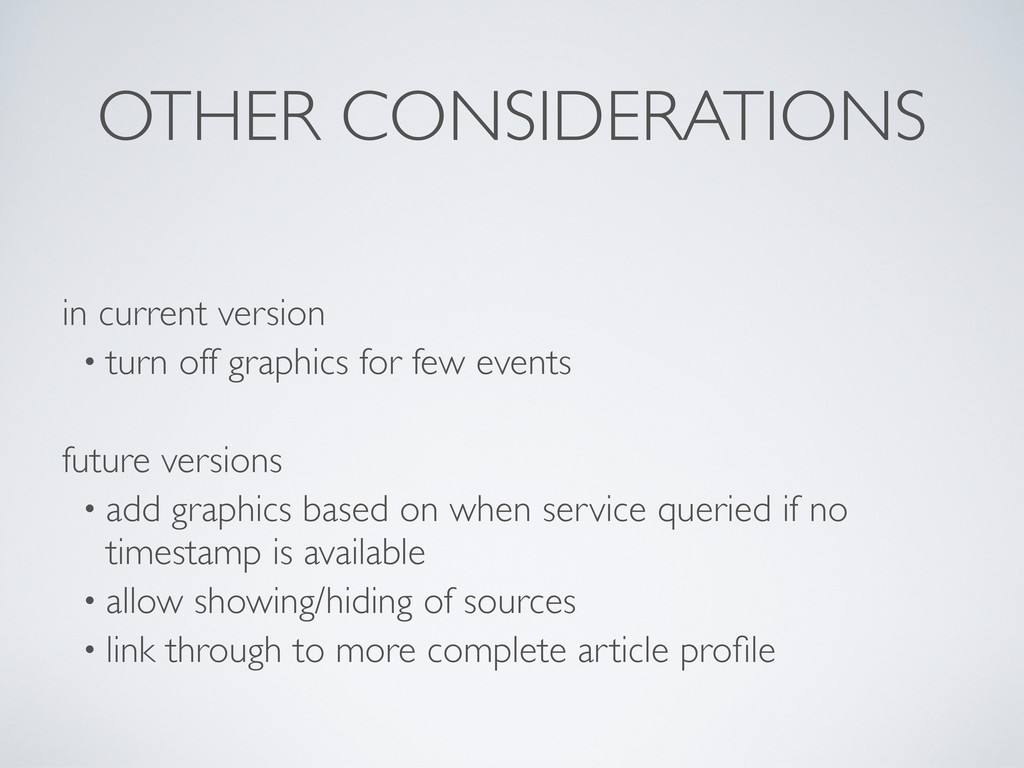
Inspired by the "sparkline" notion that data should be displayed in a way that is succinct and design-simple, the "almviz" group at the altmetrics hackaton (2012) set out some guiding principles for visualizing ALMs so that they would be most helpful to readers. These principles were used for an implementation using data from PLOS' Article Level Metrics application and the javascript visualization library d3.js. The implementation deemphasizes absolute numbers in favour of helping readers identify variation over time, under the belief that raw counts are less meaningful to a reader than information on its pattern of use. This presentation will showcase the simple, yet carefully designed visualization, along with the justifications for the design decisions.
As readers are exposed to a consistent visualization accross journals using the Public Knowledge Project's "Open Journal Systems", it is expected that they will quickly learn to glean peer's usage across various dimensions with ease. The search for those prized research gems has just been made a little easier.