Upgrade to Pro — share decks privately, control downloads, hide ads and more …

Machine Learning with Go

Machine Learning with Go

Machine Learning is often viewed as something akin to magic, only within the grasp of big companies like Facebook and Google who build machine learning models in Python using established frameworks like Scikit-learn or TensorFlow. So why on earth would you do this in Go? In this talk, James will try to dispel some of the myths and, with just a pinch of maths, build a basic ML model from scratch in Go.

Avatar for James Bowman

James Bowman

April 28, 2020

Other Decks in Programming

Transcript

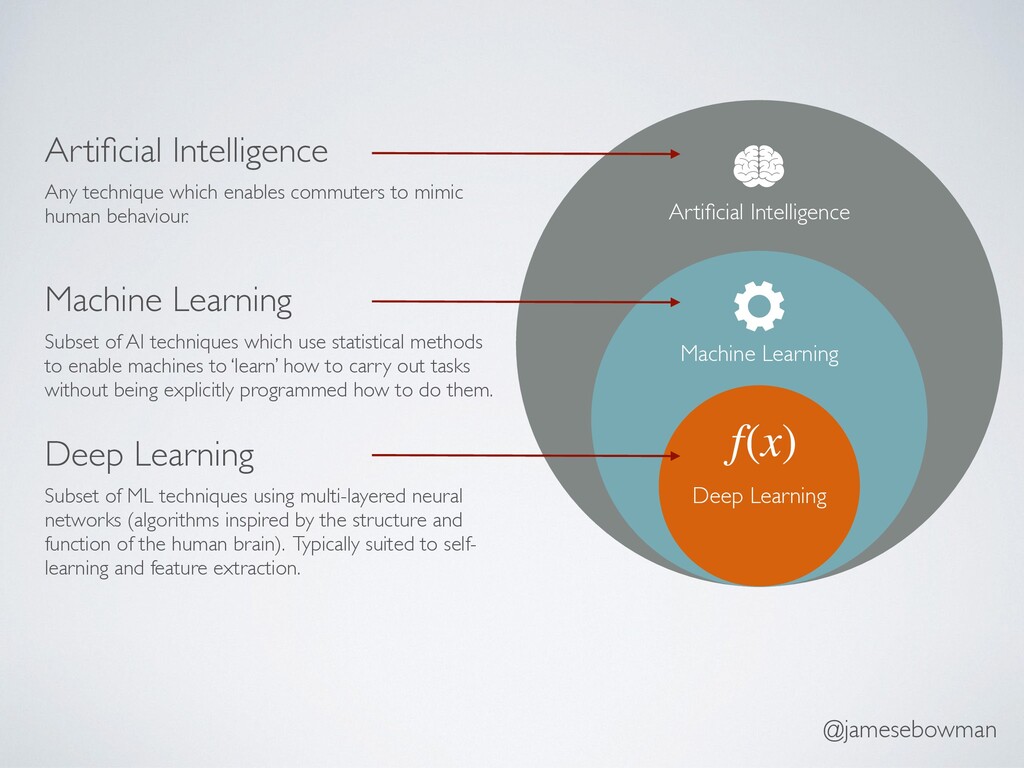
  1. Artificial Intelligence Any technique which enables commuters to mimic human

    behaviour. Machine Learning Subset of AI techniques which use statistical methods to enable machines to ‘learn’ how to carry out tasks without being explicitly programmed how to do them. Deep Learning Subset of ML techniques using multi-layered neural networks (algorithms inspired by the structure and function of the human brain). Typically suited to self- learning and feature extraction. Artificial Intelligence Machine Learning f(x) Deep Learning @jamesebowman
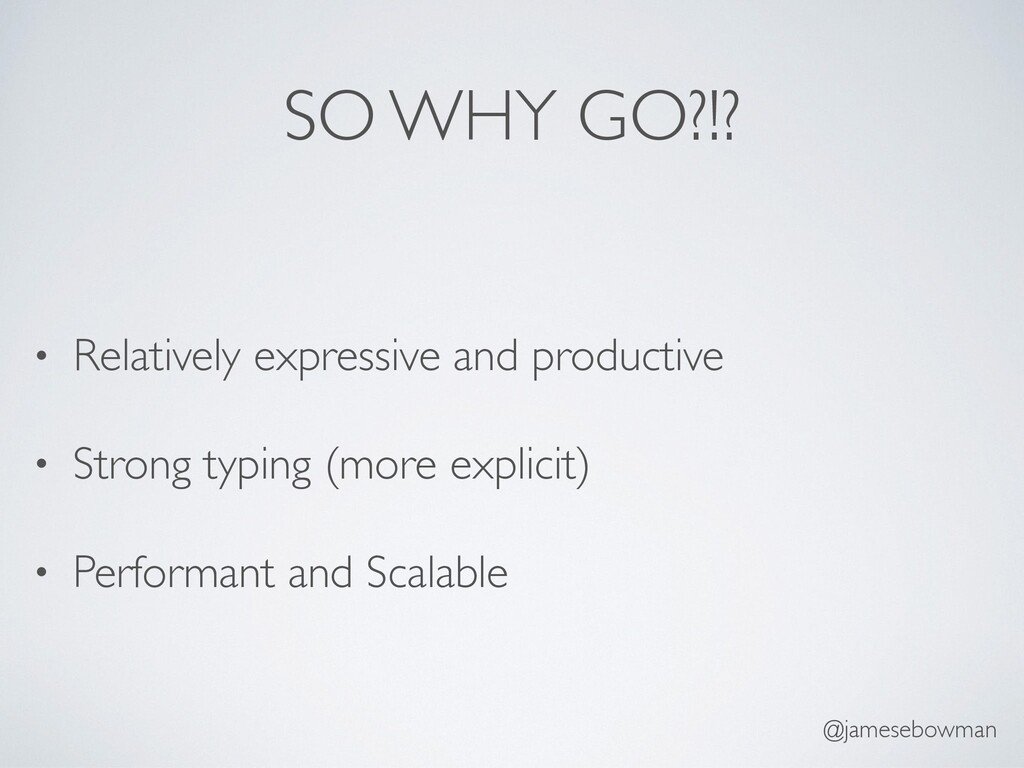
  2. @jamesebowman SO WHY GO?!? • Relatively expressive and productive •

    Strong typing (more explicit) • Performant and Scalable
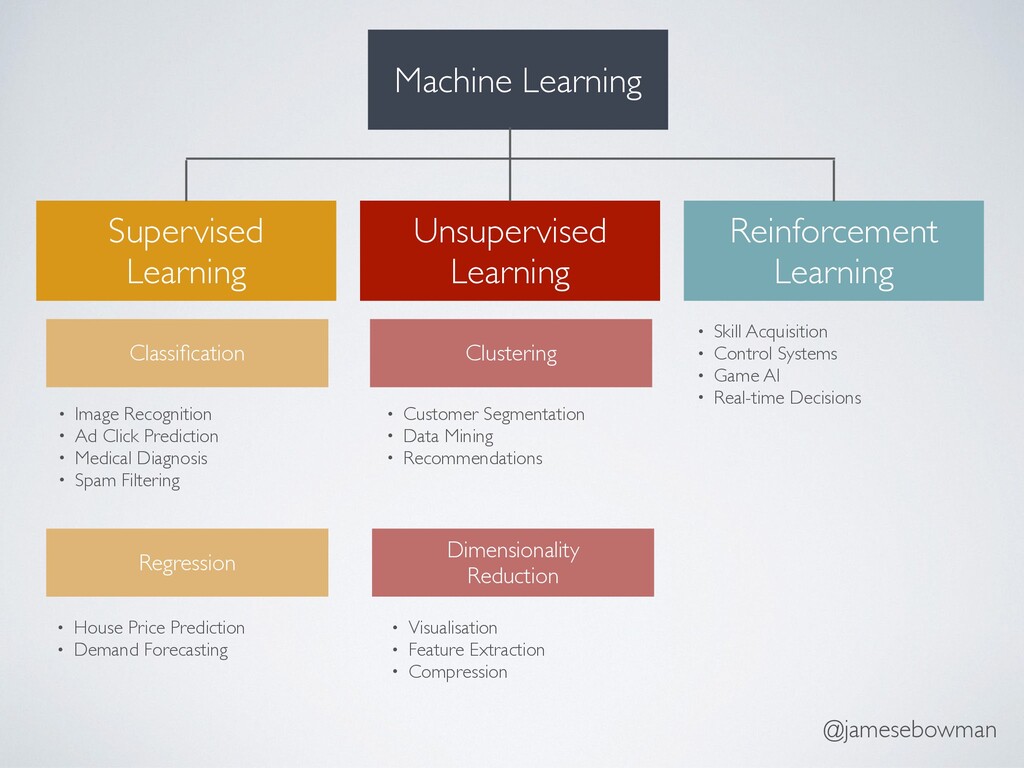
  3. @jamesebowman Supervised Learning Unsupervised Learning Reinforcement Learning Classification Regression Clustering

    Dimensionality Reduction • House Price Prediction • Demand Forecasting • Image Recognition • Ad Click Prediction • Medical Diagnosis • Spam Filtering • Customer Segmentation • Data Mining • Recommendations • Visualisation • Feature Extraction • Compression • Skill Acquisition • Control Systems • Game AI • Real-time Decisions Machine Learning
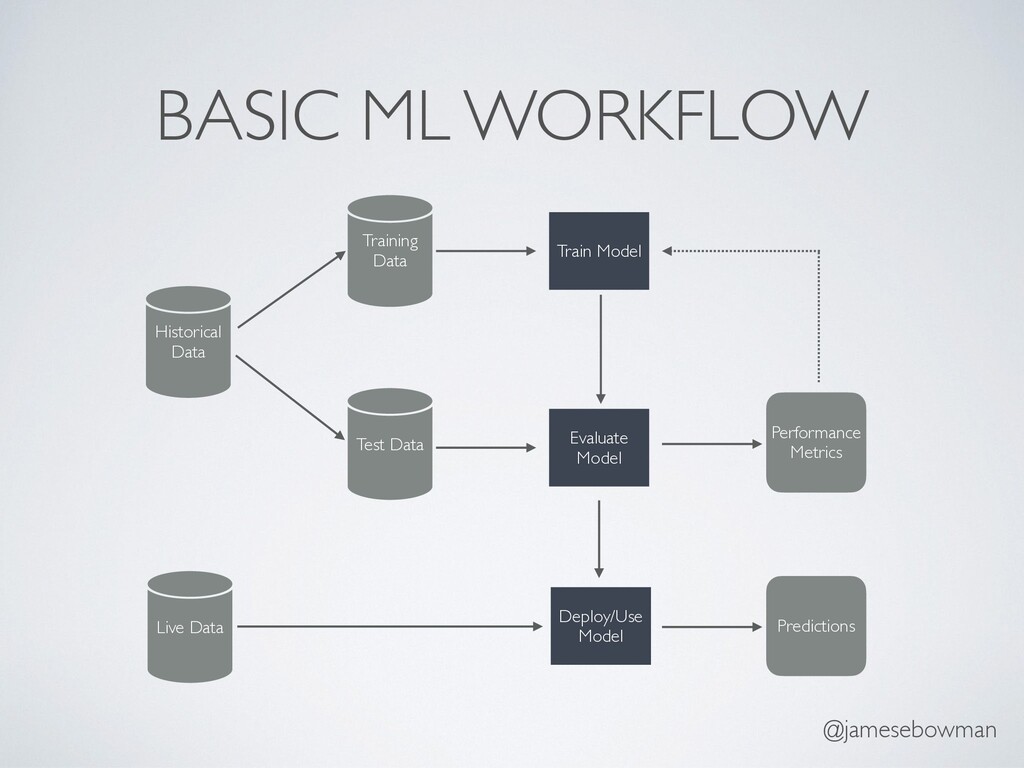
  4. @jamesebowman BASIC ML WORKFLOW Train Model Historical Data Live Data

    Training Data Test Data Evaluate Model Deploy/Use Model Performance Metrics Predictions
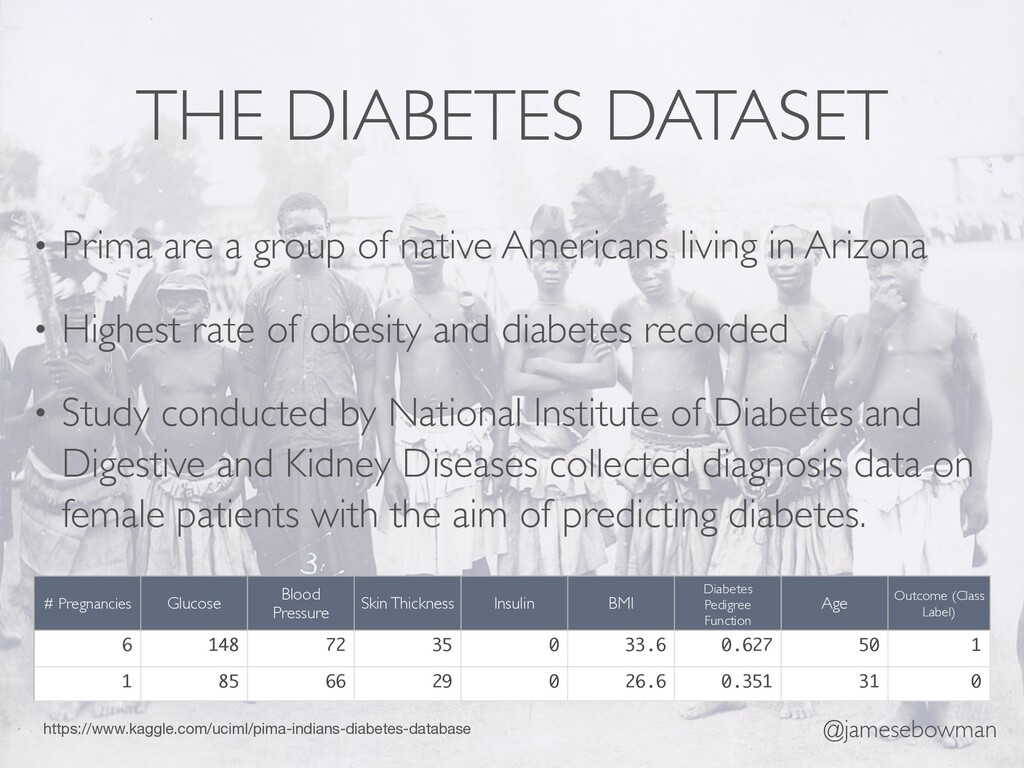
  5. @jamesebowman THE DIABETES DATASET • Prima are a group of

    native Americans living in Arizona • Highest rate of obesity and diabetes recorded • Study conducted by National Institute of Diabetes and Digestive and Kidney Diseases collected diagnosis data on female patients with the aim of predicting diabetes. # Pregnancies Glucose Blood Pressure Skin Thickness Insulin BMI Diabetes Pedigree Function Age Outcome (Class Label) 6 148 72 35 0 33.6 0.627 50 1 1 85 66 29 0 26.6 0.351 31 0 https://www.kaggle.com/uciml/pima-indians-diabetes-database
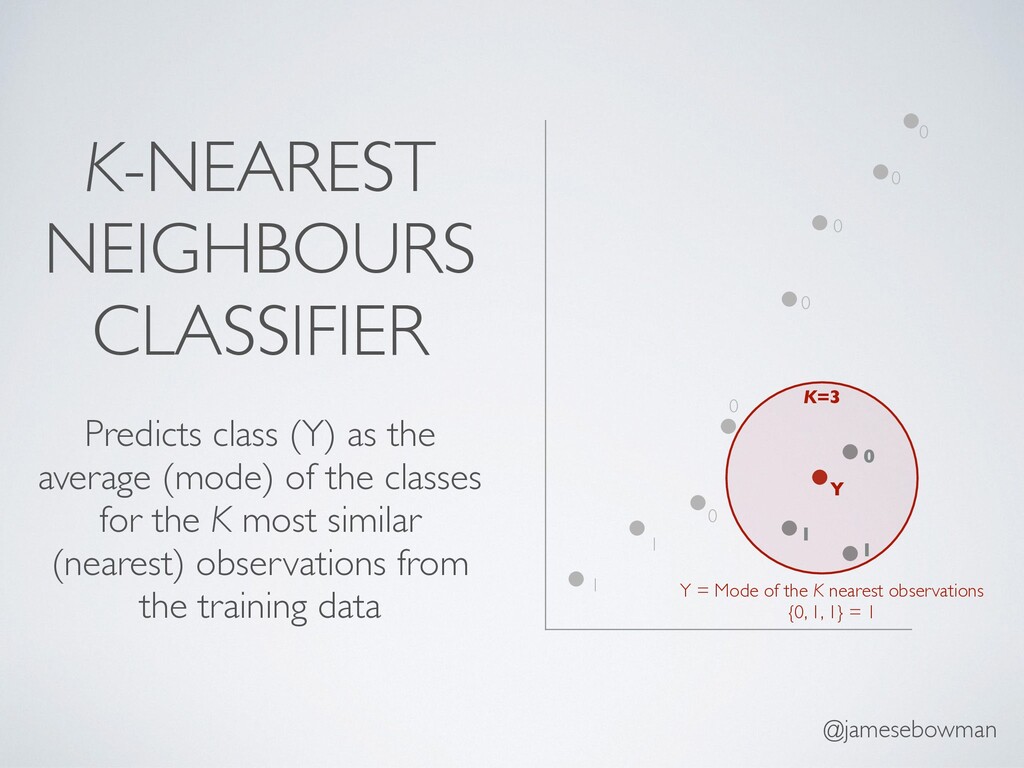
  6. @jamesebowman K-NEAREST NEIGHBOURS CLASSIFIER Predicts class (Y) as the average

    (mode) of the classes for the K most similar (nearest) observations from the training data K=3 0 1 1 Y = Mode of the K nearest observations {0, 1, 1} = 1 0 1 0 0 0 0 0 1 Y
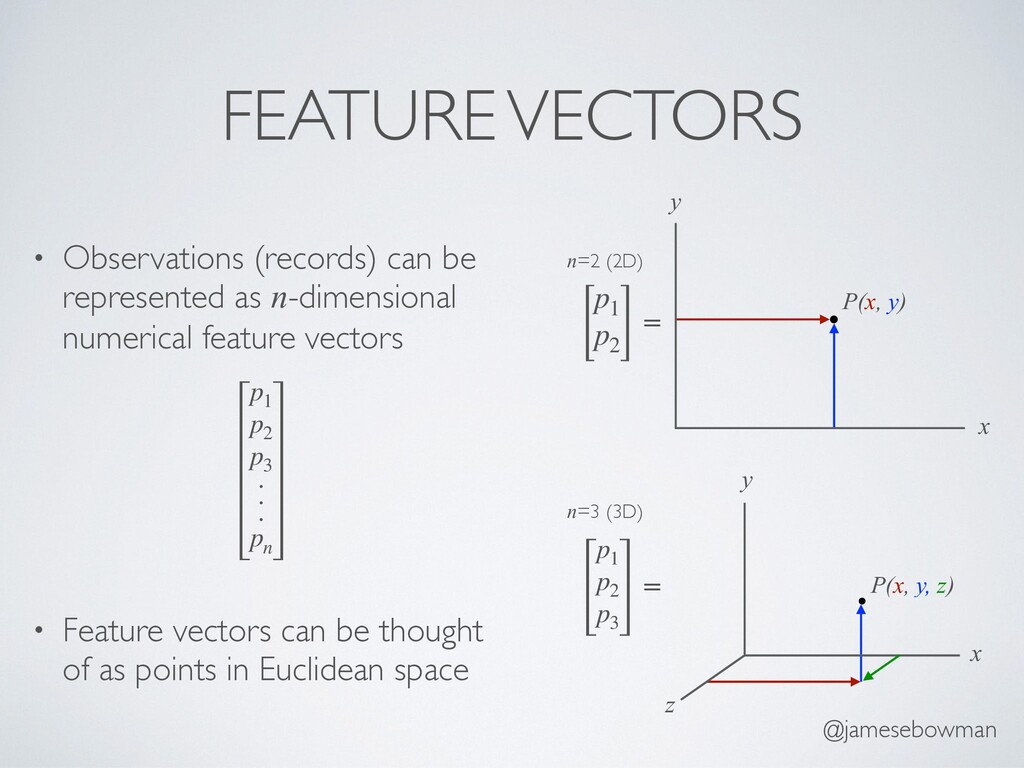
  7. @jamesebowman FEATURE VECTORS • Observations (records) can be represented as

    n-dimensional numerical feature vectors • Feature vectors can be thought of as points in Euclidean space P(x, y) y x P(x, y, z) y x z [ p1 p2 ] p1 p2 p3 p1 p2 p3 . . . pn n=2 (2D) n=3 (3D) = =
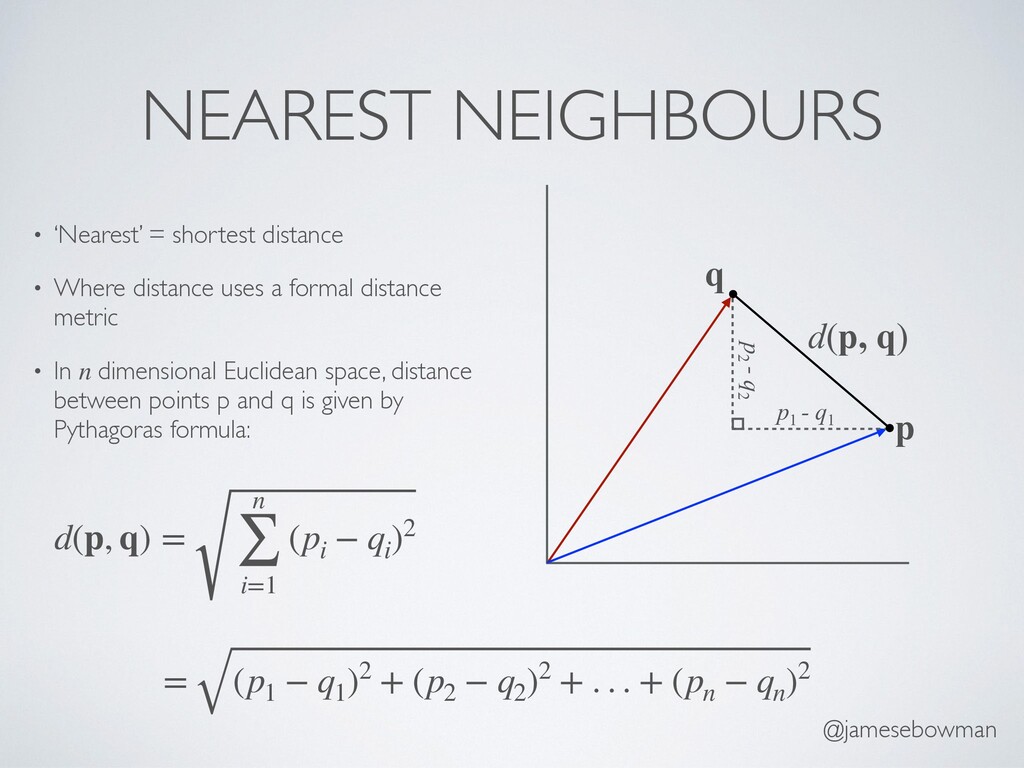
  8. @jamesebowman NEAREST NEIGHBOURS • ‘Nearest’ = shortest distance • Where

    distance uses a formal distance metric • In n dimensional Euclidean space, distance between points p and q is given by Pythagoras formula: d(p, q) = n ∑ i=1 (pi − qi )2 = (p1 − q1 )2 + (p2 − q2 )2 + . . . + (pn − qn )2 p q d(p, q) p1 - q1 p2 - q2
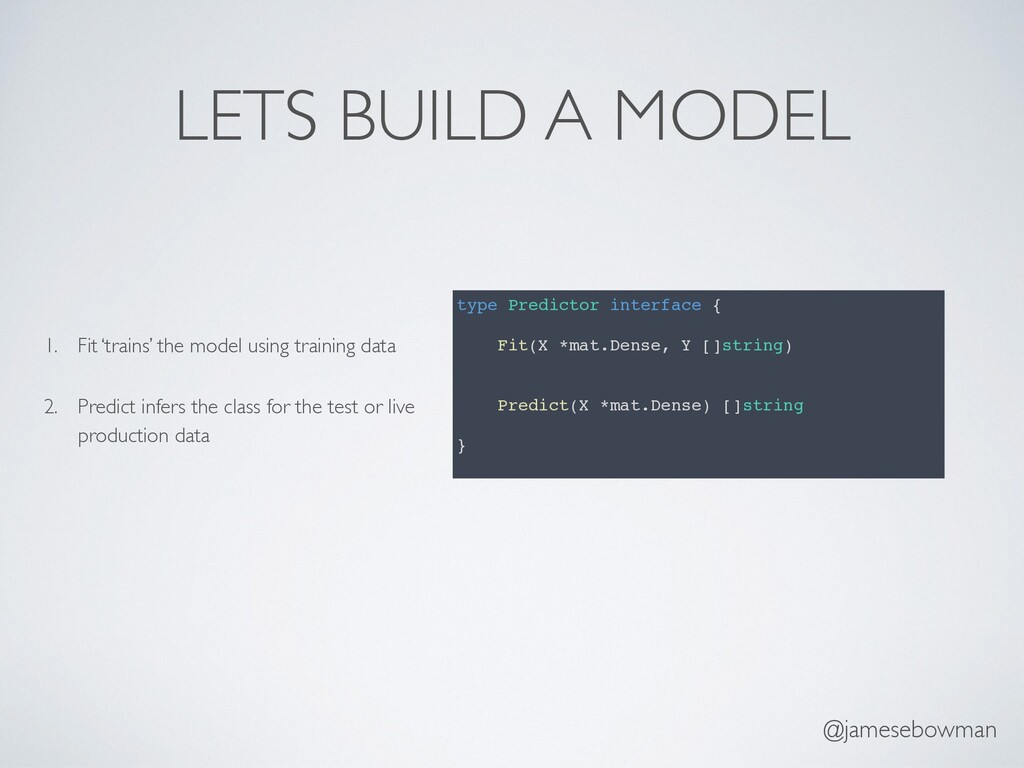
  9. @jamesebowman LETS BUILD A MODEL type Predictor interface { Fit(X

    *mat.Dense, Y []string) Predict(X *mat.Dense) []string } 1. Fit ‘trains’ the model using training data 2. Predict infers the class for the test or live production data
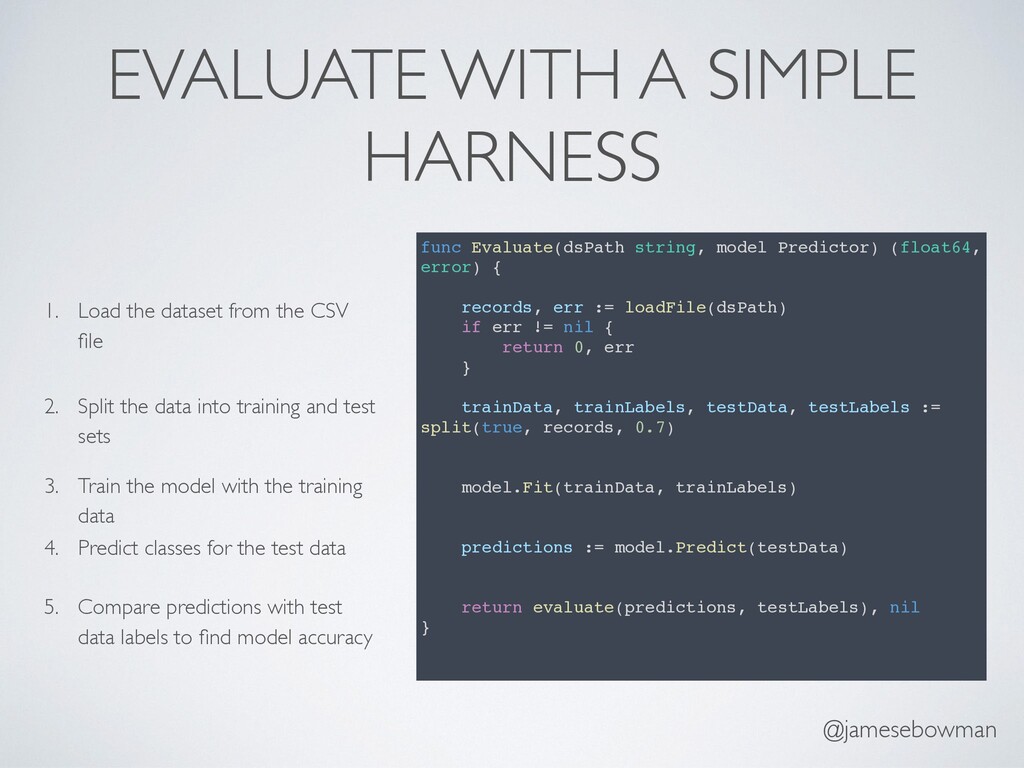
  10. @jamesebowman EVALUATE WITH A SIMPLE HARNESS 1. Load the dataset

    from the CSV file 2. Split the data into training and test sets 3. Train the model with the training data 4. Predict classes for the test data 5. Compare predictions with test data labels to find model accuracy func Evaluate(dsPath string, model Predictor) (float64, error) { records, err := loadFile(dsPath) if err != nil { return 0, err } trainData, trainLabels, testData, testLabels := split(true, records, 0.7) model.Fit(trainData, trainLabels) predictions := model.Predict(testData) return evaluate(predictions, testLabels), nil }
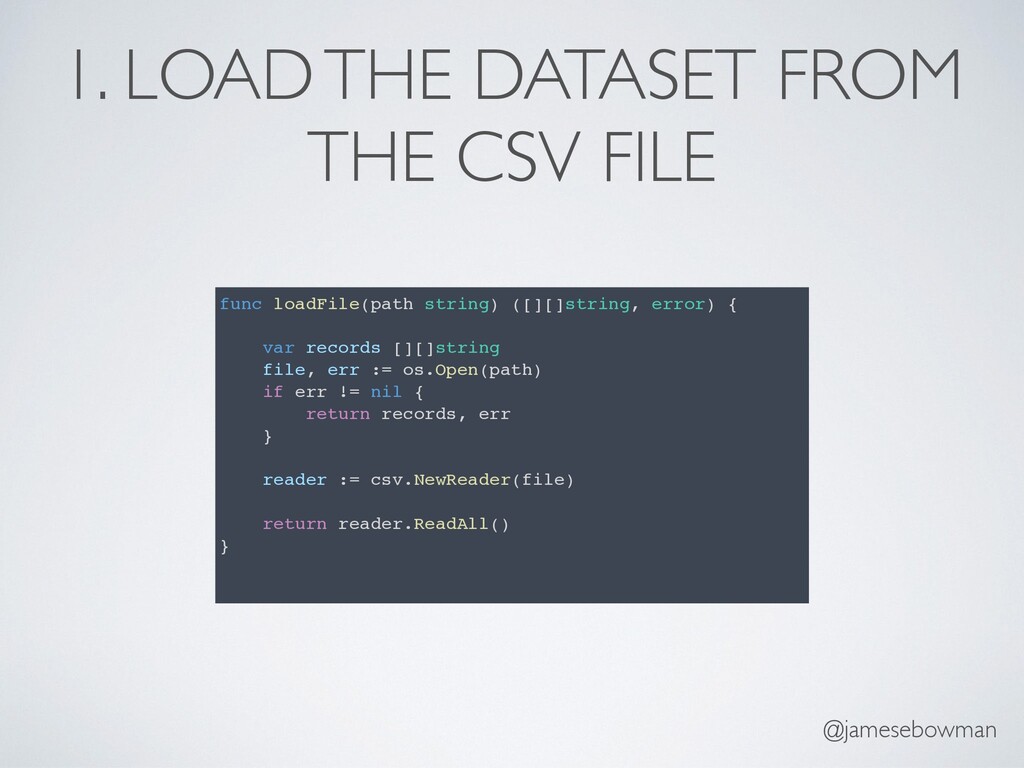
  11. @jamesebowman 1. LOAD THE DATASET FROM THE CSV FILE func

    loadFile(path string) ([][]string, error) { var records [][]string file, err := os.Open(path) if err != nil { return records, err } reader := csv.NewReader(file) return reader.ReadAll() }
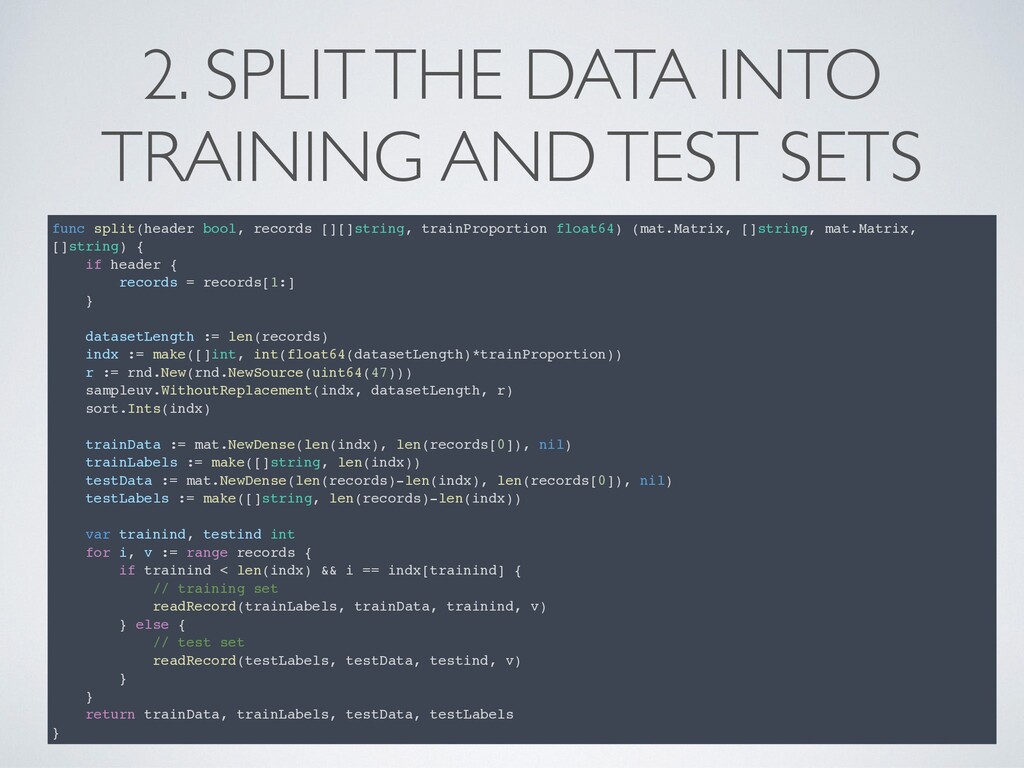
  12. @jamesebowman 2. SPLIT THE DATA INTO TRAINING AND TEST SETS

    func split(header bool, records [][]string, trainProportion float64) (mat.Matrix, []string, mat.Matrix, []string) { if header { records = records[1:] } datasetLength := len(records) indx := make([]int, int(float64(datasetLength)*trainProportion)) r := rnd.New(rnd.NewSource(uint64(47))) sampleuv.WithoutReplacement(indx, datasetLength, r) sort.Ints(indx) trainData := mat.NewDense(len(indx), len(records[0]), nil) trainLabels := make([]string, len(indx)) testData := mat.NewDense(len(records)-len(indx), len(records[0]), nil) testLabels := make([]string, len(records)-len(indx)) var trainind, testind int for i, v := range records { if trainind < len(indx) && i == indx[trainind] { // training set readRecord(trainLabels, trainData, trainind, v) } else { // test set readRecord(testLabels, testData, testind, v) } } return trainData, trainLabels, testData, testLabels }
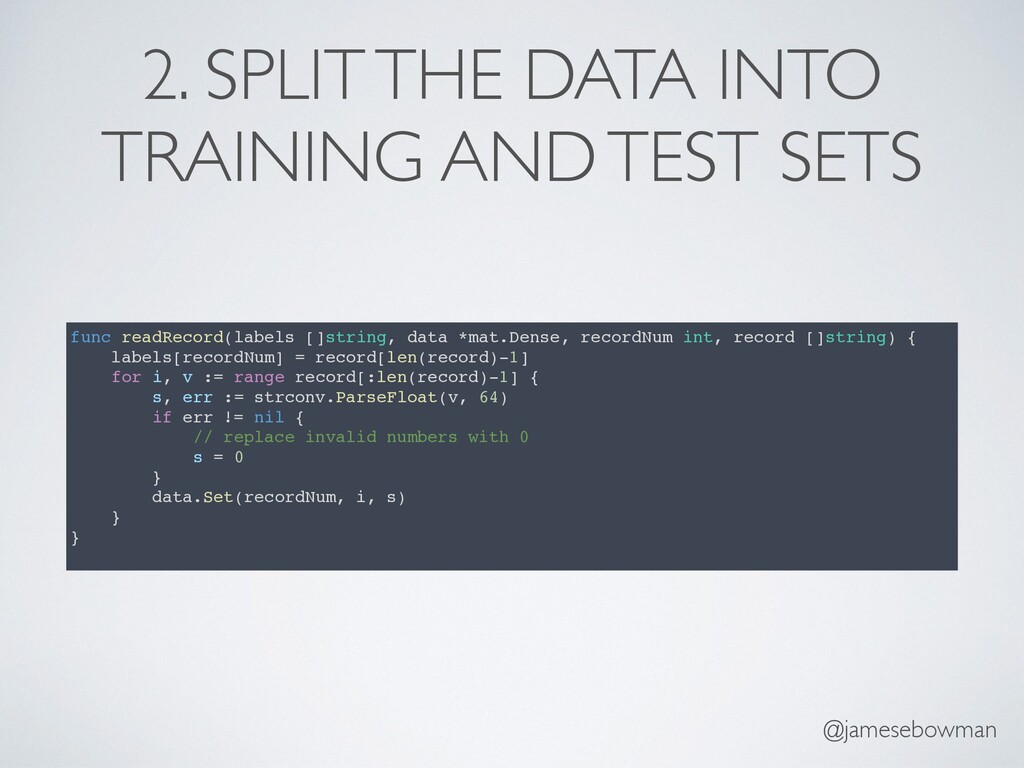
  13. @jamesebowman 2. SPLIT THE DATA INTO TRAINING AND TEST SETS

    func readRecord(labels []string, data *mat.Dense, recordNum int, record []string) { labels[recordNum] = record[len(record)-1] for i, v := range record[:len(record)-1] { s, err := strconv.ParseFloat(v, 64) if err != nil { // replace invalid numbers with 0 s = 0 } data.Set(recordNum, i, s) } }
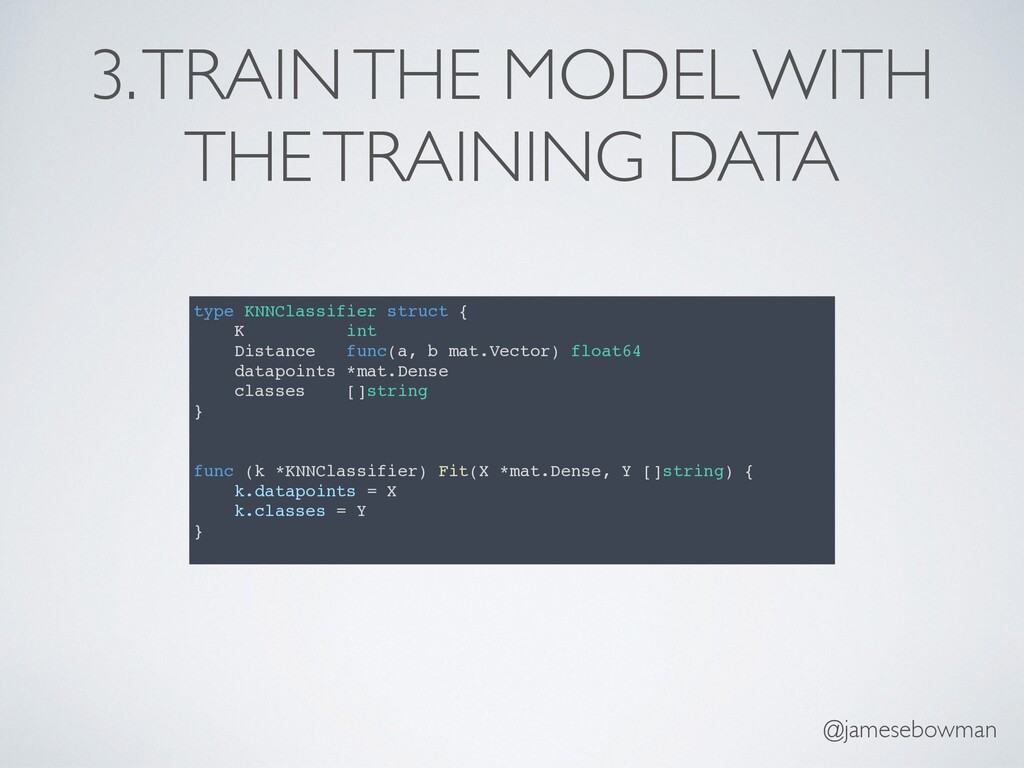
  14. @jamesebowman 3. TRAIN THE MODEL WITH THE TRAINING DATA type

    KNNClassifier struct { K int Distance func(a, b mat.Vector) float64 datapoints *mat.Dense classes []string } func (k *KNNClassifier) Fit(X *mat.Dense, Y []string) { k.datapoints = X k.classes = Y }
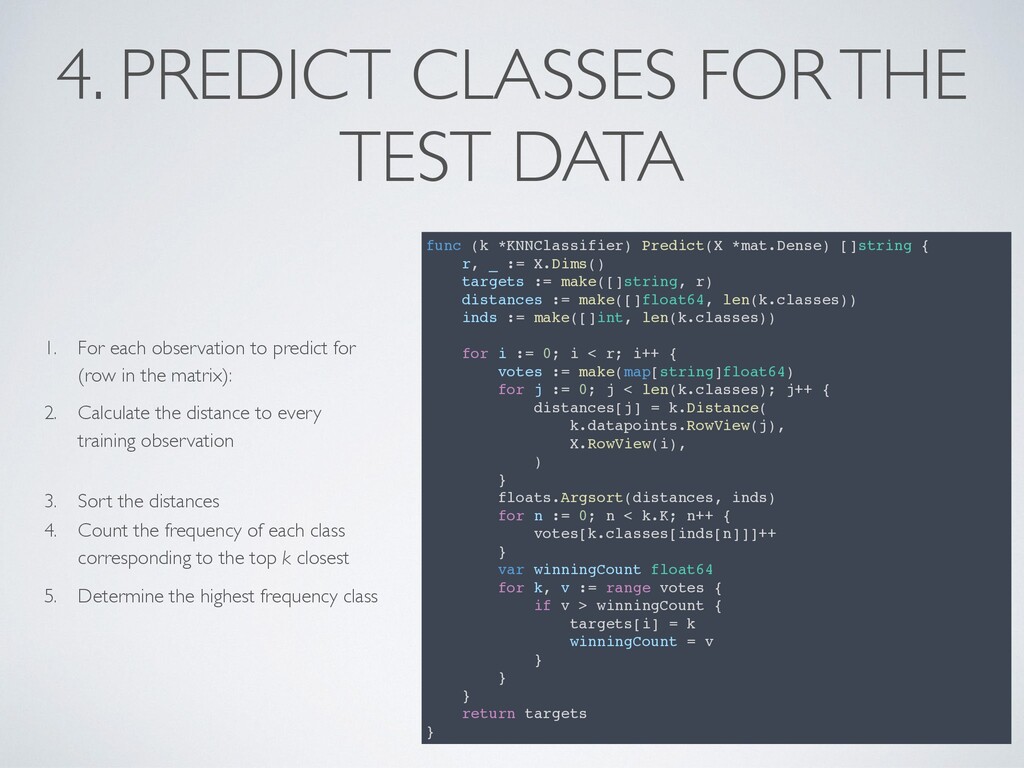
  15. @jamesebowman 4. PREDICT CLASSES FOR THE TEST DATA func (k

    *KNNClassifier) Predict(X *mat.Dense) []string { r, _ := X.Dims() targets := make([]string, r) distances := make([]float64, len(k.classes)) inds := make([]int, len(k.classes)) for i := 0; i < r; i++ { votes := make(map[string]float64) for j := 0; j < len(k.classes); j++ { distances[j] = k.Distance( k.datapoints.RowView(j), X.RowView(i), ) } floats.Argsort(distances, inds) for n := 0; n < k.K; n++ { votes[k.classes[inds[n]]]++ } var winningCount float64 for k, v := range votes { if v > winningCount { targets[i] = k winningCount = v } } } return targets } 1. For each observation to predict for (row in the matrix): 2. Calculate the distance to every training observation 3. Sort the distances 4. Count the frequency of each class corresponding to the top k closest 5. Determine the highest frequency class
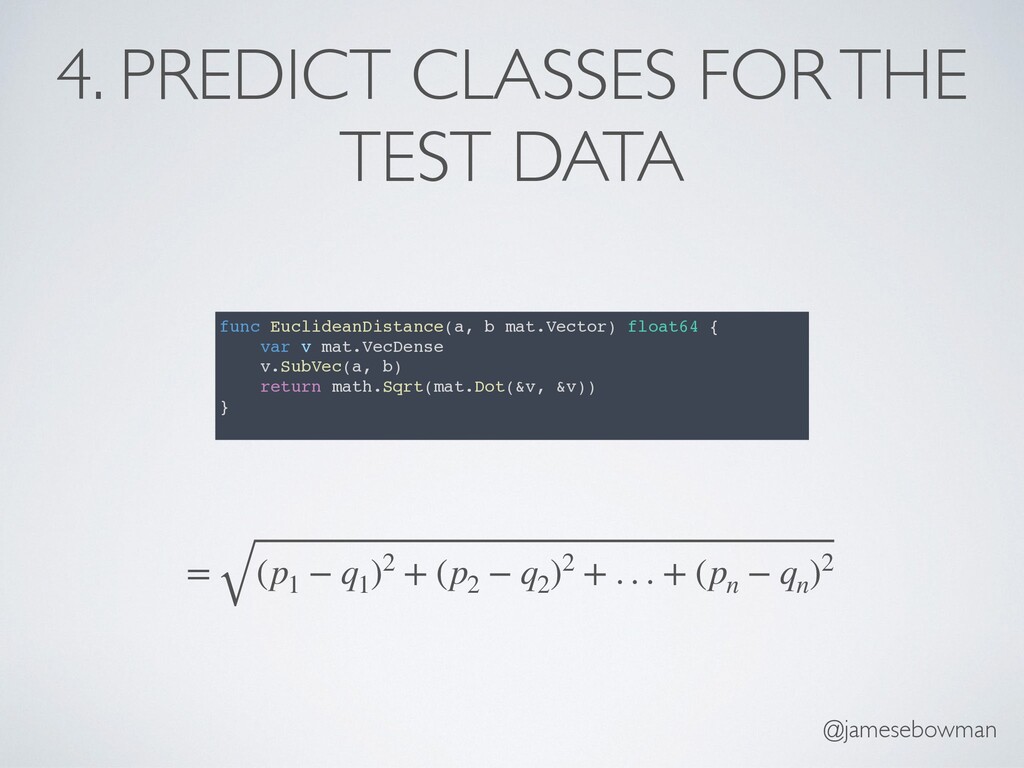
  16. @jamesebowman 4. PREDICT CLASSES FOR THE TEST DATA func EuclideanDistance(a,

    b mat.Vector) float64 { var v mat.VecDense v.SubVec(a, b) return math.Sqrt(mat.Dot(&v, &v)) } = (p1 − q1 )2 + (p2 − q2 )2 + . . . + (pn − qn )2
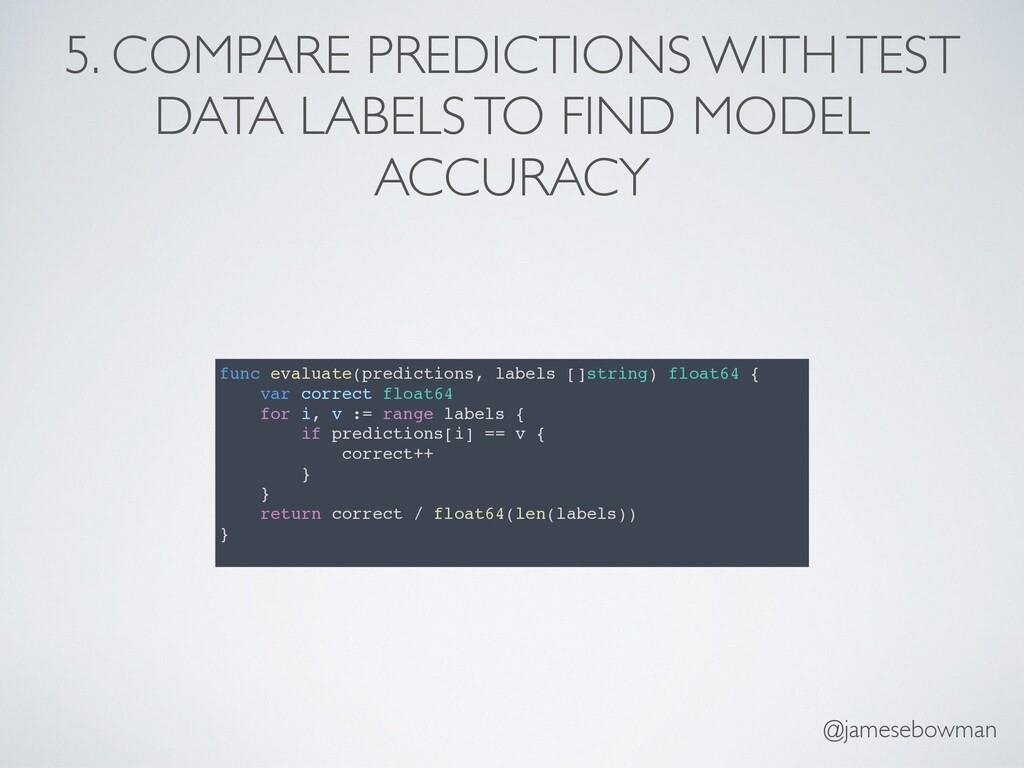
  17. @jamesebowman 5. COMPARE PREDICTIONS WITH TEST DATA LABELS TO FIND

    MODEL ACCURACY func evaluate(predictions, labels []string) float64 { var correct float64 for i, v := range labels { if predictions[i] == v { correct++ } } return correct / float64(len(labels)) }