Upgrade to Pro — share decks privately, control downloads, hide ads and more …

Code Smells in Spreadsheet Formulas Revisited on an Industrial Dataset

Bas Jansen
September 29, 2015

Code Smells in Spreadsheet Formulas Revisited on an Industrial Dataset

A few years ago, code smells were adapted to be applicable on spreadsheet formulas. The smell detection algorithm was validated on a small dataset of industrial spreadsheets by interviewing the users of these spreadsheets. Now a more in depth validation of the algorithm is done by analyzing a new set of spreadsheets of which users indicated whether or not they are smelly.

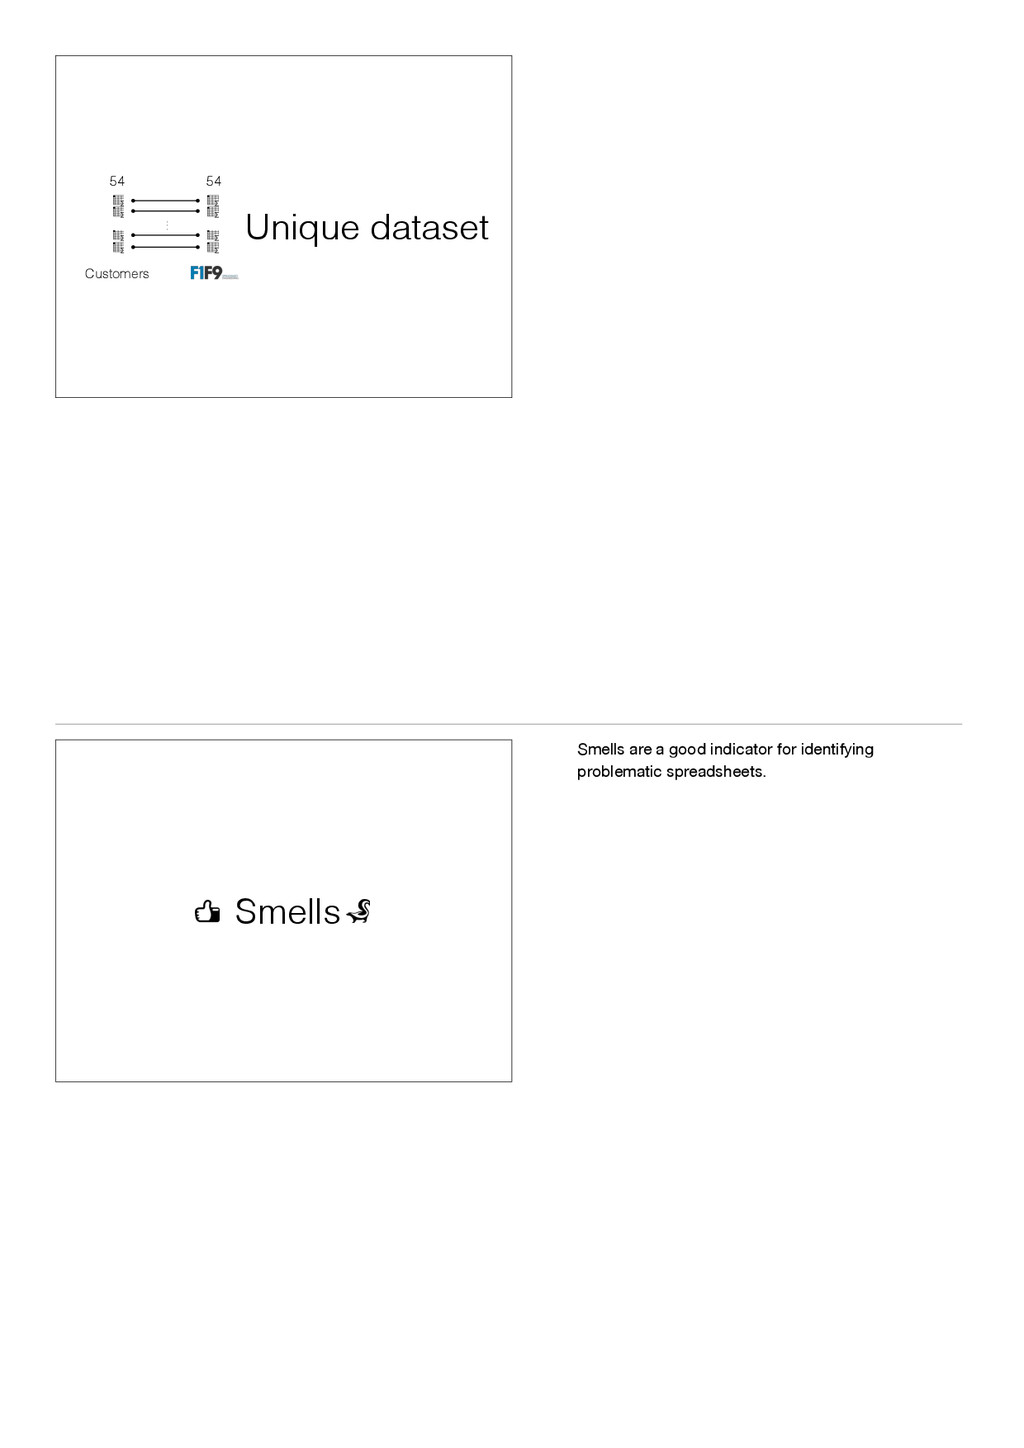
This new dataset gives us the unique possibility to get more insight in how we can distinguish `bad’ spreadsheets from `good’ spreadsheets. We do that in two ways: For both the smelly and non smelly spreadsheets we 1) have calculated the metrics that detect the smells and 2) have calculated metrics with respect to size, level of coupling. The results show that indeed the metrics for the smells decrease in spreadsheets that are not smelly. With respect to size we found to our surprise that the improved spreadsheets were not smaller, but bigger. With regard to coupling both datasets are similar. It indicates that it is difficult to use metrics with respect to size or degree of coupling to draw conclusions on the complexity of a spreadsheet.

This presentation was given in the Industry Track of the International Conference on Software Maintenance and Evolution (Sep 29 - Oct 1, 2015) ICSME15

Bas Jansen

September 29, 2015
Tweet

Other Decks in Science

Transcript

  1. Code Smells in Spreadsheet Formulas Revisited on an Industrial Dataset

    Bas Jansen | [email protected] | @heerbommel Felienne Hermans | [email protected] | @Felienne Icons made by Freepik from www.flaticon.com are licensed under CC BY 3.0 We are probably all familiar with code smells We are probably all familiar with the concept of code smells. A few years ago Hermans et. al 1 adapted code smells to use them in spreadsheets. In this study we had the opportunity to apply these code smells on a very interesting industrial dataset. But before I explain to you the uniqueness of this dataset, let’s do a quick review of the code smells. In the before mentioned study the following code smells were introduced. 1 F. Hermans, M. Pinzger, and A. Deursen, “Detecting code smells in spreadsheet formulas,” Proceedings of the International Conference on Software Maintenance (ICSM), 2012.
  2. But what about Code Smells in Spreadsheets Multiple Operations AKA

    Long Method Multiple Operations: Inspired by the code smell Long Method, this smell indicates the length of the formula. It measures the total number of operations that a formula contains. The slide shows a formula that is suffering from this smell with a total of 15 unique operations within the formula.
  3. Multiple References AKA Many Parameters Multiple References: Another well known

    code smell is Many Parameters. The spreadsheet formula equivalent is Multiple References. It counts the number of ranges a formula is referring to. An example of this smell is a formula with 79 references. Conditional Complexity Conditional Complexity: Many nested conditional operations are considered as a threat to code readability. The same is true for spreadsheet formulas. The Conditional Complexity smell measures the number of conditionals contained by a formula. In the slide you see a formula with 7 nested IFs functions. This was the maximum number of nested IFs that was allowed up to Excel 2003. The limit is now 64!
  4. Long Calculation Chain Long Calculation Chain: In spreadsheets, it is

    common that formulas refer to other formulas. Therefore, one could say that a spreadsheet consists of a collection of calculation chains. Tracing a long calculation chain is considered a tedious task. The smell is measured by the length of the longest path of cells that need to be referenced when computing the value of the formula. Duplicated Formula AKA Duplicate Code Duplicated Formulas: The equivalent of the Duplicate Code smell in spreadsheets is the Duplicated Formulas smell. It is measured by the number of identical formulas that are located in the same worksheet and having at least one function or operator. In the slide in row 39 you can see an example of four identical formulas.
  5. This study had two limitations However, the study in which

    these code smells were introduced had two limitations.
  6. Small Dataset Of 10 Spreadsheets First of all the dataset

    was very small. It consisted of only 10 spreadsheets and they were all from the same company. We did not know if these Spreadsheets were suffering from Smells Secondly we didn’t know if any of these spreadsheets were suffering from smells. We want to use smells as an indicator for bad or smelly spreadsheets. But it could very well be the case that the 10 spreadsheets in the dataset were very well designed and nevertheless contained smells. What we were missing was a ground truth about the smelliness.
  7. Early 2014 we had the opportunity to work together with

    one of our industrial partners: F1F9. FiF9 is the world largest financial model building firm. They develop financial models in Excel for their customers, often based upon the customer’s existing spreadsheet models.
  8. 54 54 Customers ... They provided us with a very

    unique dataset of 54 pairs of spreadsheets 1 . What makes the dataset unique is the fact that we have a customer spreadsheet and a matching spreadsheet that was created by F1F9 based upon the customer spreadsheet. In other words we have pairs of spreadsheets with and without ‘treatment’. Furthermore it is reasonable to assume that the customer spreadsheets contain some problems. If that was not the case, the customer wouldn’t ask F1F9 to rebuild the model. This dataset thus overcomes the two limitations we mentioned earlier. The dataset is much larger. We now have 108 spreadsheets which are coming from different companies and we know that half of them are smelly. The dataset also enables us to do a pairwise comparison. 1 To protect the confidentiality of the models we only had access to the dataset on F1F9s premises and then only indirectly whereby our software automatically generated and stored only the necessary survey statistics. At no point did we have direct access to the models, nor did our software extract any commercial data from the models. Do contain fewer ? The question that immediately popped into our minds was: Do F1F9 sheets contain fewer smells? To answer that question we analyzed the spreadsheets.
  9. And indeed we saw that the occurrence of smells in

    the F1F9 sheets was much lower. This was true for four of the five smells. The exception was the Long Calculation smell. The occurrence of this smell was slightly higher in the F1F9 sheets than in the customer sheets. Now what did the model builders of F1F9 do different than the customers? First of all they build financial models for a living. But another important difference is that they use a strict method for building spreadsheets. They use the so called FAST Standard. In this standard we find a set of guidelines that helps us to understand why the F1F9 sheets contain less smells.
  10. Multiple Operations Multiple References First of all FAST strongly advices

    to create short and easy to understand formulas. Of course this helps to decrease the occurrence of the Multiple Operations and Multiple References smells. IF No Conditional Complexity Furthermore, FAST discourages the use of the IF functions. This reduces the occurrence of the Conditional Complexity Smell.
  11. 1x Duplicated Formulas A third guideline within FAST is that

    formulas should be consistent along row or column axis, meaning that the formula should be crated once and than dragged to the right of the bottom. Also a calculation should only be made once. Both the latter rules help to reduce the smell of Duplicated Formulas. But why longer calculation chains? But what about the Long Calculation Chains? Why do they occur more in the F1F9 sheets.
  12. - Multiple References - Multiple Operations + Long Calculation Chains

    This is a logical result of reducing the smells Multiple References and Multiple Operations. The reduction of these two smells implies breaking long formulas in shorter parts which inevitable leads to longer calculation chains. Do smelly spreadsheets differ from non smelly spreadsheets with respect to size and level of coupling? So this settles the story with respect to smells. However it does not end the story for the study. In source code analysis, besides smells, other metrics with respect to size and coupling are used to analyze the quality of the code. Therefore we did the same for the spreadsheets. We defined several metrics for size (non-empty cells, # worksheets, # formulas, # unique formulas, and length of formula) and coupling (# external links per spreadsheet, # interworksheet connections, path depth, and # transitive precedents) and calculated these metrics for both the customer and F1F9 dataset. Intuitively we expected that the customer sheets would be bigger and have a higher degree of coupling (knowing that more lines of code and a high level of coupling between methods have a negative impact on code quality).
  13. To our surprise the results proved otherwise. For four of

    the five metrics the F1F9 sheets were bigger than the customer sheets. With respect to coupling they scored similar, but the F1F9 sheets had significantly more interworksheet connections per spreadsheet.
  14. So again we analyzed the FAST standard to understand these

    findings. The standard gives guidelines for organizing a spreadsheet model. It makes a distinction between Foundation, Workings, Presentation and Control sheets. Foundation sheets contain all the input values and assumptions of the model. All calculations are done within the Workings sheets and the results of the calculations are presented in the Presentation sheets. The control sheet is mainly used during the development of the model. It normally contains list of pending changes, version control, table of contents, etc. However this guideline increases the number of worksheets and make the spreadsheet bigger. Furthermore according to the FAST standard a consistent column structure should be maintained across all sheets. Within financial models it is not uncommon to work with a time horizon of 30 years, leading in all worksheets to at least 30 columns. And because all formulas should be consistent along rows and columns all these formulas will be repeated. These rules increase the number of empty cells and the number of formulas. Finally FAST advices to execute all calculations in so called calculation blocks. A calculation block consists of all the ingredients that are necessary for a calculation. Ingredients can also be used in other calculations. In such a case the ingredients are repeated to form a new calculation block. This both increases the number of non-empty cells and interworksheet connections.
  15. Unique dataset 54 54 Customers ... Smells Smells are a

    good indicator for identifying problematic spreadsheets.
  16. By applying the guidelines of the FAST standard users decrease

    the occurrence of smells (even without knowing the definition of the smells itself) Coupling Size Metrics with respect to size and coupling do not succeed in differentiating between smelly and non smelly spreadsheets.