Maps are important & here’s why you might want to make your own
Presented at #maptime Chattanooga ( https://github.com/maptime/chattanooga )
=======
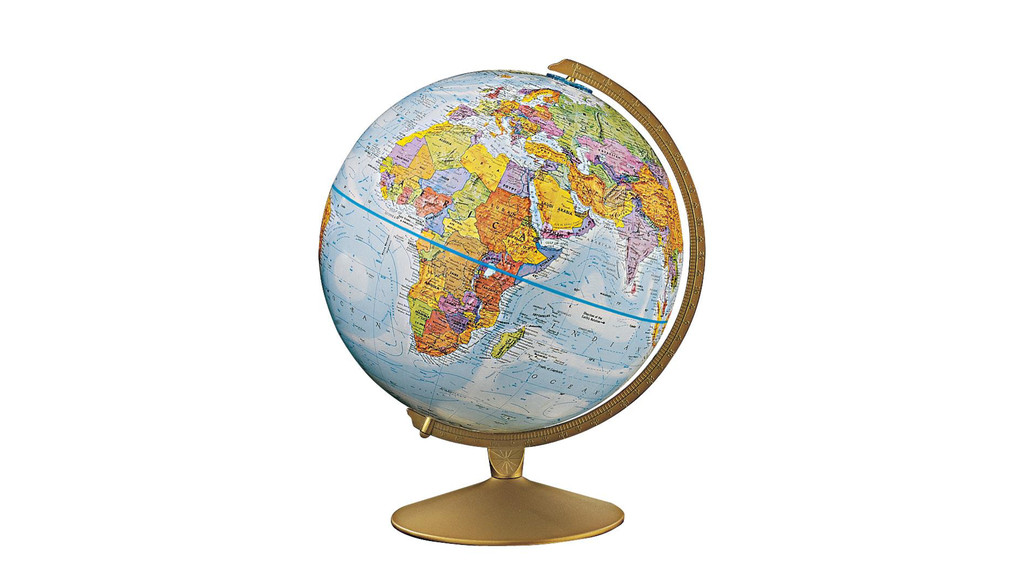
I had a globe when I was a kid. It looked almost exactly like this. I used to spend hours looking at it, unable to pronounce most of the names. But boy, did I have fun spinning it around. Of course, my globe had a big section on it that didn’t have the name of any country I’d ever heard of – U S S R. It wasn’t until much later that I came to understand something about this.
maps change over time
so do the things they represent
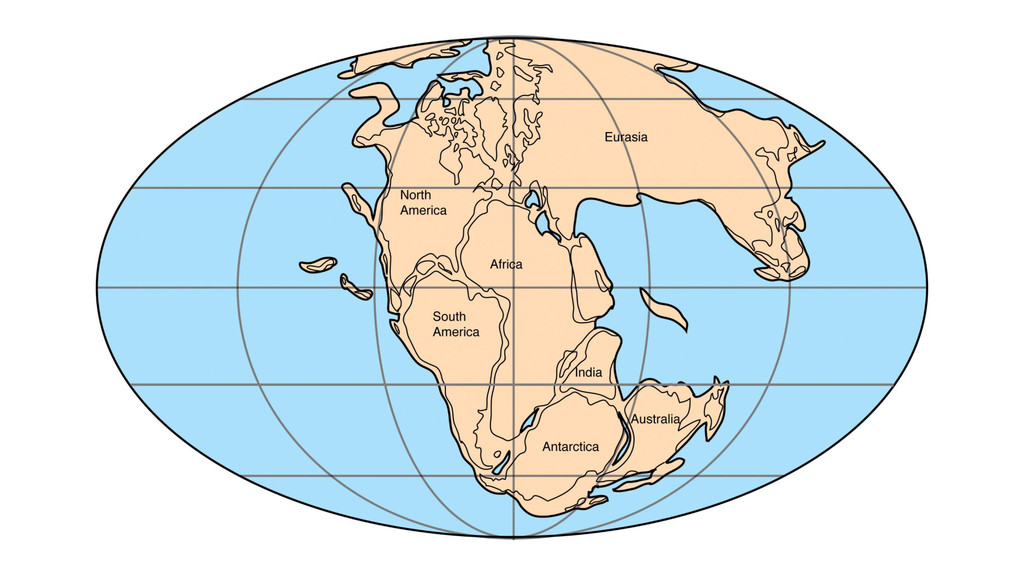
The earth change over time geographically. This happens over hundreds of millions of years geologically.
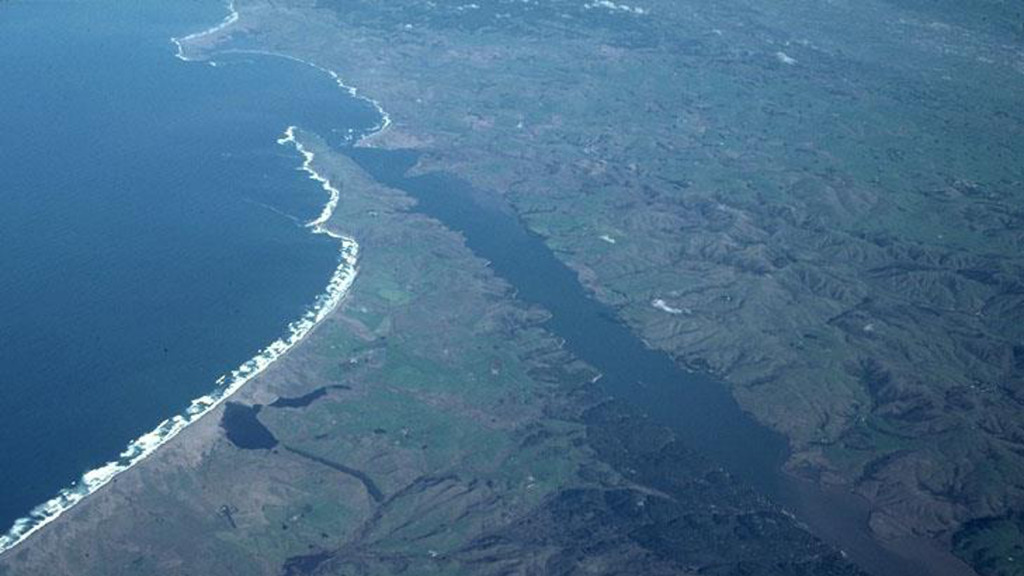
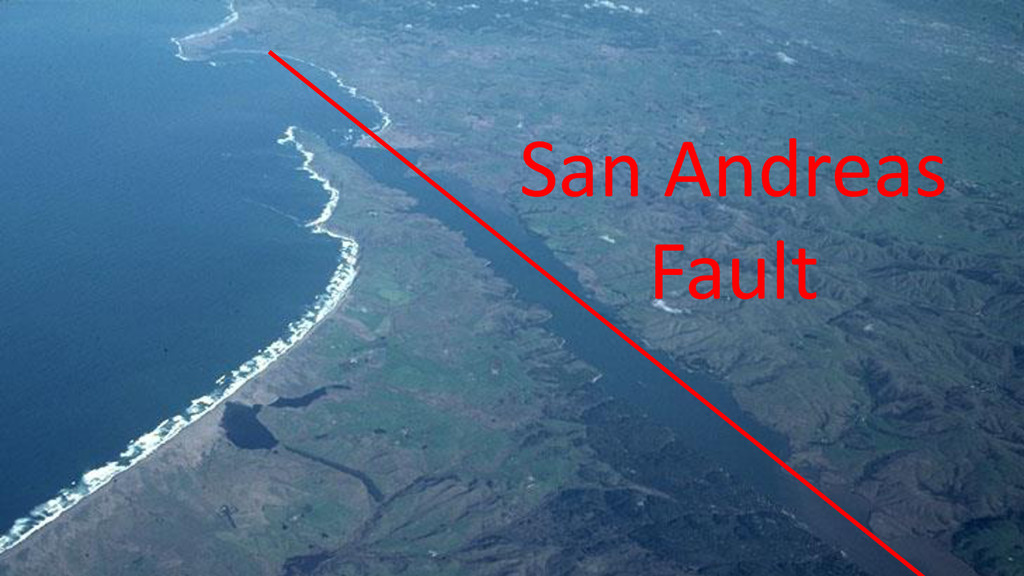
It also changes over relatively short periods of time, and in dramatic, sudden events. This is a photo of Pt. Reyes, California. Guess where in this photo the San Andreas Fault lies?
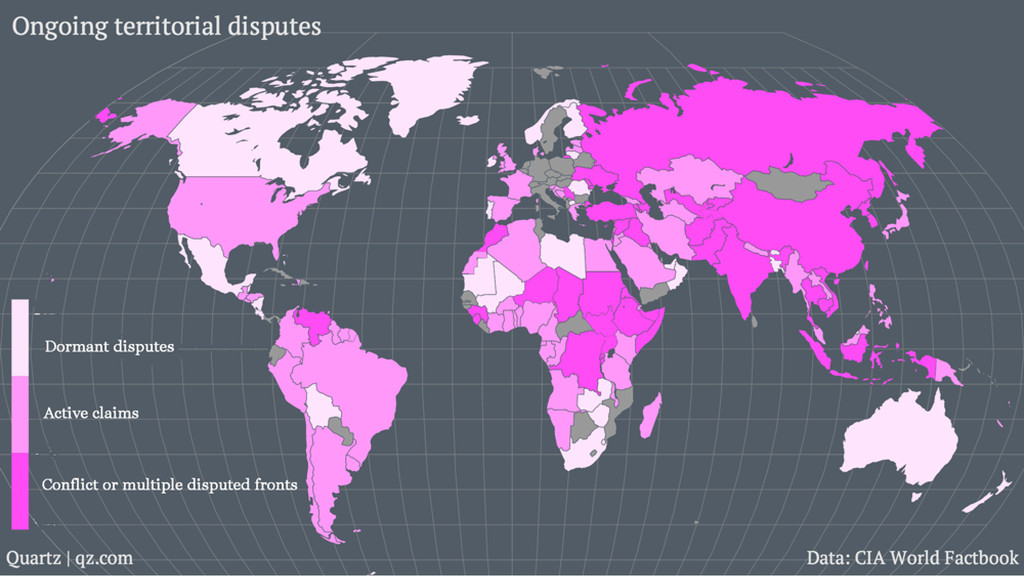
Of course, maps don’t just represent the earth. All of the lines on maps are artificial boundaries, created to describe the limits of something. Here is a map of areas of the world with ongoing territorial disputes. The more saturated coloring describes areas of most intense disputes, that is, where the lines are less certain or more likely to change.
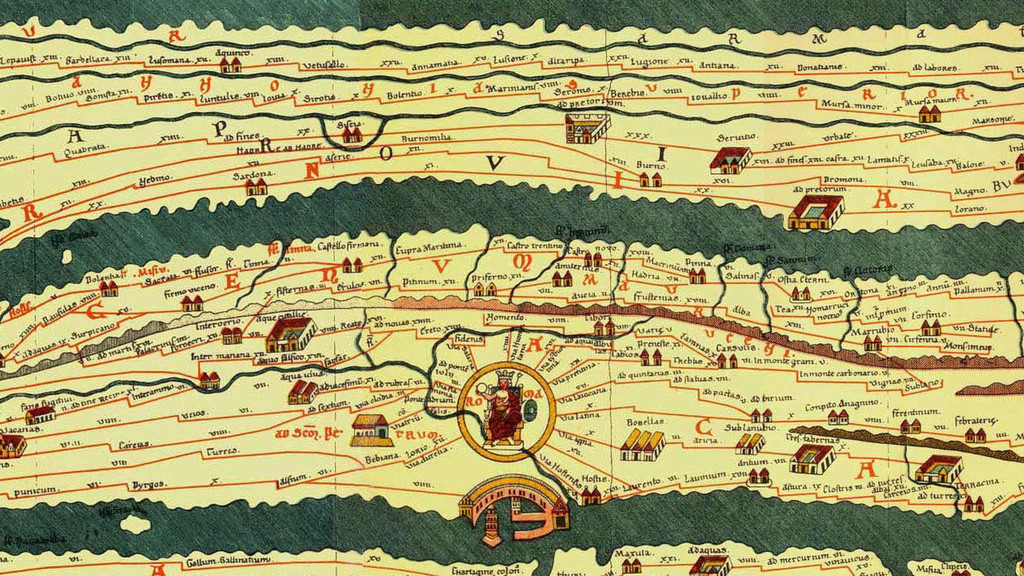
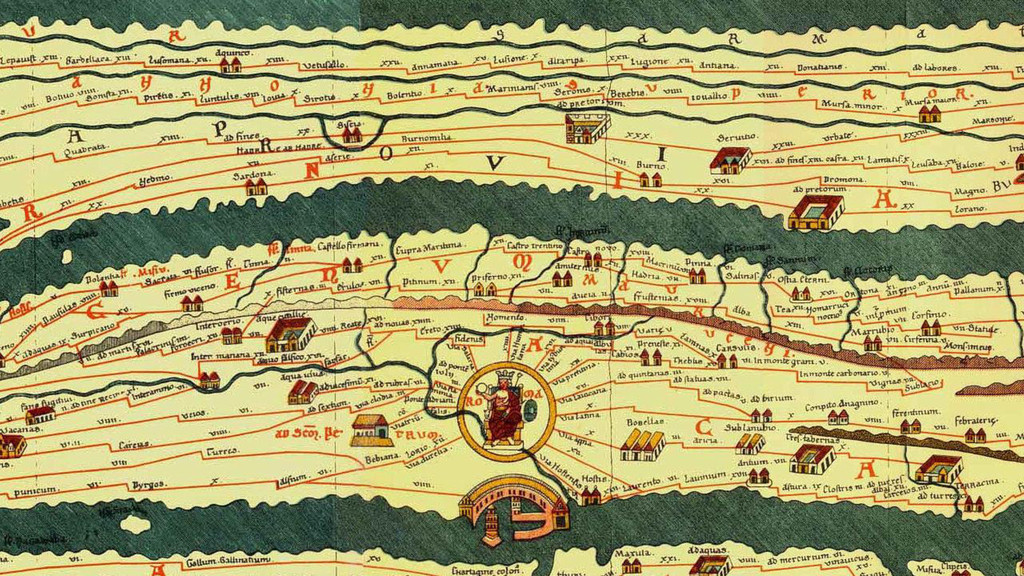
Maps, then, are tools to control land and territories over a larger area than you can see with your own eyes. In fact, maps were one of the key technologies of famous ancient empires, like the Roman Empire. Here’s an early map depicting trade routes and military roads, all of which leading to Rome there in the middle.
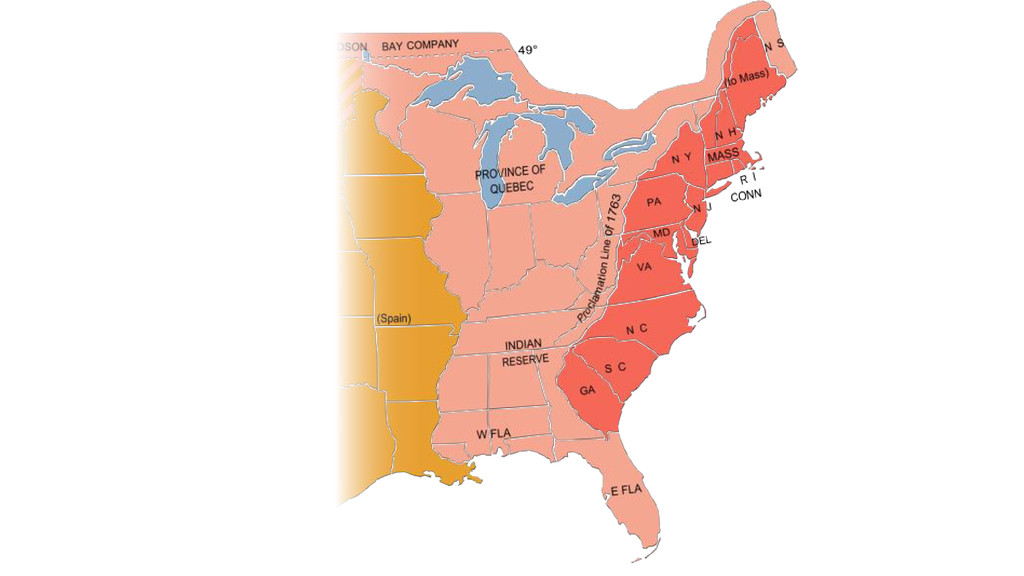
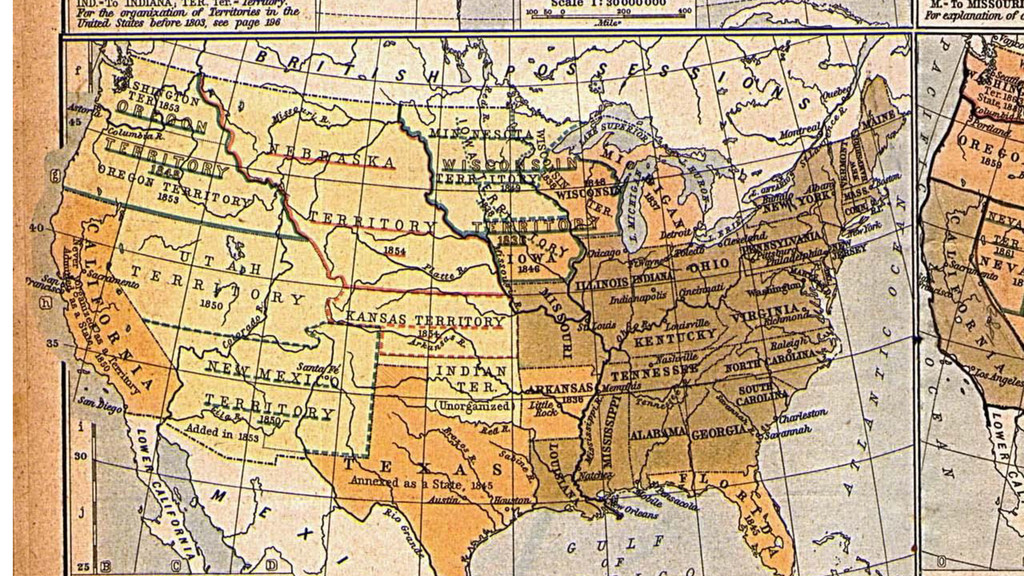
And maps represent the territorial expansion of our own country. The process of claiming new land first involved surveying and mapping it, then describing borders and announcing a claim. This paper description then became the deed of ownership which nations fought over and bartered.
Under the Western World view, the territorial claim made by White Western surveyors outweighed that of indigenous inhabitants of the territories because of maps and survey lines. So maps become these well described abstractions through which to assert administrative control and manage empire.
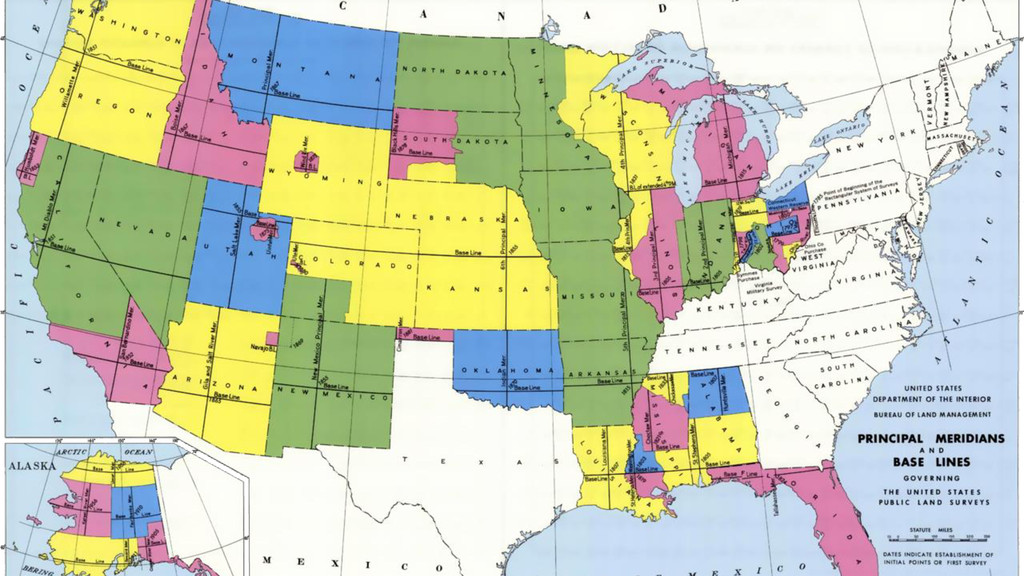
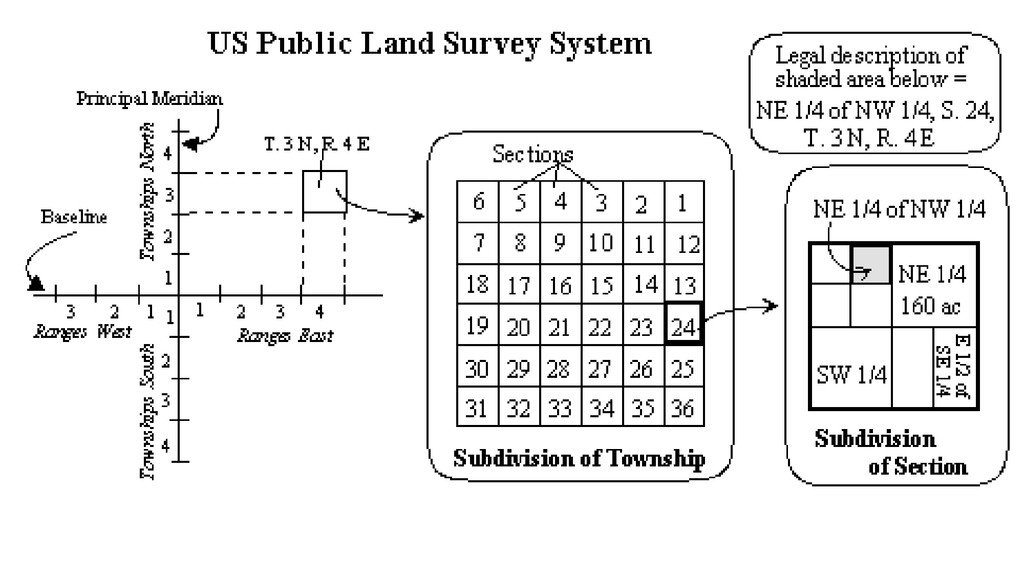
But maps were also seen for their commercial value. The Public Land Survey System (PLSS) was created to map and survey the new territories in the newly formed United States to encourage settlement and development, and to enable the sale of territories to settle debt. It is still the basis of the majority of mapping grid systems used for land registration and other surveying in the country.
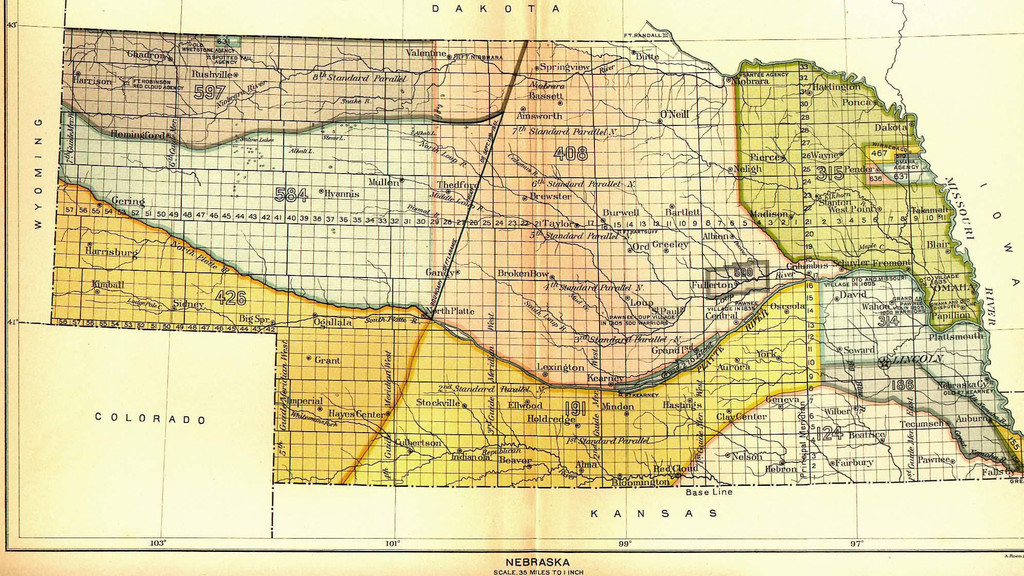
The countryside was divided up into neat rectangular grids, called Townships
Townships were divided into Sections of 640 acres, and sections could be subdivided further. Under the Homestead Act, settlers could claim a quarter-section, or 160 acres of land. So having this neat, mathematical grid allowed bureaucrats on one side of the country to convince people to uproot their whole lives and move thousands of miles to become rock farmers.
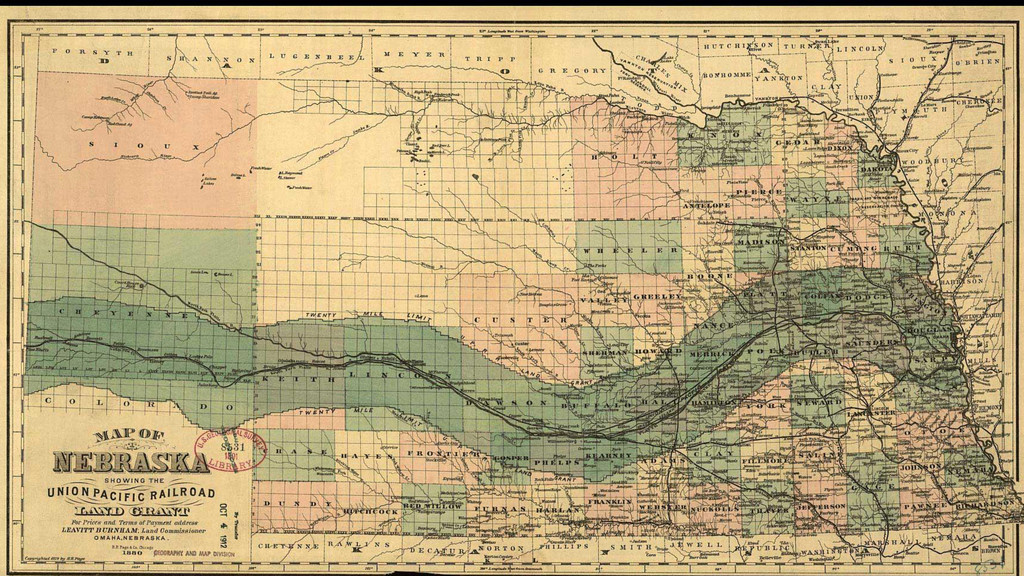
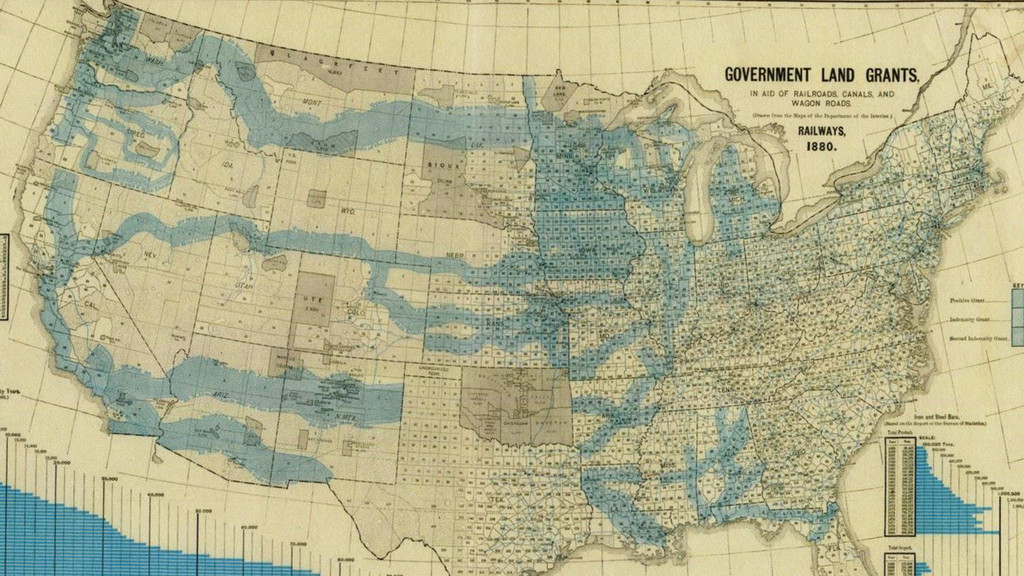
Land grants were also used to encourage railroad growth. Huge swathes of the country were given to rail road companies in exchange for their massive infrastructure investments to connect the new countryside and induce further development.
Land grants also made possible most state university systems, which also established the new profession of forestry, the scientific management of public lands to harvest natural resources in a systematic manner. Coming back from a tangent, maps can be really good for economic development.
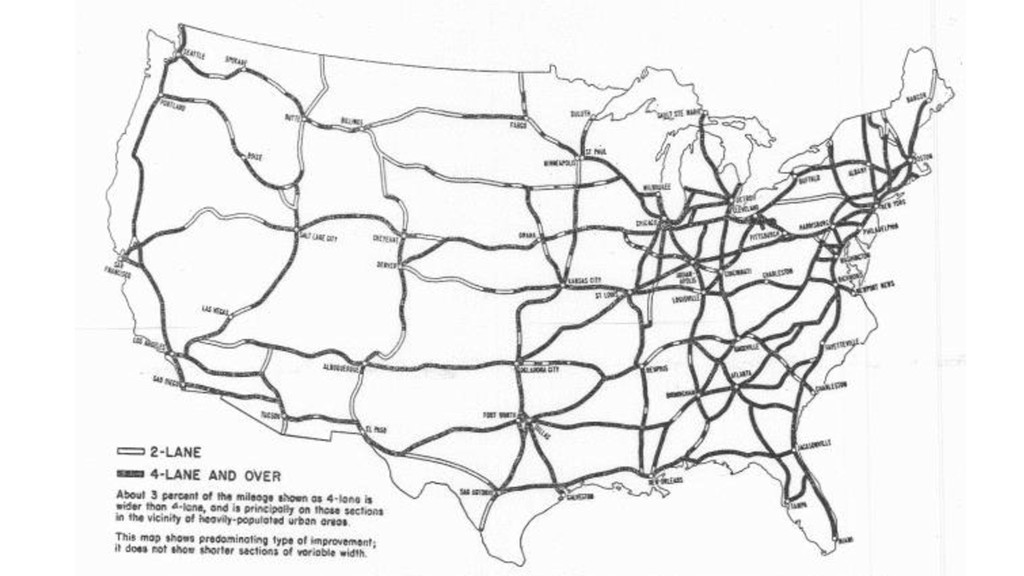
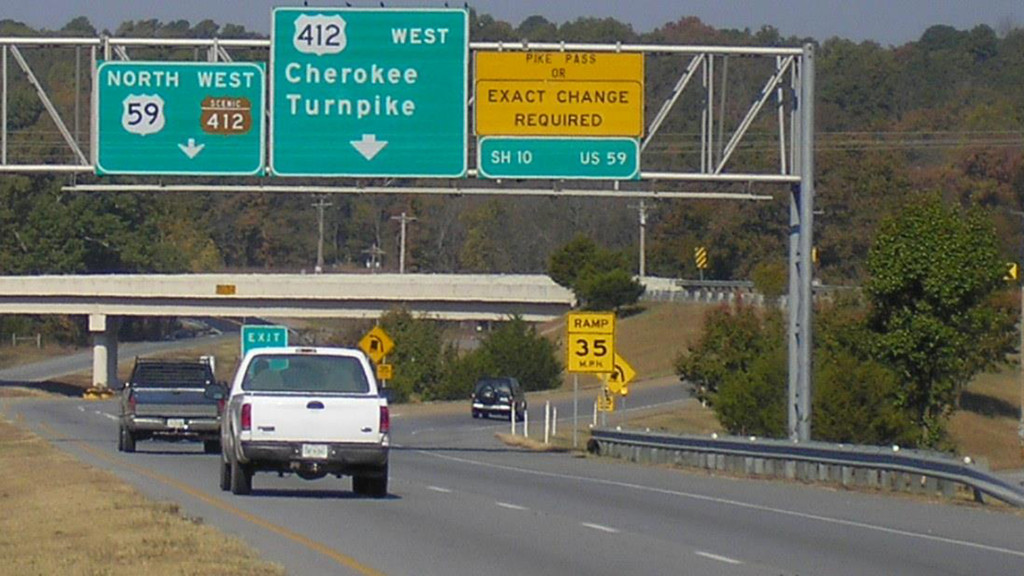
Of course, maps are also used for navigation. This is probably the way you use maps most often, to look up directions from point A to point B. Maps make it easier to figure out where to go in the world. Here’s an early map of the proposed Eisenhower Interstate Highway System in 1955. Here, the numbering characteristics used for planning and designing the system (like route numbers and exit numbers) were also crucial for making use of the system.
These signs and symbols became wayfinding devices both on maps and in the real world, helping people navigate the compex network of roadways.
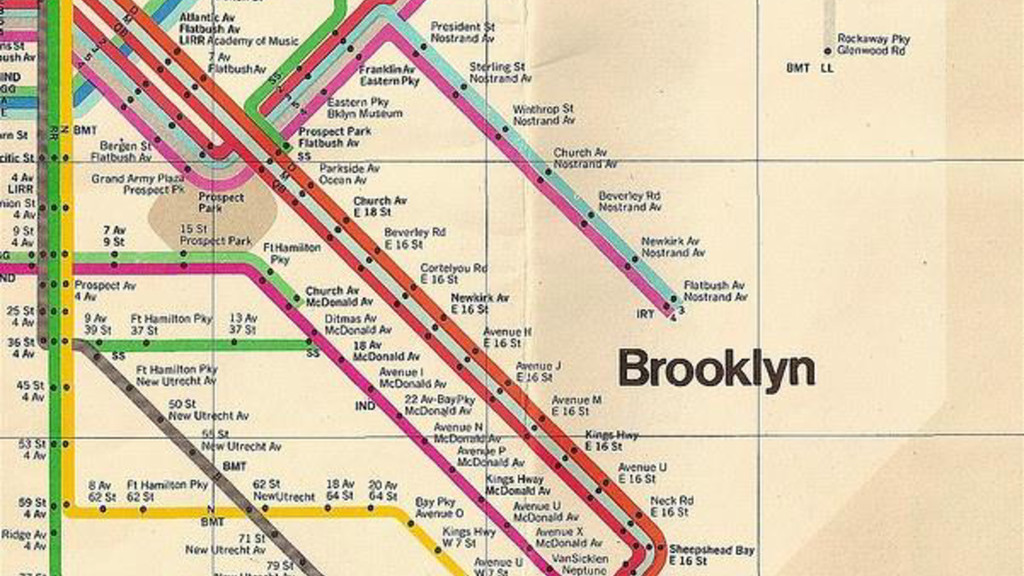
Maps also help us make use of other types of transit networks, such as the New York City subway system. Here, Massimo Vignelli’s famous map of the subway lines uses a simplified, schematic illustration of the road network to emphasize connectivity of different parts of the city, sacrificing georeferenced fidelity (that is, the exact location of where things are in relation to each other) in favor of readability and usability. For many New Yorkers, maps like this form the basis of the mental model used to think about the city.
That’s really not so different from this schematized map of the Roman Empire which, again, emphasized transportation. In the contemporary design, the map is a tool used to help us conquer the complexity and scale of the megacity, allowing us to claim a greater territory.
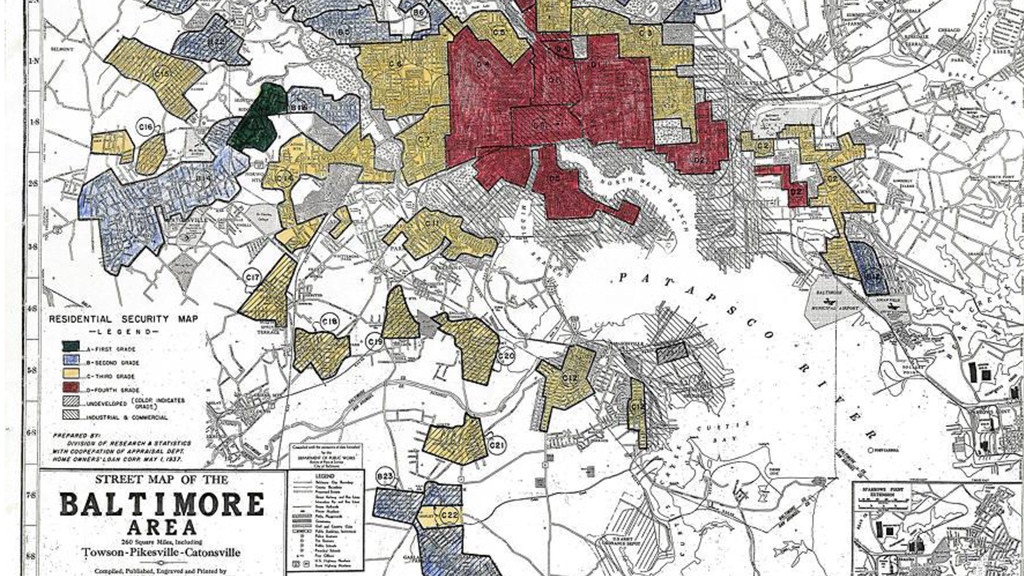
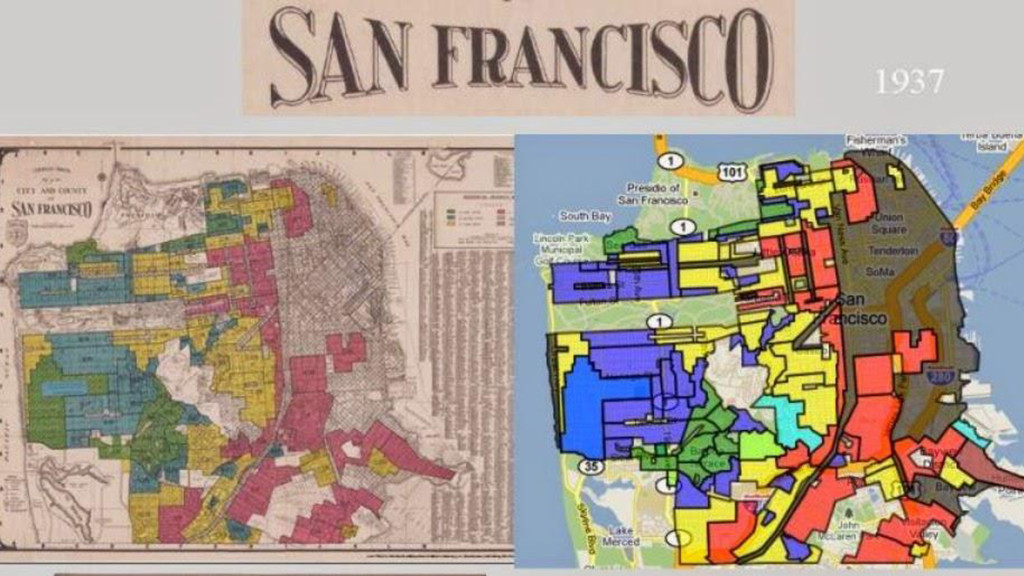
Maps are also used to show where certain phenomena are happening. This is a map of historic red-lining in Baltimore. Basically, home lenders used geographic models to minimize their risk for mortgages based on neighborhood characteristics. Unfortunately, the criteria they used had the effect of strongly reinforcing historic racial and ethnic neighborhood boundaries, artificially limiting the economic opportunities of African American and other non-dominant groups and contributing to their historic, institutional oppression.
Activist mapping helped surface these practices and change these policies, but maps continue to play a vital role in pressuring for equitable policies, especially in matters like public services and environmental justice.
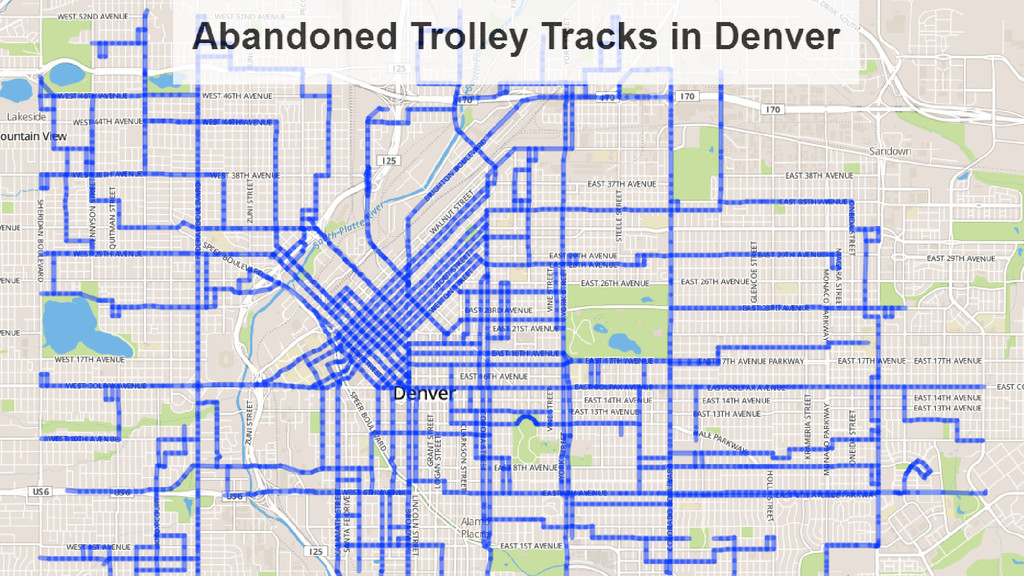
Maps can help us see the past and envision the future. Many American cities (including Chattanooga!) at one time had vibrant street car systems which shaped their urban development. In all but a few cases, these systems have long been abandoned. Using data from Denver’s open data portal, my friend Drew Wilson made this map of the old trolley system to make it visible once again. Maps can also let us speculate about possible different futures and let us have conversations about how we want our cities to be.
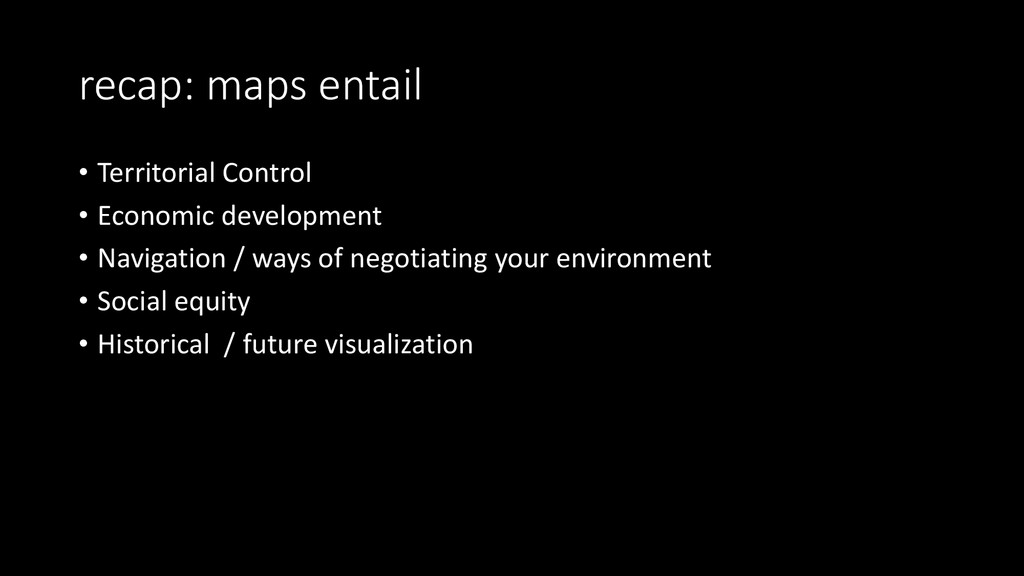
So, maps entail
-Territorial Control
-Economic development
-Navigation / ways of negotiating your environment
-Social equity
-Historical / future visualization
Maps are extremely potent
Learning how to read maps &
make maps gives you super powers


 jasondenizac
 yasslab
 dragon2
 kekekenta
 ichiroc
 mutomasa
 kentaroy47
 ainischool
 pawan_pharm
 robintux
 2720japanoke
 naoji_taniguchi_ksk_0827
 aleyda
 katiecoart
 marktimemedia
 tonyrice
 baasie
 eileencodes
 tanoku
 twada
 ammeep
 apolaine