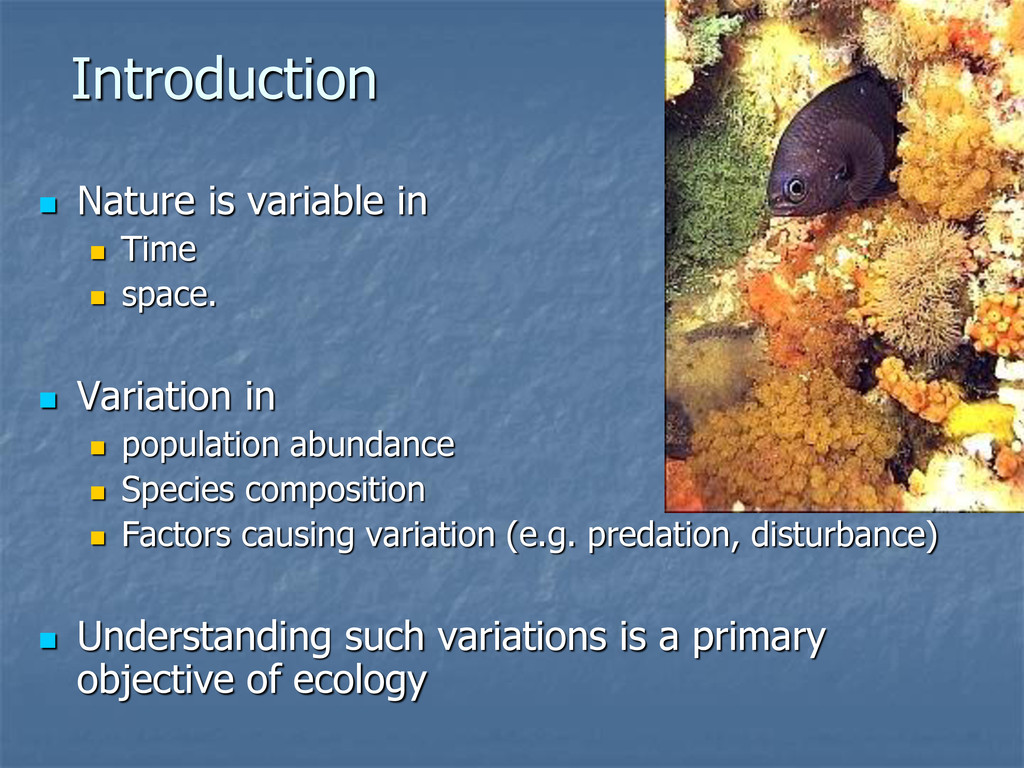
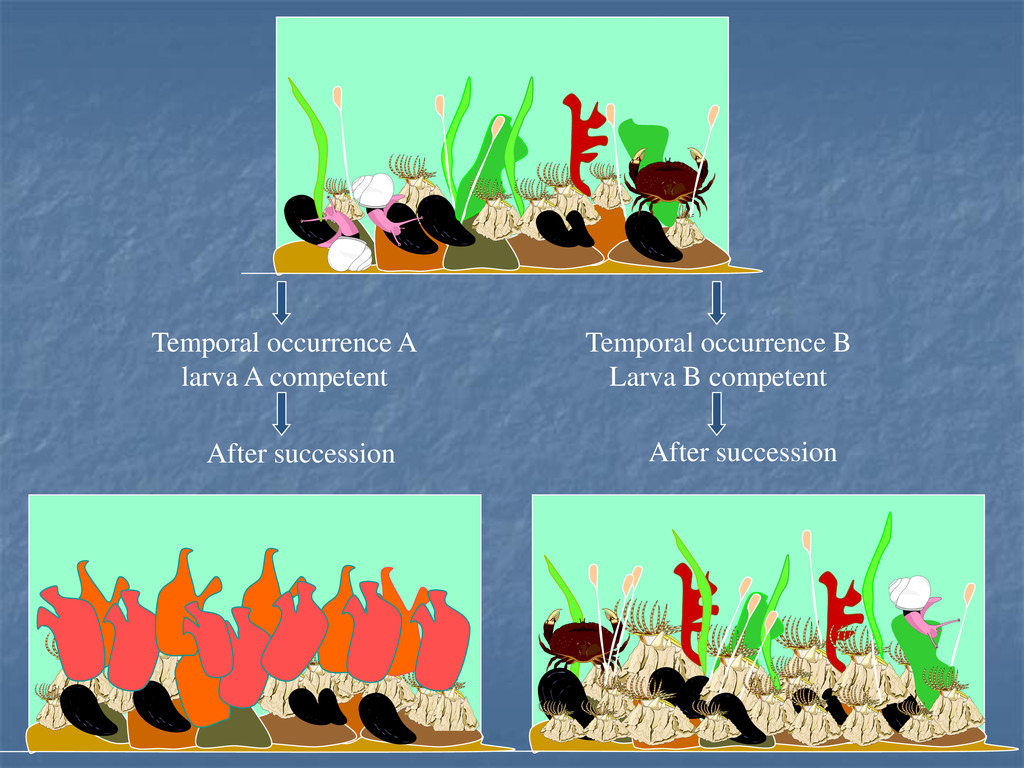
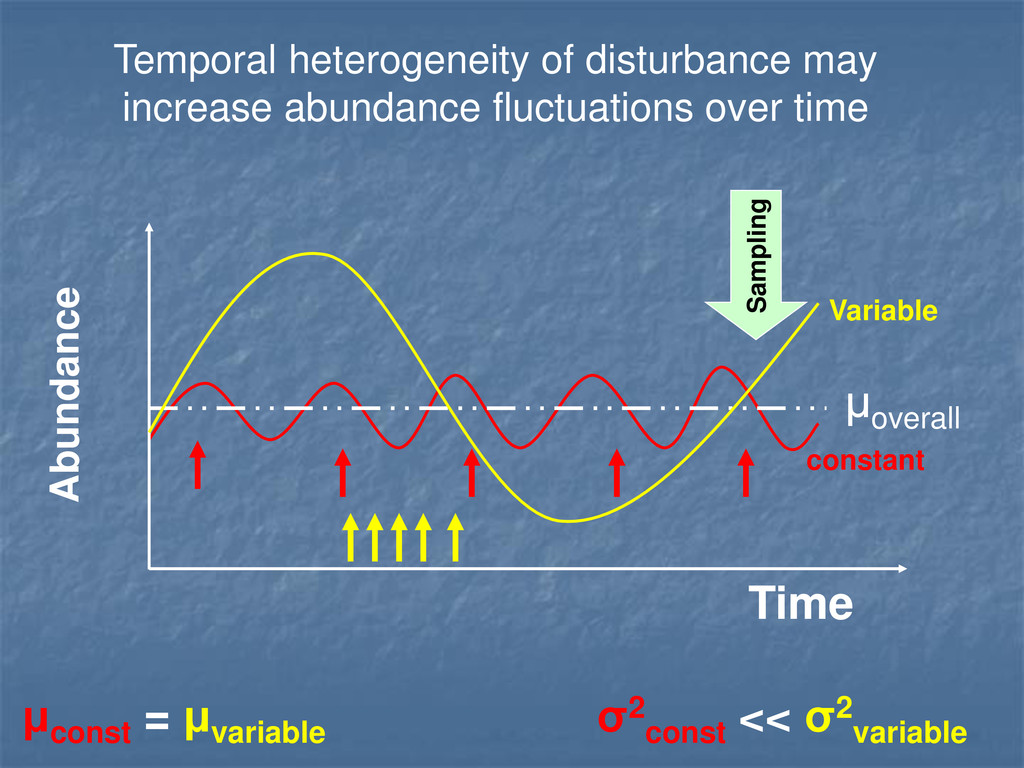
Variation in population abundance Species composition Factors causing variation (e.g. predation, disturbance) Understanding such variations is a primary objective of ecology
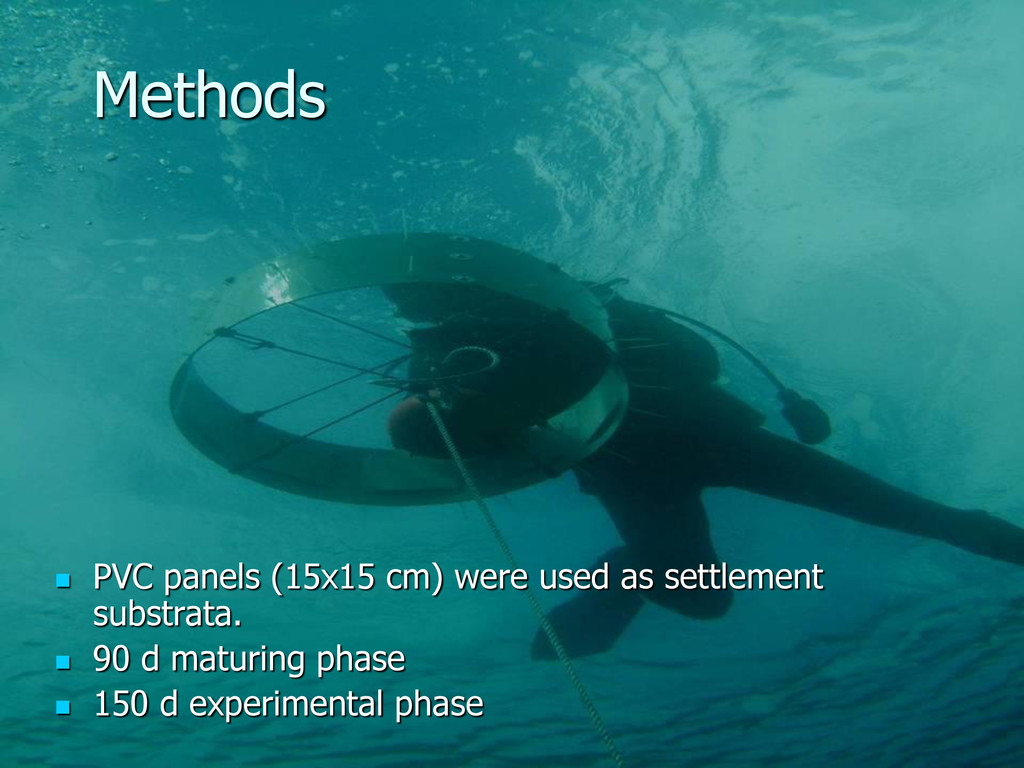
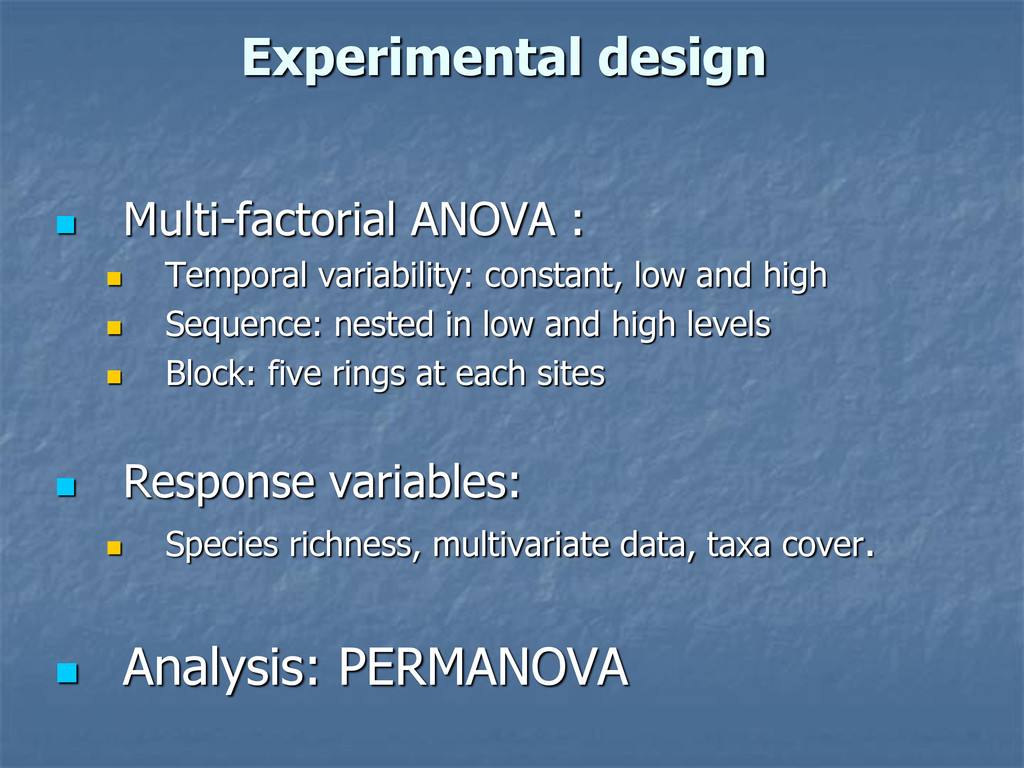
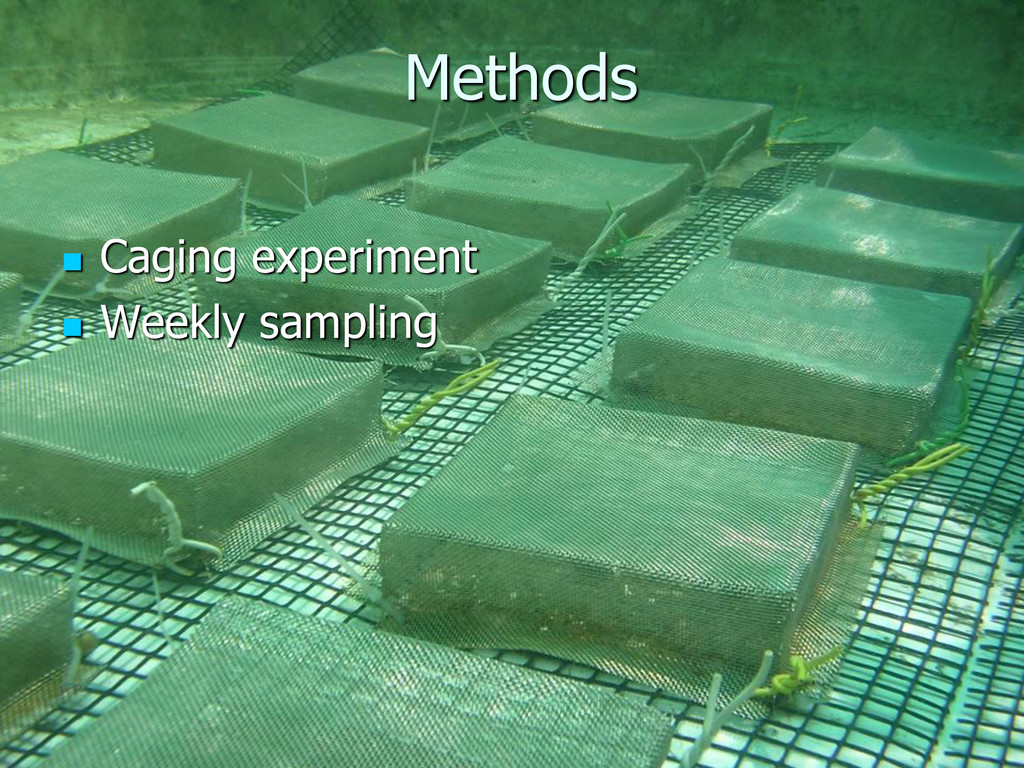
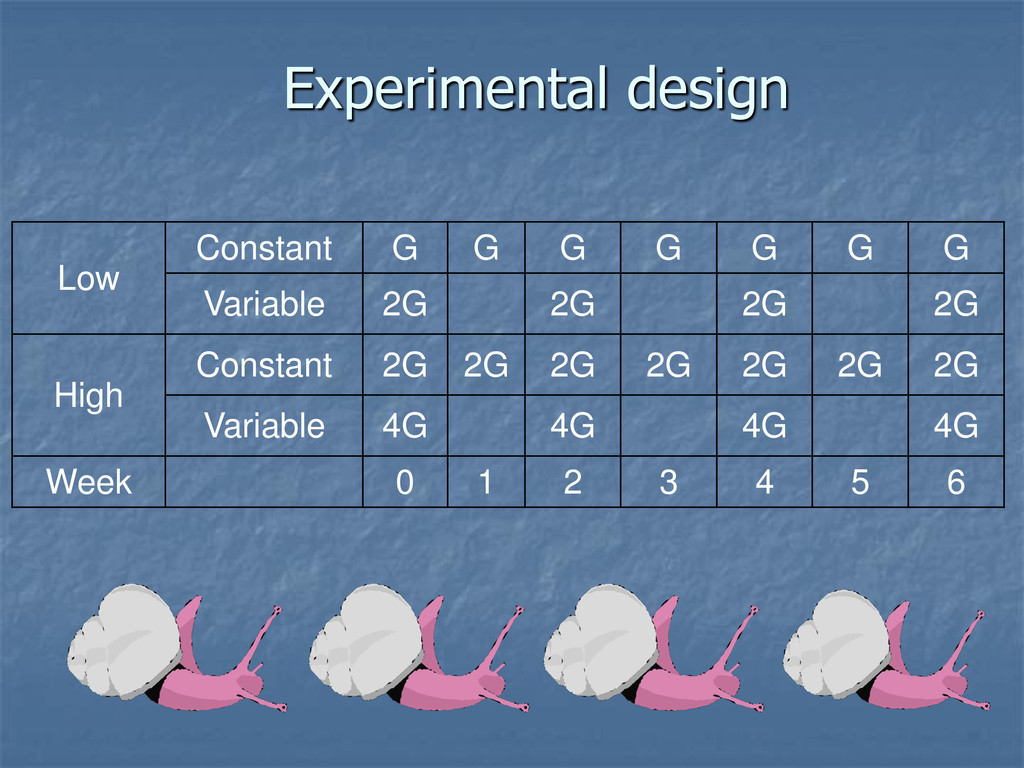
low and high Sequence: nested in low and high levels Block: five rings at each sites Response variables: Species richness, multivariate data, taxa cover. Analysis: PERMANOVA
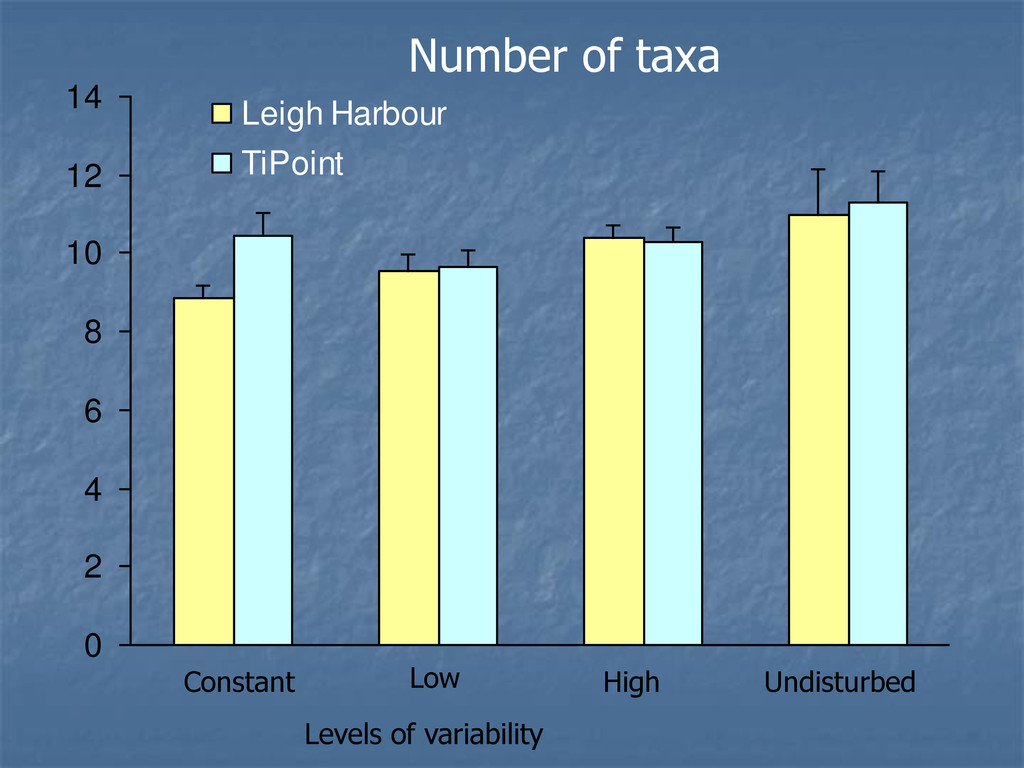
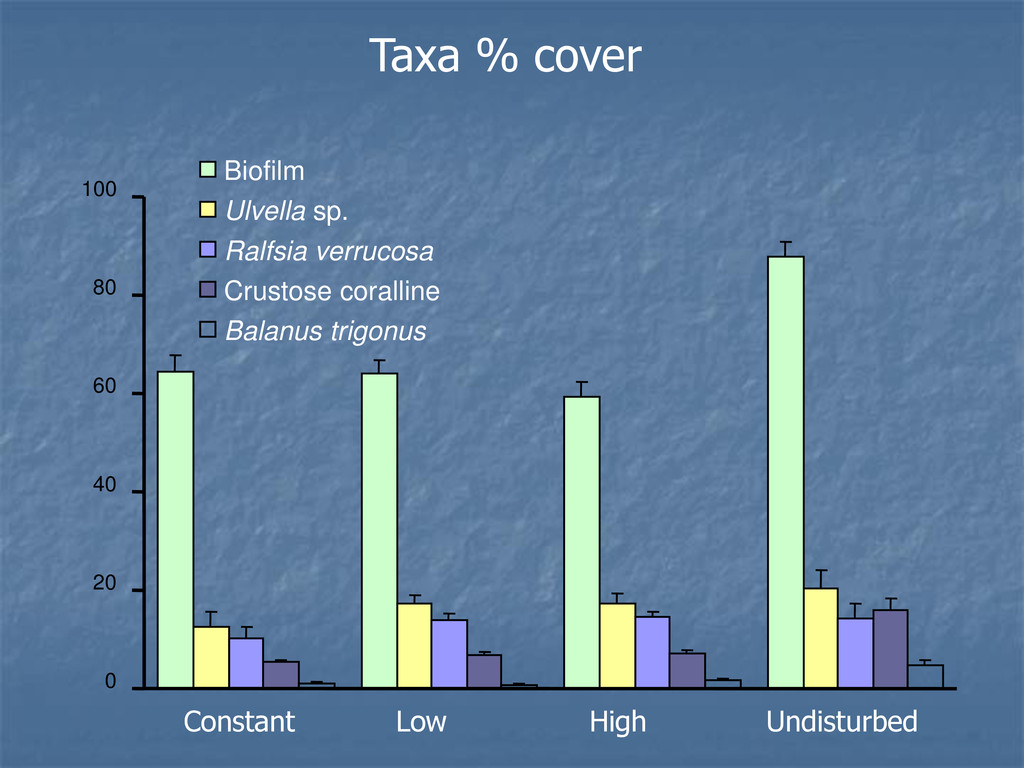
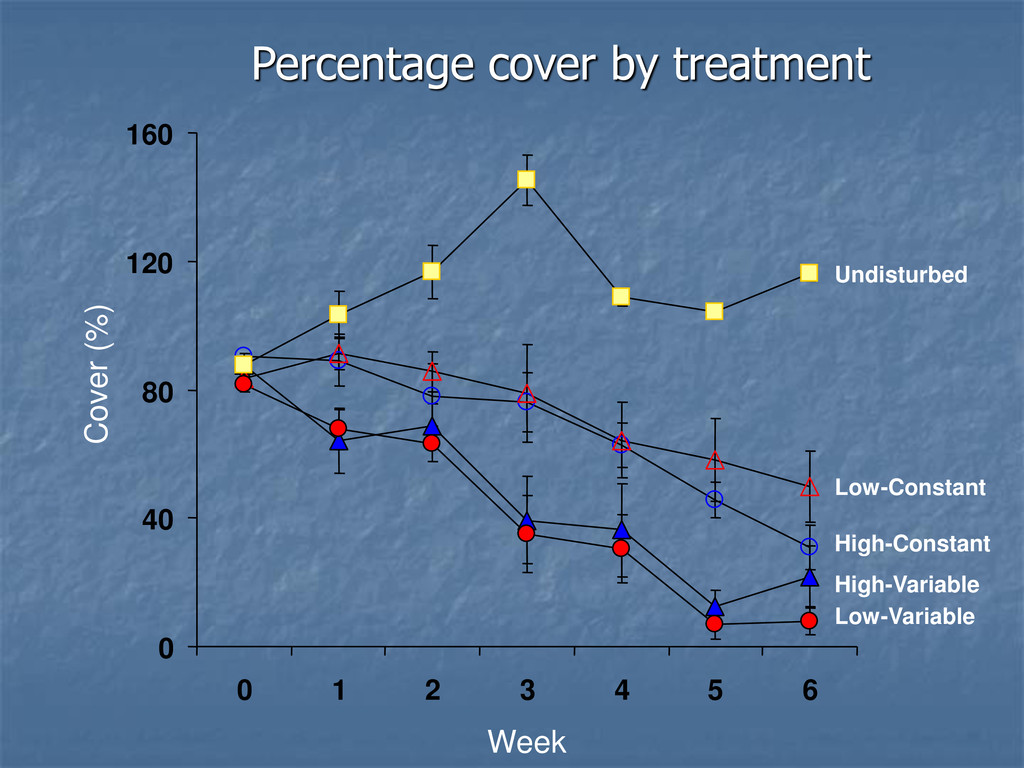
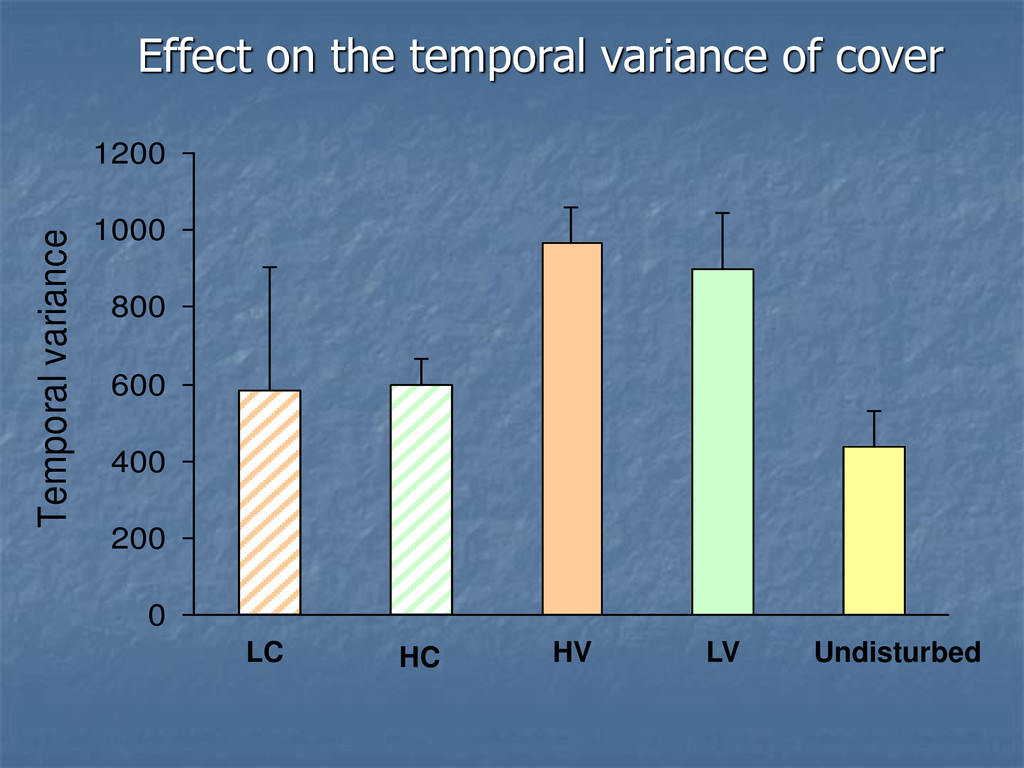
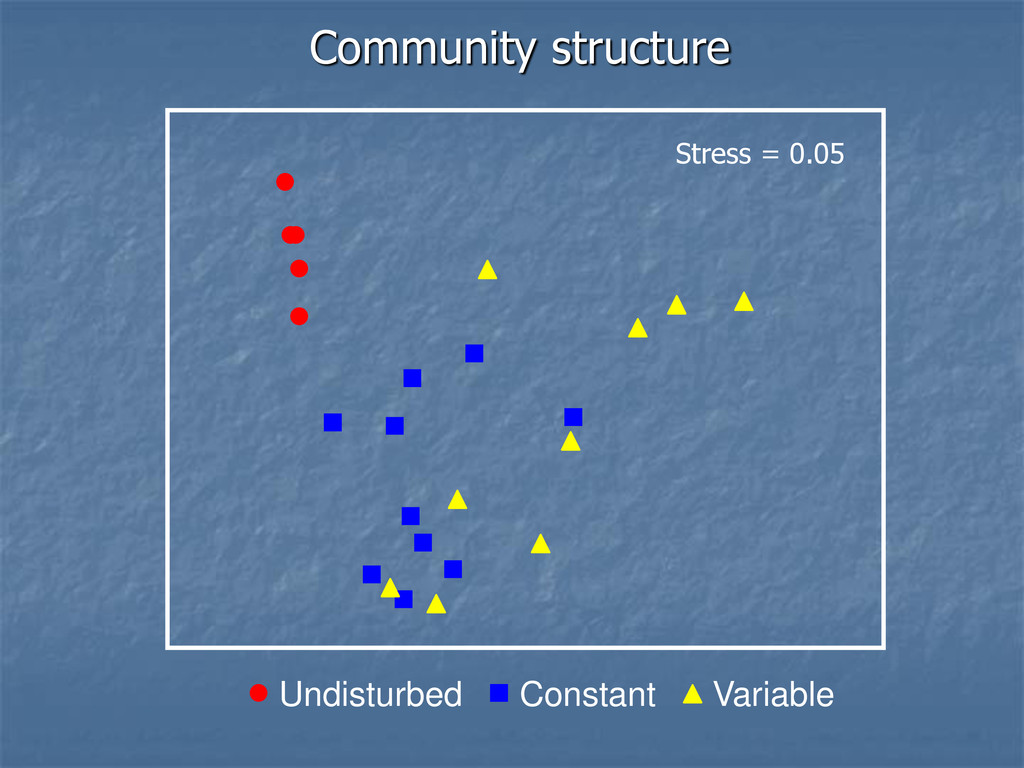
of temporal variability in disturbance No consistent effect of variability of physical disturbance Variable grazing regimes did change community structure Reduce percentage cover Increase temporal variance