Upgrade to Pro — share decks privately, control downloads, hide ads and more …

BLUE MUSSEL BIOFOULING ON NEW ZEALAND’SGREEN-LIPPED MUSSEL FARMS

jatalah
July 01, 2014

BLUE MUSSEL BIOFOULING ON NEW ZEALAND’SGREEN-LIPPED MUSSEL FARMS

17TH INTERNATIONAL CONGRESS ON MARINE CORROSION AND FOULING, SINGAPORE 2014

jatalah

July 01, 2014
Tweet

More Decks by jatalah

Other Decks in Science

Transcript

  1. BLUE MUSSEL BIOFOULING ON NEW ZEALAND’S GREEN-LIPPED MUSSEL FARMS JAVIER

    ATALAH, GRANT HOPKINS AND BARRIE FORREST CAWTHRON INSTITUTE, NEW ZEALAND 17TH INTERNATIONAL CONGRESS ON MARINE CORROSION AND FOULING 10TH JULY 2014
  2. NEW ZEALAND'S GREEN MUSSEL AQUACULTURE • The most important aquaculture

    sector $US218M pa (73% of NZ aquaculture revenue) • The Marlborough Sounds the largest farming area • Reliant on wild caught juveniles (spat)
  3. BIOFOULING AND THE MUSSEL INDUSTRY • Significant threat to the

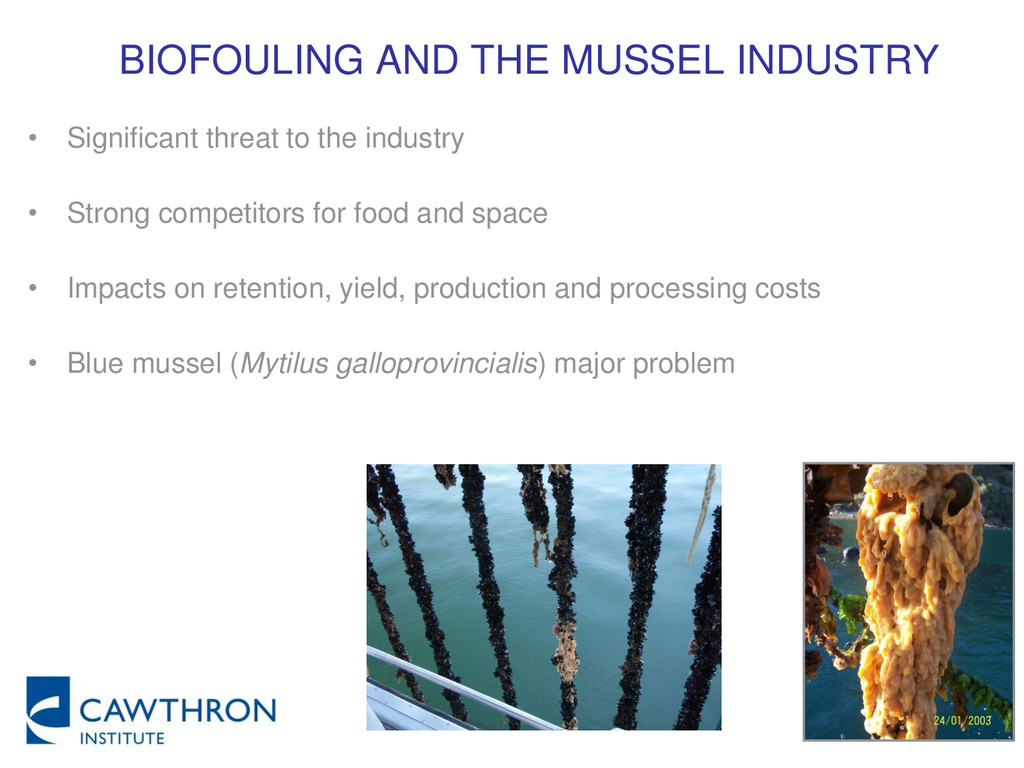
    industry • Strong competitors for food and space • Impacts on retention, yield, production and processing costs • Blue mussel (Mytilus galloprovincialis) major problem
  4. RATIONALE AND OBJECTIVES • Few management options available • Considerable

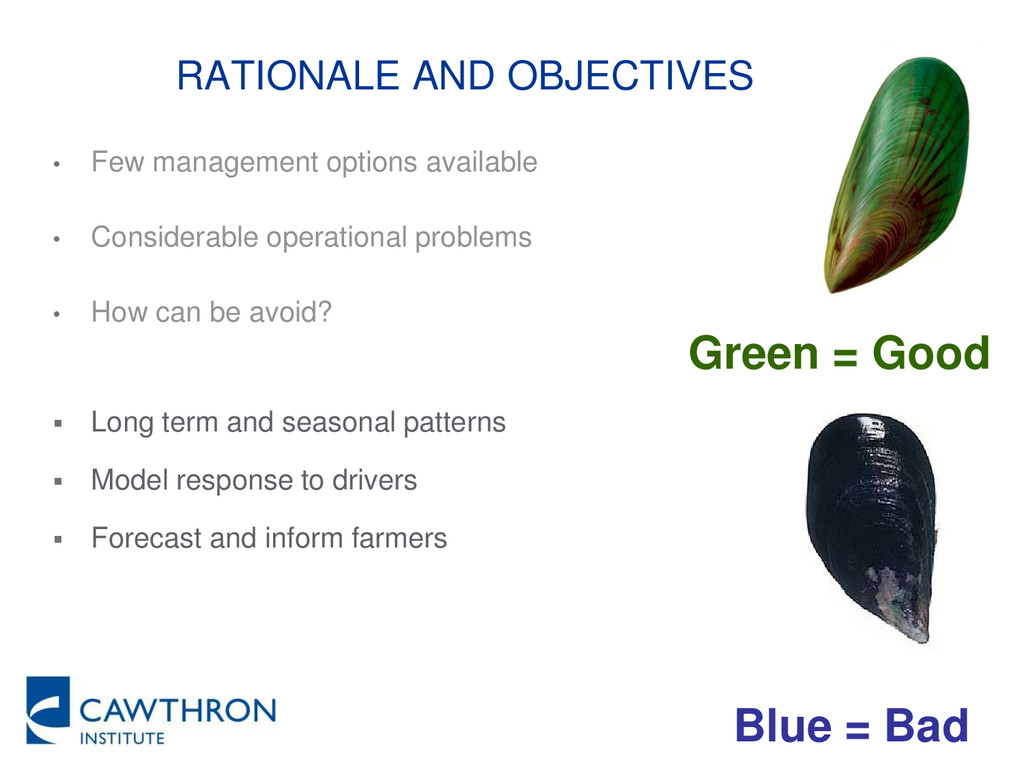
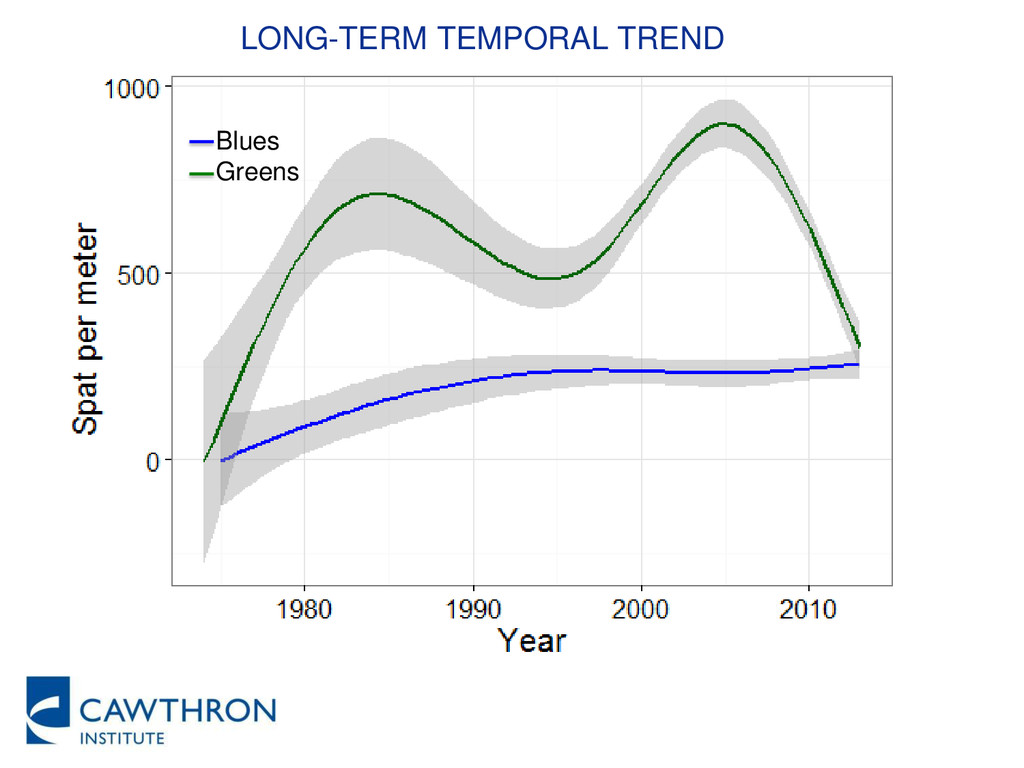
    operational problems • How can be avoid?  Long term and seasonal patterns  Model response to drivers  Forecast and inform farmers Blue = Bad Green = Good
  5. METHODS  Blue and green spat monitoring ~40 yr 

    Collector rope deployed for 2 wk  2, 4, 10 and 15 m depth  Overall >50 sites  Environmental data: temperature, salinity, chl-a, Southern Oscillation Index (SOI)
  6. ANALYSES  Generalised Additive Mixed Modelling (GAMM): Temporal trends: long

    term and seasonal components log() = + () + ℎ + Environmental drivers: log = + ℎ + () + + + ℎ + , +
  7. ENVIRONMENTAL DRIVERS MODELS 34% Blue =⁡ (ℎ )+ ℎ+()+ ()+

    (, )+() 41.3% Green = ()+(ℎ )+ (, )+ ()+()+ℎ
  8. -41.3 -41.2 -41.1 -41.0 -40.9 173.8 173.9 174.0 174.1 Longitude

    Latitute median.Mytilus 0 50 100 150 200 250 Blue mussel spat historical (1974-2013) median abundance -41.3 -41.2 -41.1 -41.0 -40.9 173.8 173.9 174.0 174.1 Longitude Latitute median.Perna 0 100 200 300 Perna spat historical (1974-2013) median abundance FORECAST SPAT CATCHES
  9. SUMMARY • Blues increased steadily over time • Large fluctuations

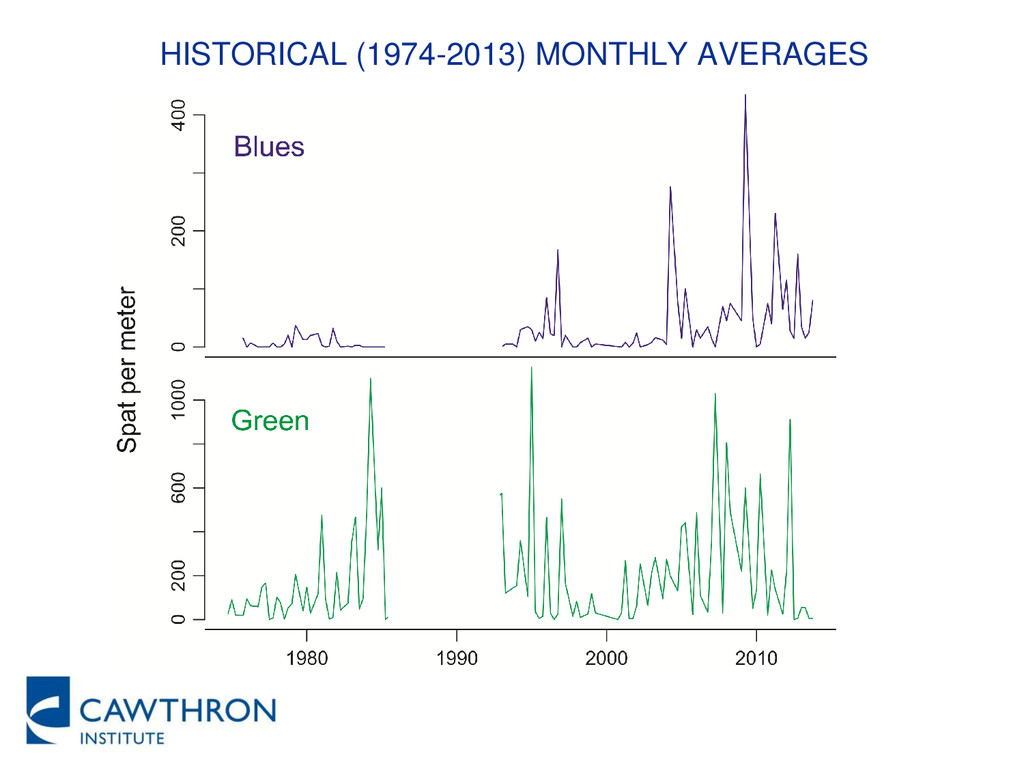
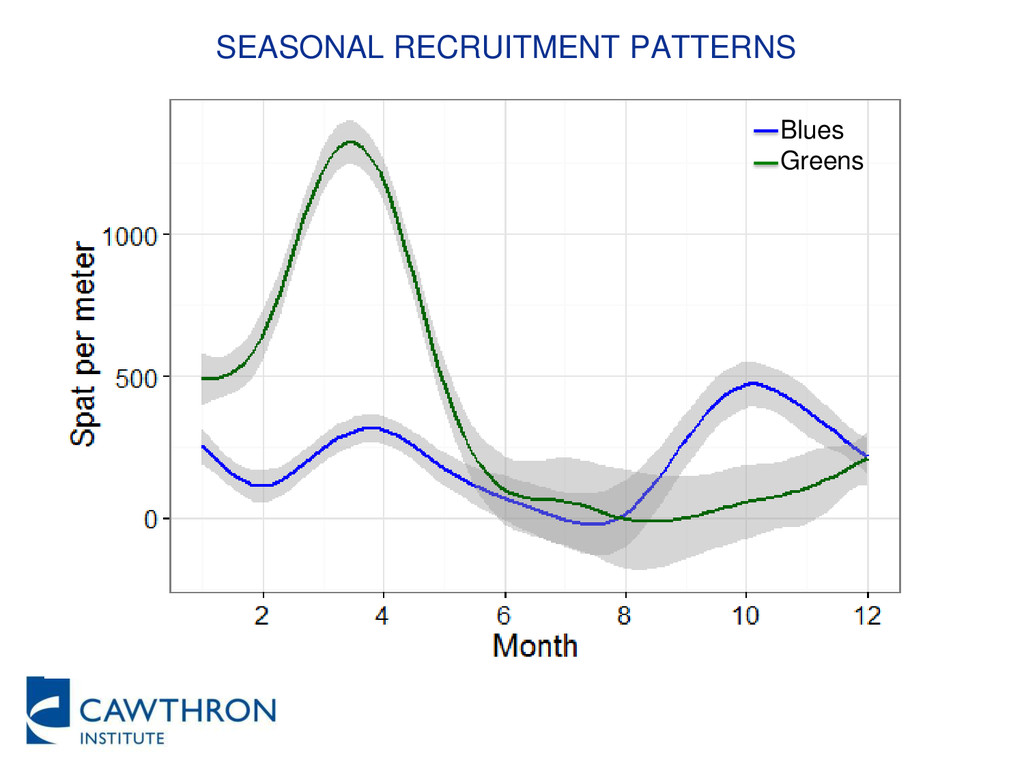
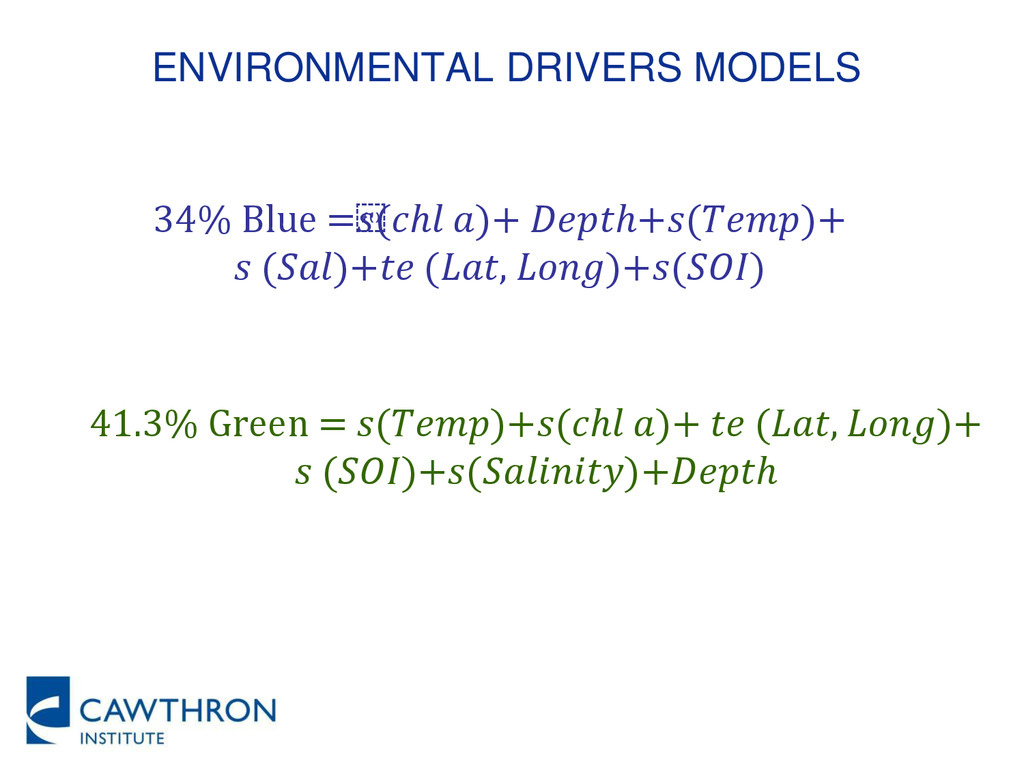
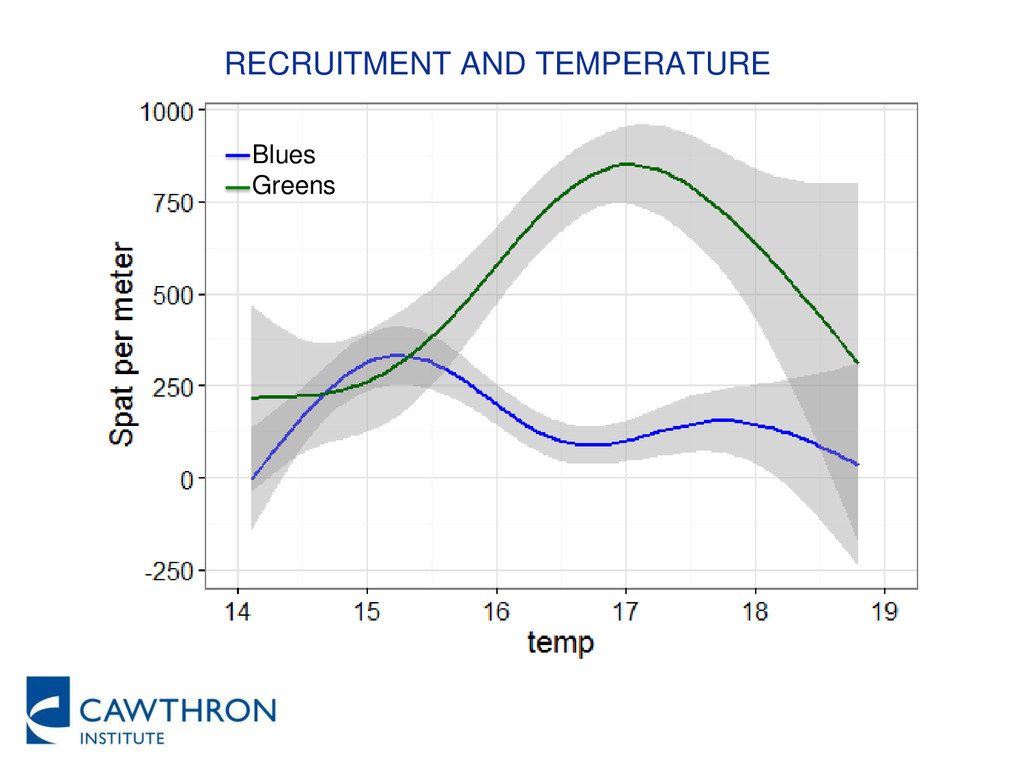
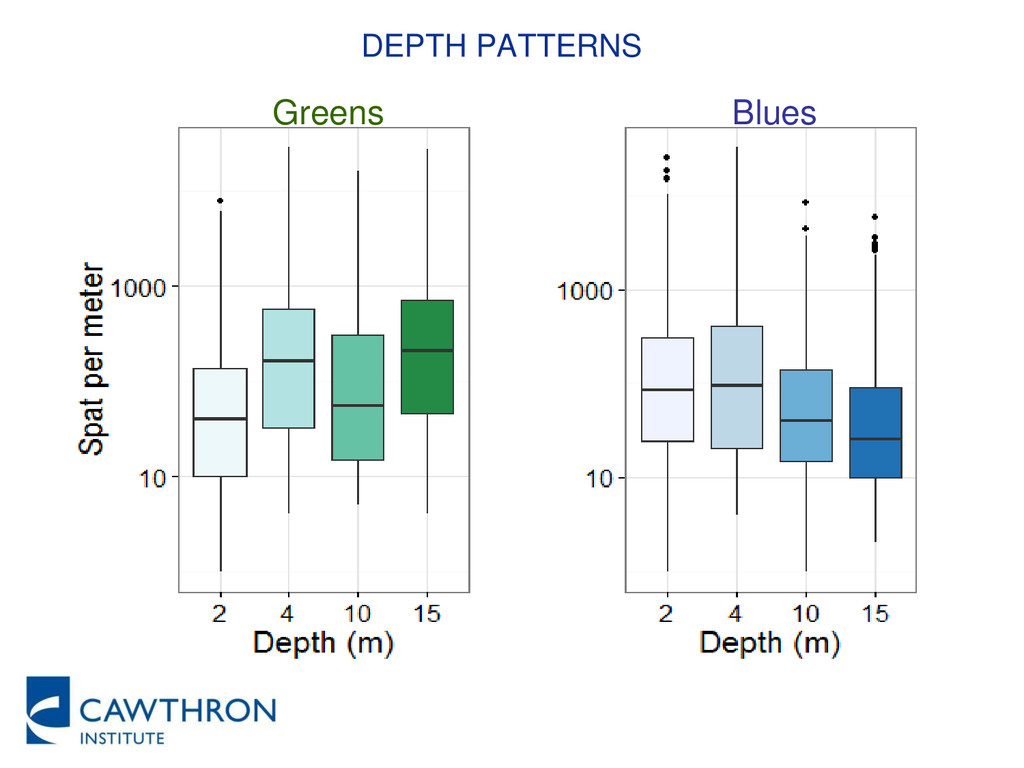
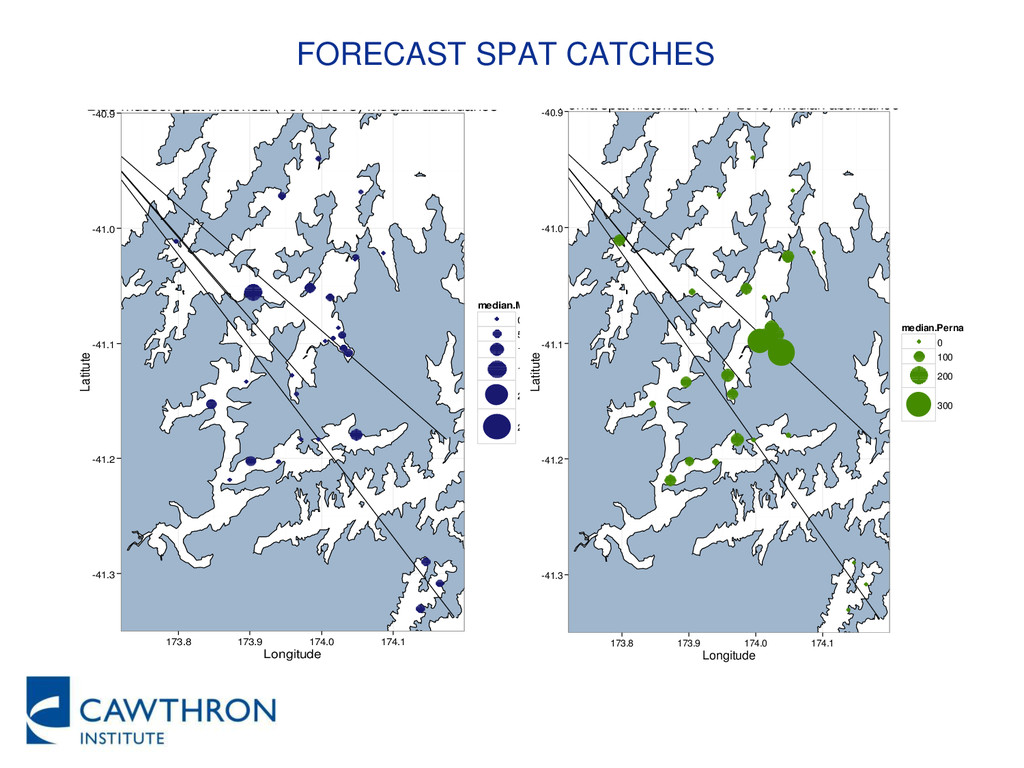
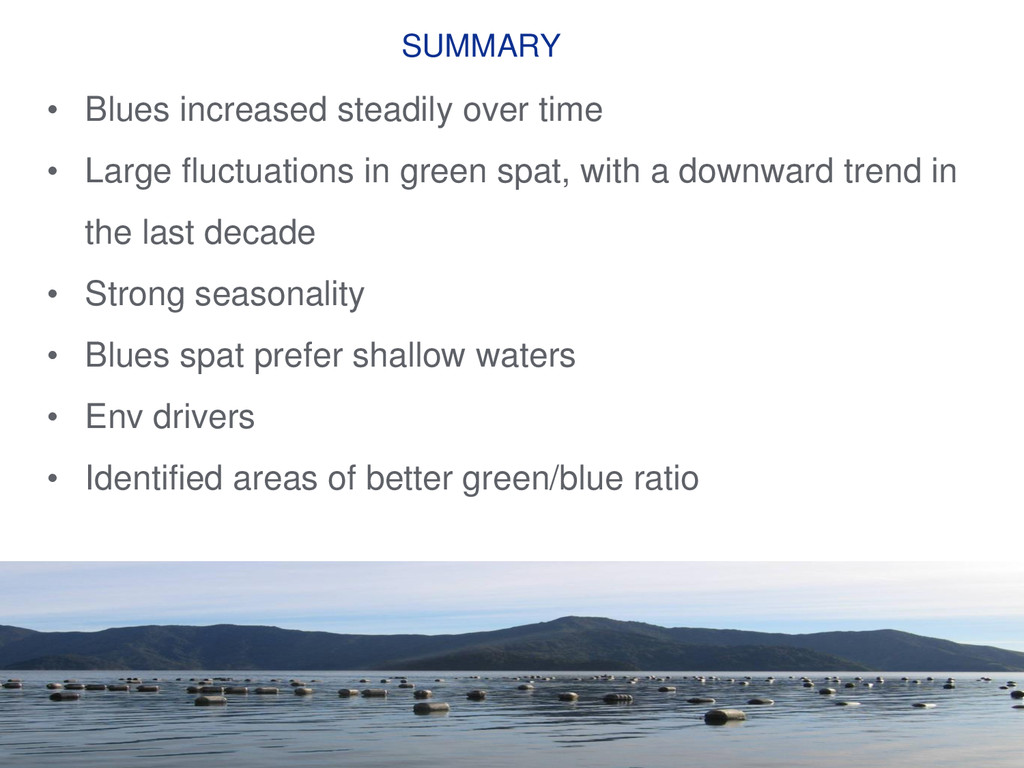
    in green spat, with a downward trend in the last decade • Strong seasonality • Blues spat prefer shallow waters • Env drivers • Identified areas of better green/blue ratio
  10. FUTURE WORK • Analyse data from two additional areas •

    Incorporate other drivers (e.g. rainfall, exposure level, turbidity, farm density, etc.) • Make information available to mussel farmers as means through a web application
  11. ACKNOWLEDGEMENTS Marine Farming Association Jim Jenkins 40 years of lab

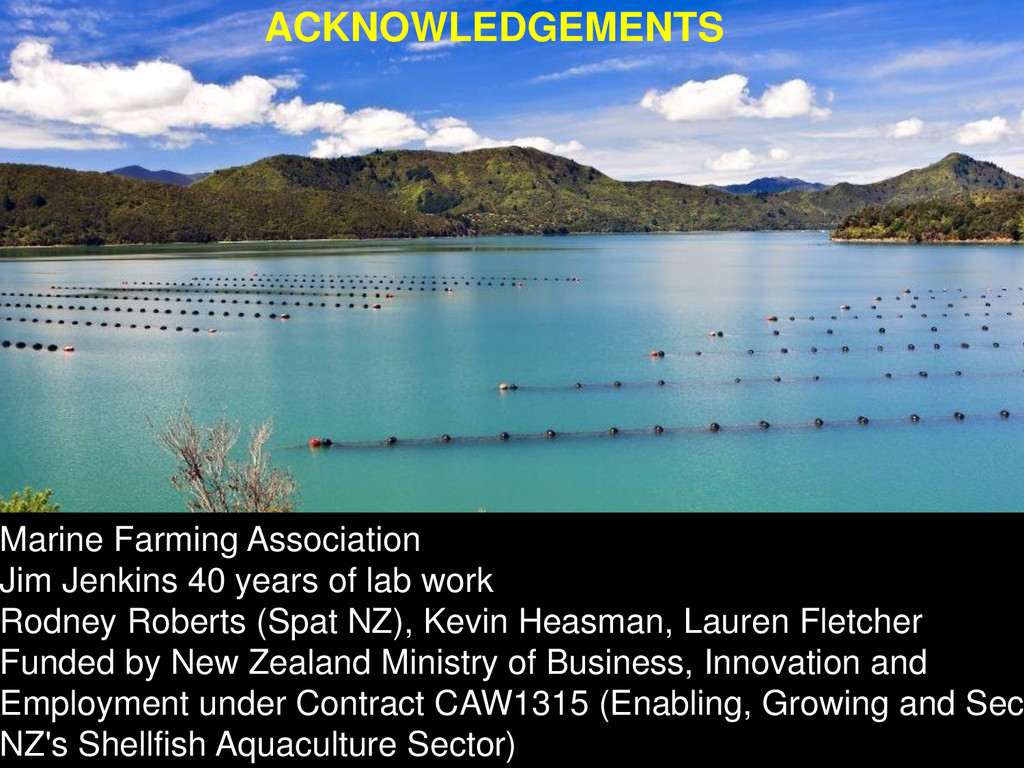
    work Rodney Roberts (Spat NZ), Kevin Heasman, Lauren Fletcher Funded by New Zealand Ministry of Business, Innovation and Employment under Contract CAW1315 (Enabling, Growing and Sec NZ's Shellfish Aquaculture Sector)