Upgrade to Pro — share decks privately, control downloads, hide ads and more …

Pollution as driver of biodiversity change

jatalah
March 24, 2007

Pollution as driver of biodiversity change

Talk at the postgraduate seminar University College Dublin, 2007

jatalah

March 24, 2007
Tweet

More Decks by jatalah

Other Decks in Science

Transcript

  1. Pollution as driver of biodiversity change: impacts, indicators and monitoring

    Javier Atalah, Tasman Crowe & Marie Kelly-Quinn Marine Biodiversity Ecology and Evolution (MarBEE) School of Biology and Environmental Science, UCD
  2. Outline 1. Impacts of pollution in rocky shores: using molluscan

    assemblages as bioindicators. 2. Macroinvertebrate assessment tools in lakes in relation to zebra mussel invasion. 3. Experimental approach: nutrients and sedimentation on rock pools.
  3. An integrated study encompassing a range of scales, taxa and

    habitats. Multi-disciplinary research framework to support national and local biodiversity policy in Ireland.
  4.  The Water Framework Directive requires consideration of the impacts

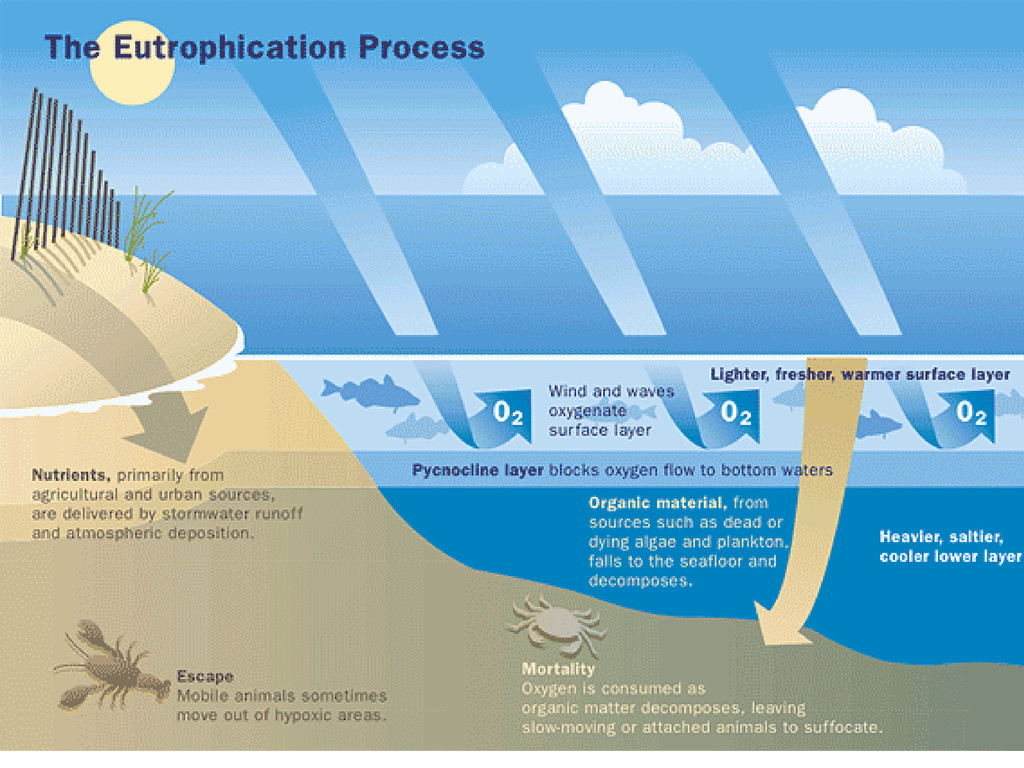
    of pollutants on biodiversity and the development of cost- effective tools to measure those impacts.  Nutrient enrichment, which can lead to eutrophication, is the focus of considerable management effort. Introduction
  5. I Pollution as a driver of biodiversity change in rocky

    shores: using molluscan assemblages as biomonitoring tool.
  6. We need… • Reliable indicators of ecological status. • e.g.

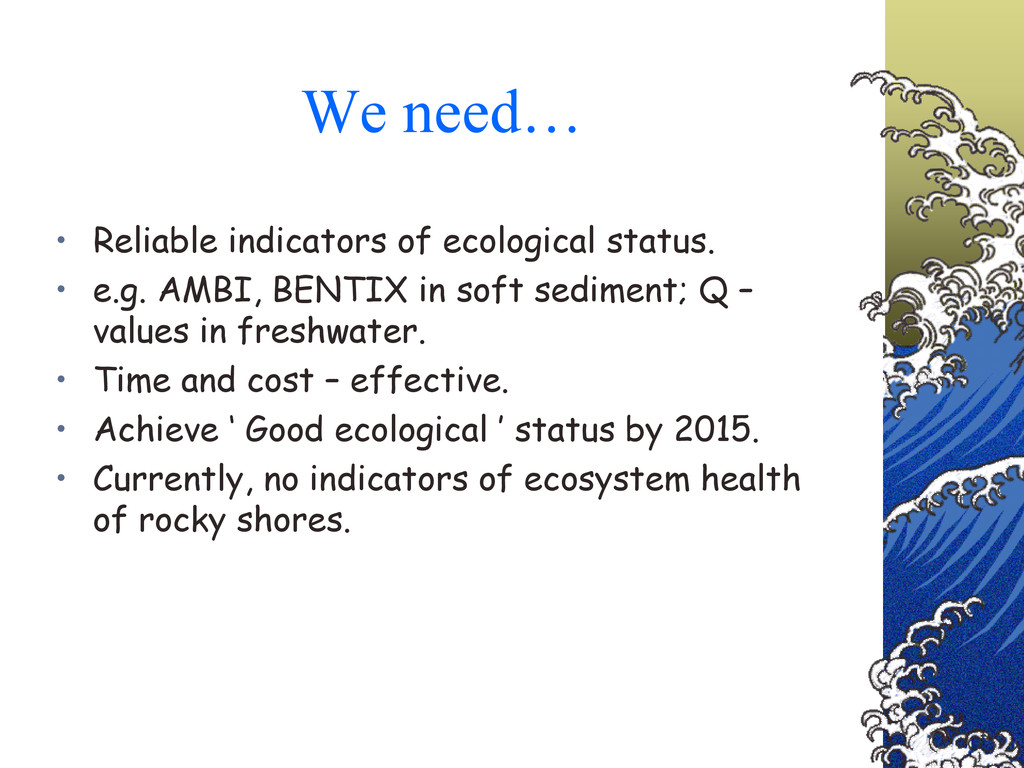
    AMBI, BENTIX in soft sediment; Q – values in freshwater. • Time and cost – effective. • Achieve ‘ Good ecological ’ status by 2015. • Currently, no indicators of ecosystem health of rocky shores.
  7. • Taxonomy, biology and ecology relatively well know in Europe.

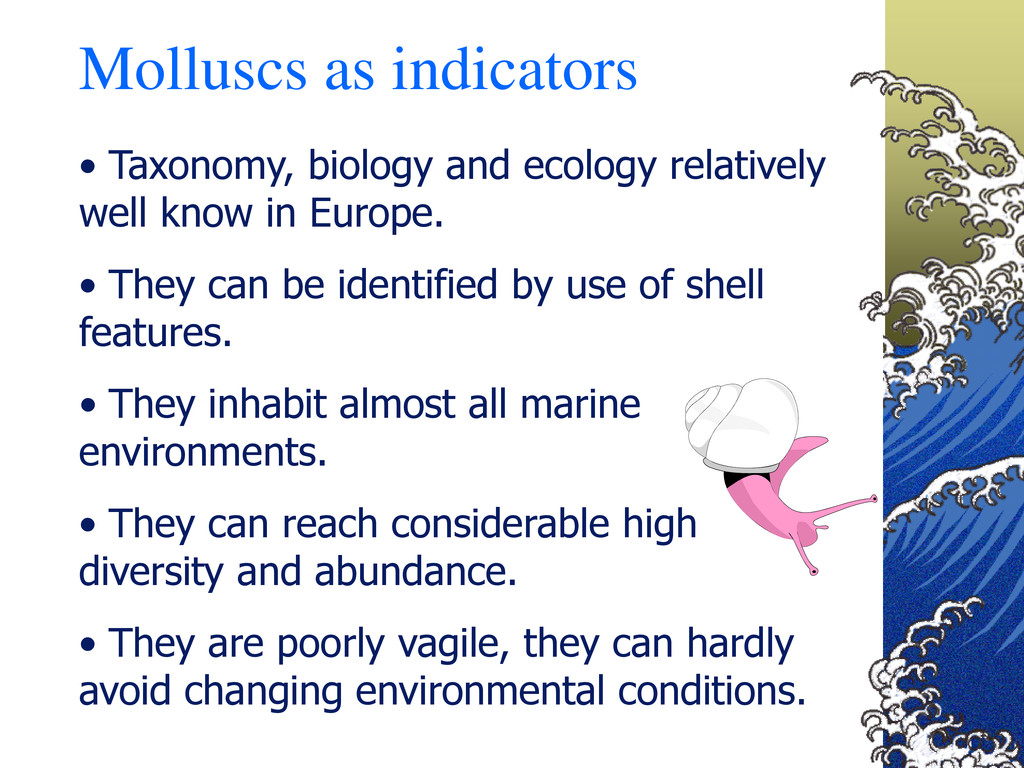
    • They can be identified by use of shell features. • They inhabit almost all marine environments. • They can reach considerable high diversity and abundance. • They are poorly vagile, they can hardly avoid changing environmental conditions. Molluscs as indicators
  8. Objectives a) Asses impacts of nutrient pollution driving biodiversity change

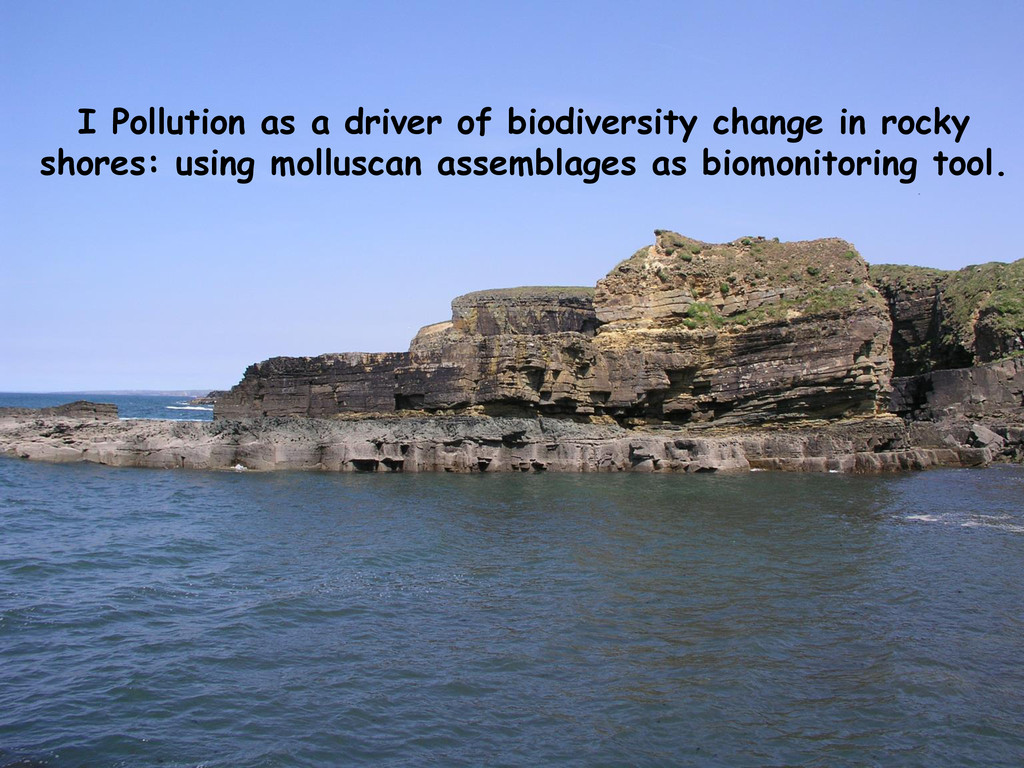
    in rocky shores. b) Test the effectiveness of intertidal molluscan assemblages as biomonitoring tool. c) Establish networks of sites for future strategic research. d) Develop a comprehensive biodiversity database. Pollution
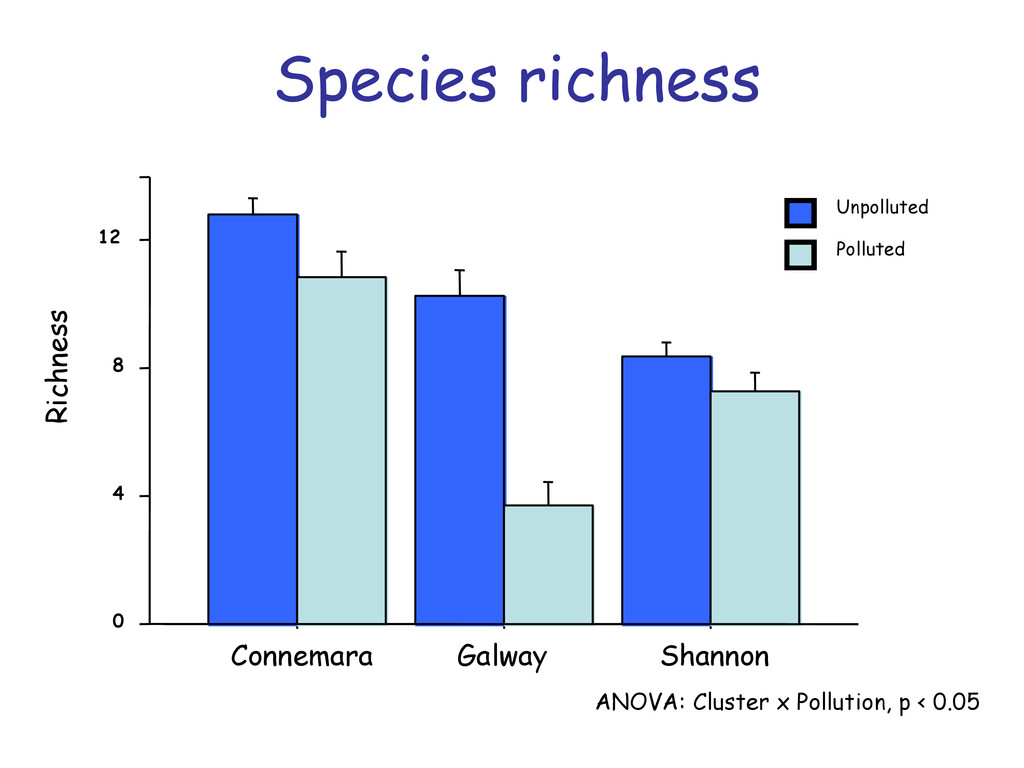
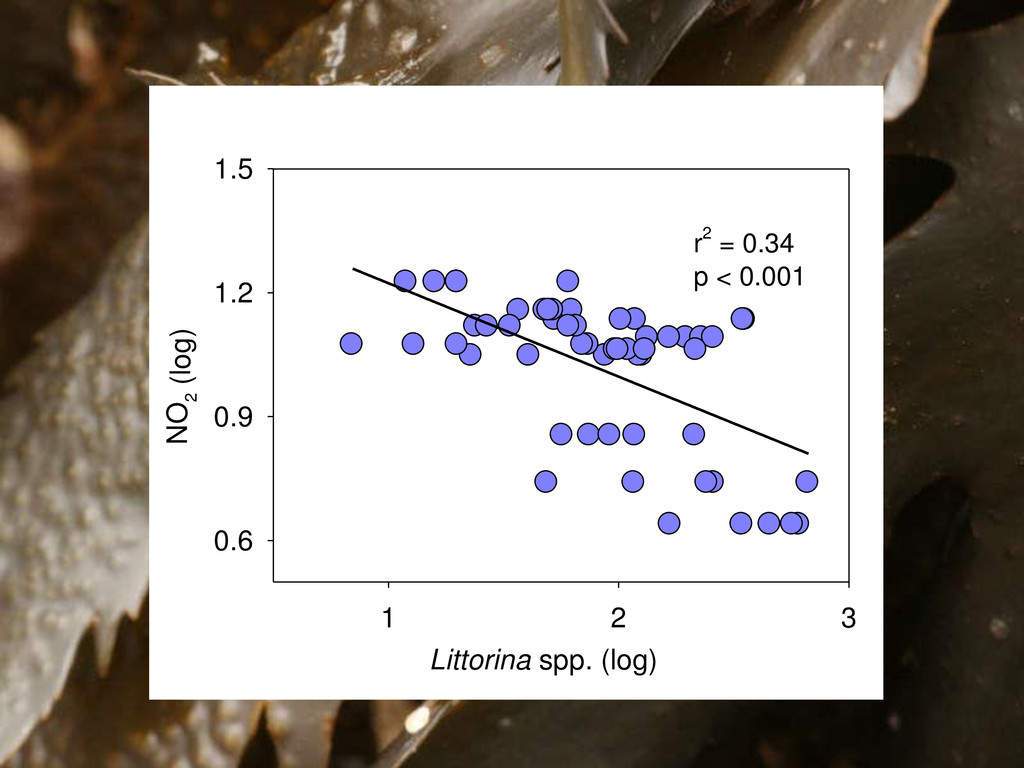
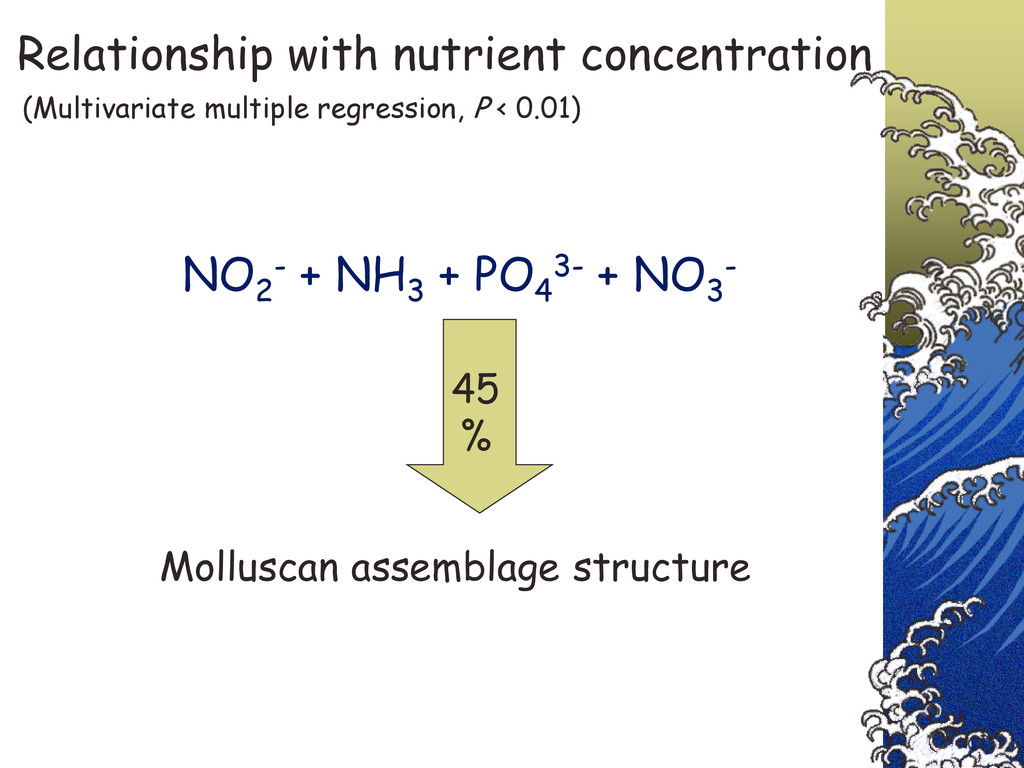
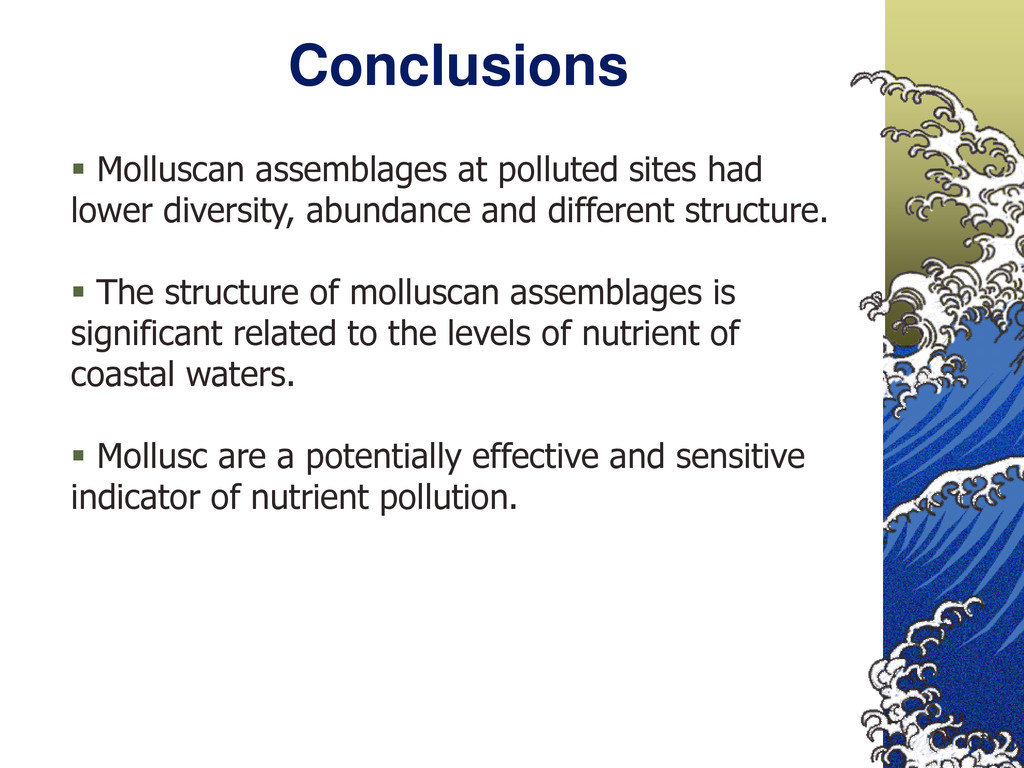
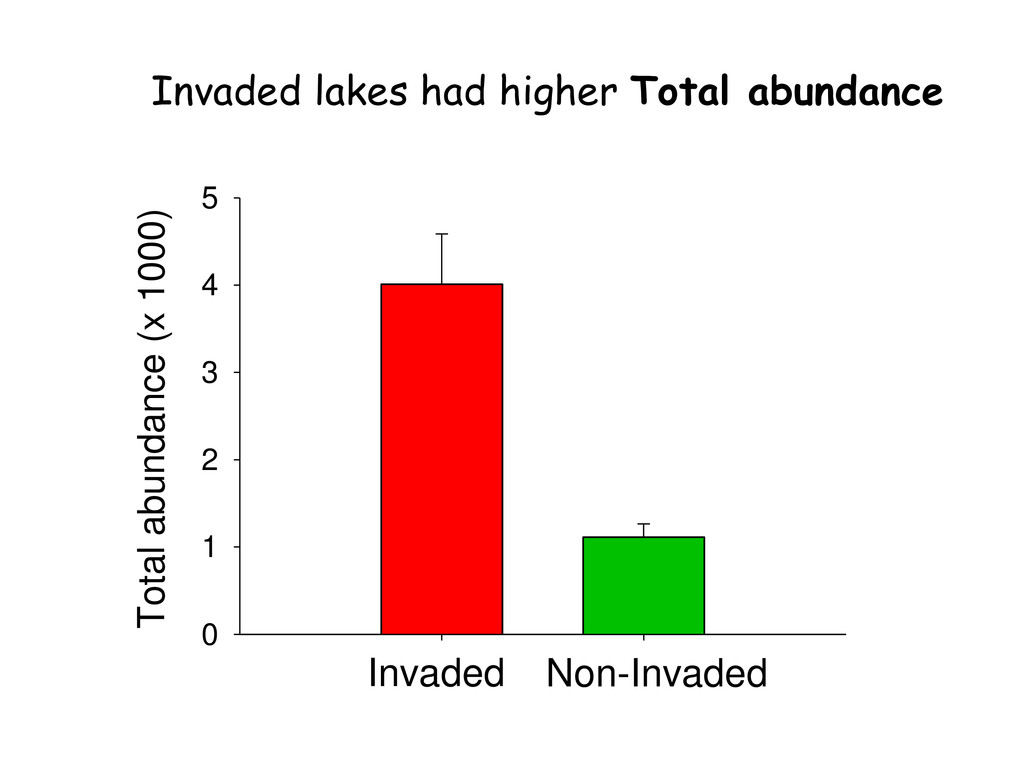
  9. Polluted & control interspersed Similar salinity & wave exposure Fenit

    Rinevella Corrigaholt Kilrush Parkmore Midden Rossaveel Renmore Galway Shannon - Tralee Renville Mutton Is. Connemara Mweenish Kilkieran Polluted Unpolluted Fenit Rinevella Corrigaholt Kilrush Parkmore Ballyhown Rossaveel Galway Galway Shannon - Tralee Renville Mutton Is. Connemara Connemara Mweenish Kilkieran Polluted Control Sites: polluted & control interspersed Similar salinity & wave exposure
  10.  Five quadrats per site  Molluscan assemblages identified 

    Nitrate, nitrite, phosphate, ammonia and chlorophyll-a measured. Methods
  11. 0 4 8 12 Richness Connemara Galway Shannon Polluted Unpolluted

    Species richness ANOVA: Cluster x Pollution, p < 0.05
  12. Total abundance 0 2 4 6 Total abundance (ln) Connemara

    Galway Shannon Polluted Unpolluted ANOVA: Pollution, p < 0.05
  13. Community Structure -40 -20 0 20 40 PCO1 (42.8%) -40

    -20 0 20 40 Polluted Control Bittium reticulatum Brachystomia rissoides Gibbula cineraria Gibbula umbilicalis Hellicum pellucidum Lacuna pallidula Lacuna vincta Littorina littorea Littorina sp. Musculus sp. Nucella lapillus Rissoa lilacina Rissoa parva PCO 2 (19.3%) PERMANOVA: Pollution, p < 0.05
  14. Littorina spp. (log) 1 2 3 Total abundance (log) 1

    2 3 r2 = 0.59 p < 0.0001 Littorina spp. (log) 1 2 3 NO 2 (log) 0.6 0.9 1.2 1.5 r2 = 0.34 p < 0.001
  15. NO 2 - + NH 3 + PO 4 3-

    + NO 3 - 45 % Molluscan assemblage structure Relationship with nutrient concentration (Multivariate multiple regression, P < 0.01)
  16. Conclusions  Molluscan assemblages at polluted sites had lower diversity,

    abundance and different structure.  The structure of molluscan assemblages is significant related to the levels of nutrient of coastal waters.  Mollusc are a potentially effective and sensitive indicator of nutrient pollution.
  17. Objectives • Test effects of eutrophication pressure and the invasion

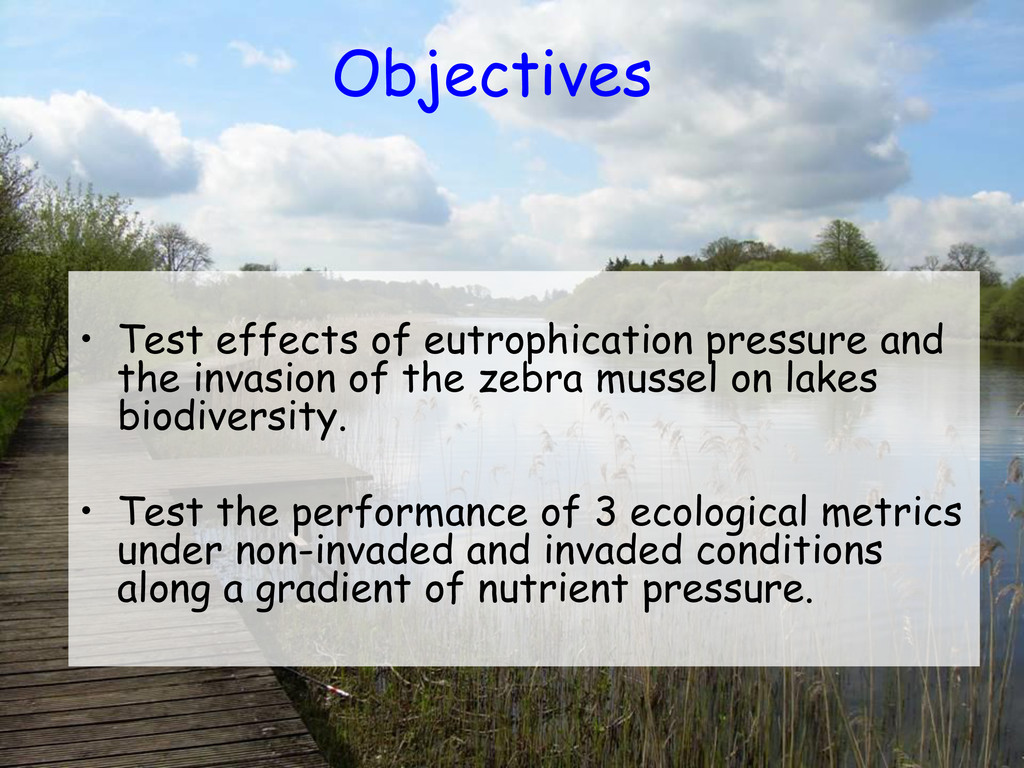
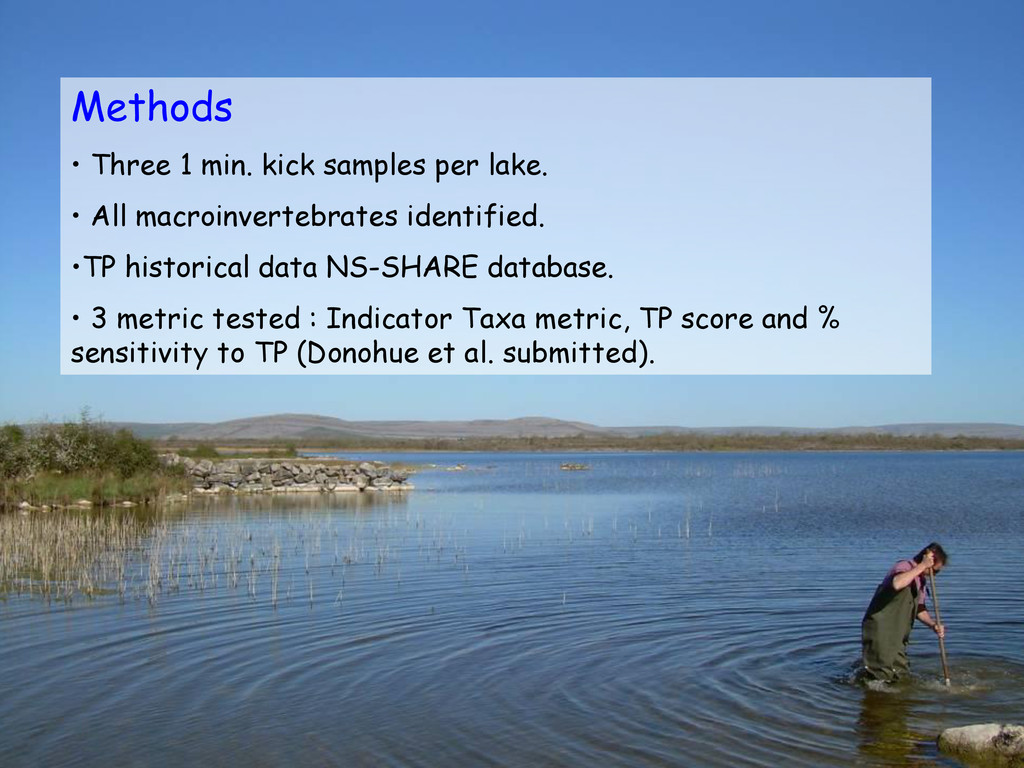
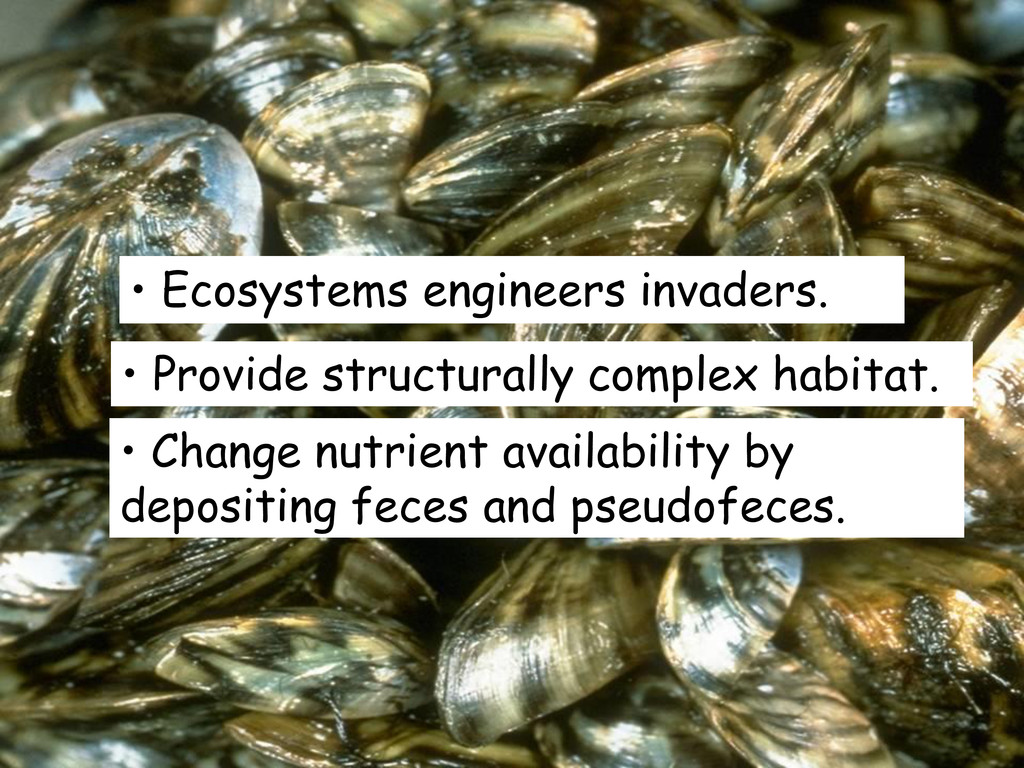
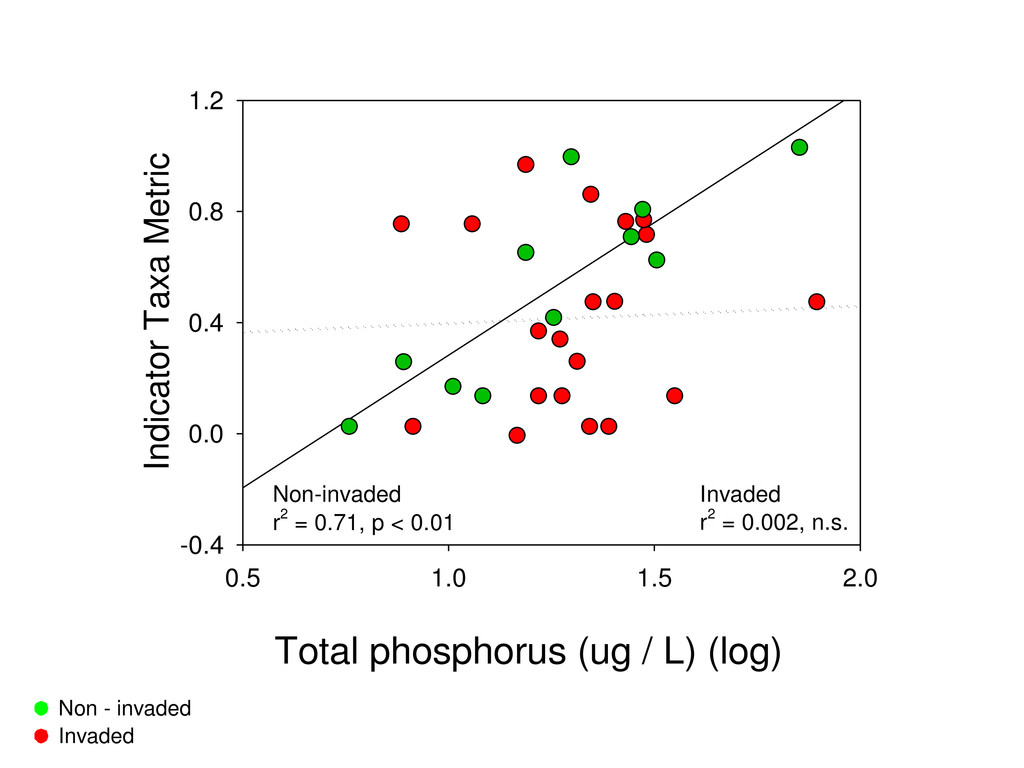
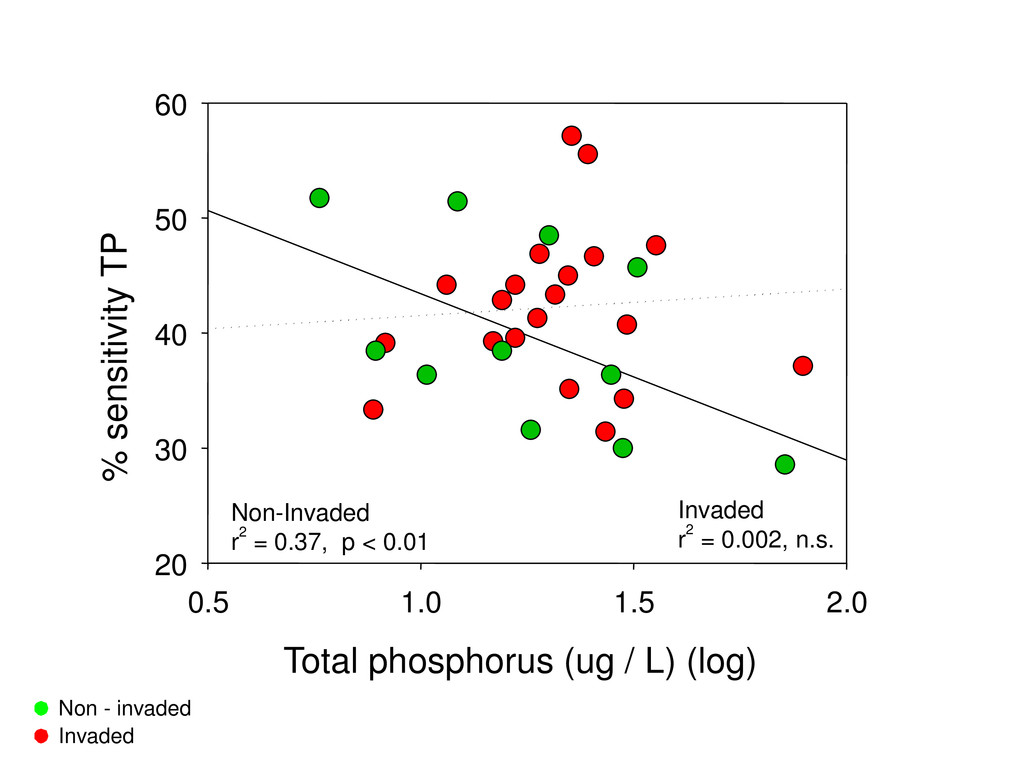
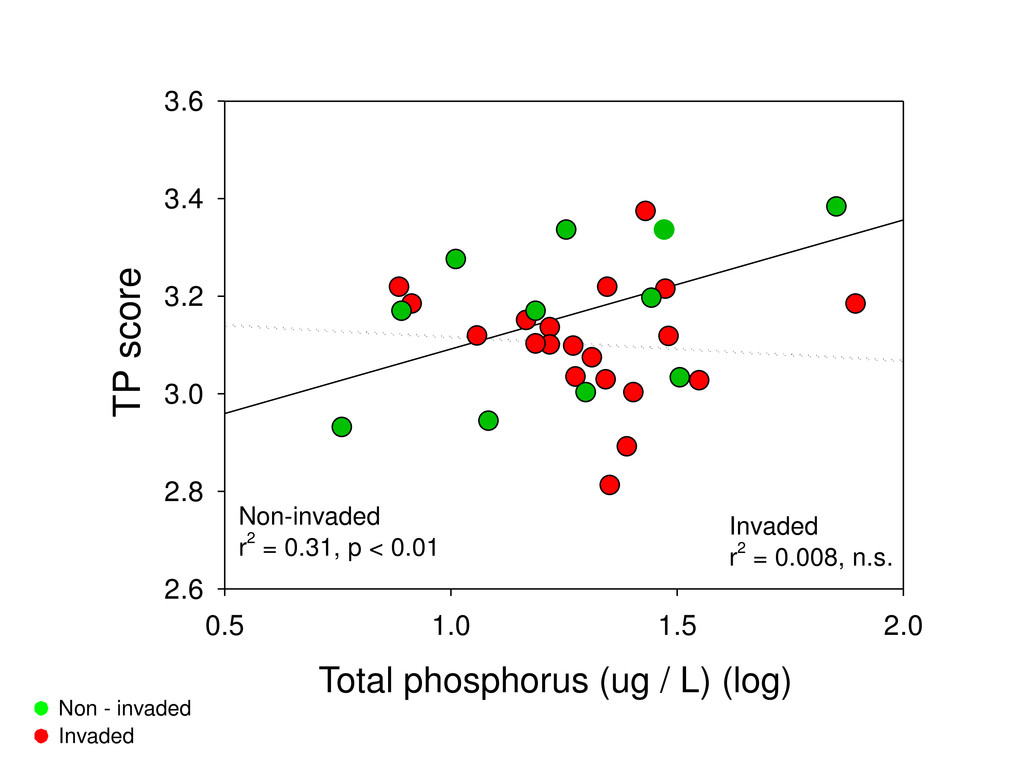
    of the zebra mussel on lakes biodiversity. • Test the performance of 3 ecological metrics under non-invaded and invaded conditions along a gradient of nutrient pressure.
  18. Methods • Three 1 min. kick samples per lake. •

    All macroinvertebrates identified. •TP historical data NS-SHARE database. • 3 metric tested : Indicator Taxa metric, TP score and % sensitivity to TP (Donohue et al. submitted).
  19. -60 -40 -20 0 20 40 60 PCO 1 (21.7

    %) -40 -20 0 20 40 60 None - invaded Invaded Asellus aquaticus Caenis luctuosa Pisidium/Sphaerium sp. Gammarus sp. Crangonyx pseudogracilis Oligochaete Community structure PCO 2 (13.5 %)
  20. 0 10 20 30 40 Number of taxa Non-Invaded Invaded

    Invaded lakes had higher mean Number of Taxa P < 0.01
  21. Total abundance (x 1000) 0 1 2 3 4 5

    Invaded Non-Invaded Invaded lakes had higher Total abundance
  22. • Ecosystems engineers invaders. • Provide structurally complex habitat. •

    Change nutrient availability by depositing feces and pseudofeces.
  23. Total phosphorus (ug / L) (log) Non - invaded Invaded

    0.5 1.0 1.5 2.0 Indicator Taxa Metric -0.4 0.0 0.4 0.8 1.2 Invaded r2 = 0.002, n.s. Non-invaded r2 = 0.71, p < 0.01
  24. Non - invaded Invaded Total phosphorus (ug / L) (log)

    0.5 1.0 1.5 2.0 % sensitivity TP 20 30 40 50 60 Invaded r 2 = 0.002, n.s. Non-Invaded r 2 = 0.37, p < 0.01
  25. 0.5 1.0 1.5 2.0 TP score 2.6 2.8 3.0 3.2

    3.4 3.6 Non-invaded r2 = 0.31, p < 0.01 Invaded r2 = 0.008, n.s. Non - invaded Invaded Total phosphorus (ug / L) (log)
  26. Conclusions • Drastic biodiversity changes associated to D. polymorpha invasion.

    • All metrics performance was affected by D. polymorpha. • Metrics need developed separately for invaded and non-invaded lakes.
  27. III: Effects of nutrients enrichment and sedimentation on rock pools

    biodiversity Objective: Experimentally test the combine effect of nutrients, sedimentation and loss of key species on rocky shore diversity.
  28. Experimental design II +G +G - G -G n =

    4 ++N +N -N ++S ++S ++S +S -S -S -S +S +S n = 4
  29. Stress = 0.11 After 3 months…. Crustose coralline algae Grazers

    “Sand loving” spp.: Corallina officinalis Red turfing algae Green ephemeral Red filamentous Sedimentation Ambient High Low
  30. 0 20 40 60 80 100 120 Ambient Grazing Reduced

    Grazing Green ephemeral algae Low Nutrients High Nutrients
  31. Preliminary findings  Sedimentation is an important driver macroalgal diversity

    change.  In rock pools top-down control (grazers) is more important than bottom-up control (nutrients).
  32. Acknowledgements  Thanks to Jenn, Letizia, Elaine, Orlaigh, Gus, Maria,

    Samuel, Edel for help on sample sorting and identification.  Cristina, Davidone, Judita, Maria B. and Jayne for their fieldwork help.  R. Cave (NUI Galway) and R. French for help on the water chemistry.  L. Scally and S. Waldren for BIOCHANGE project coordination.  Ken Irvine for comments, TP data and metrics MS.  EPA for funding and environmental data