as the Unit of Data Analysis, Management, and Release 30 April 2013 Prepared by Jawoo Koo ([email protected]) INTERNATIONAL FOOD POLICY RESEARCH INSTITUTE | WASHINGTON, DC
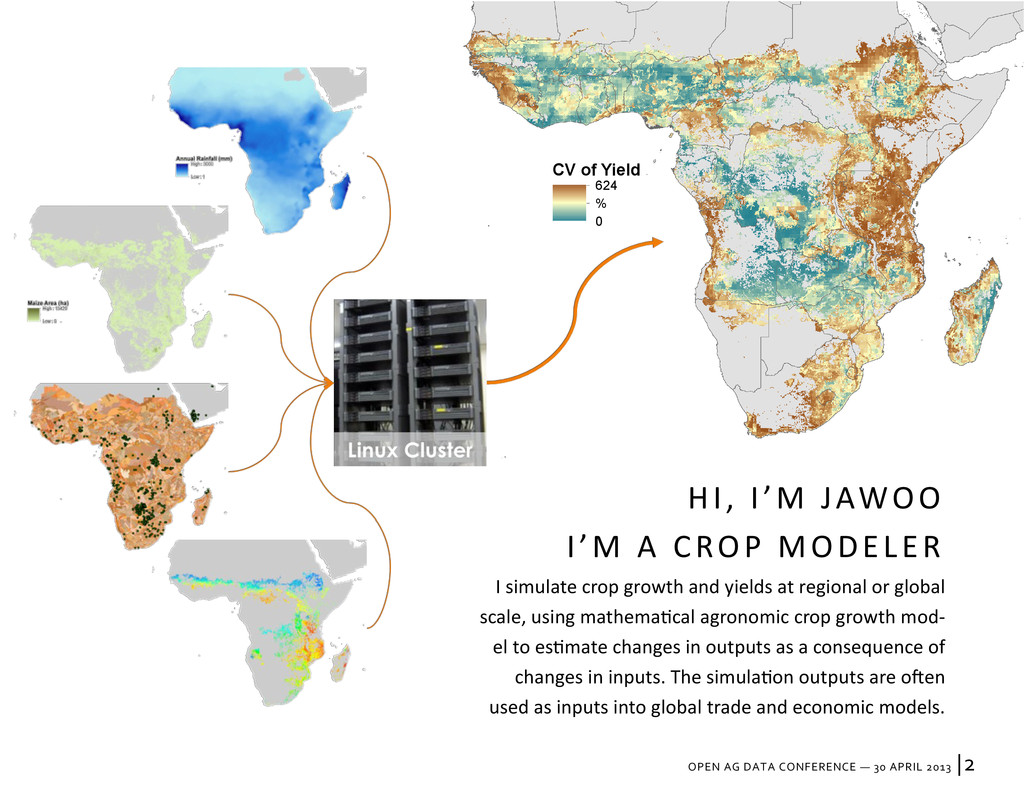
CV of Yield 624 % 0 HI, I’M JAWOO I’M A CROP MODELER I simulate crop growth and yields at regional or global scale, using mathematical agronomic crop growth mod- el to estimate changes in outputs as a consequence of changes in inputs. The simulation outputs are often used as inputs into global trade and economic models.
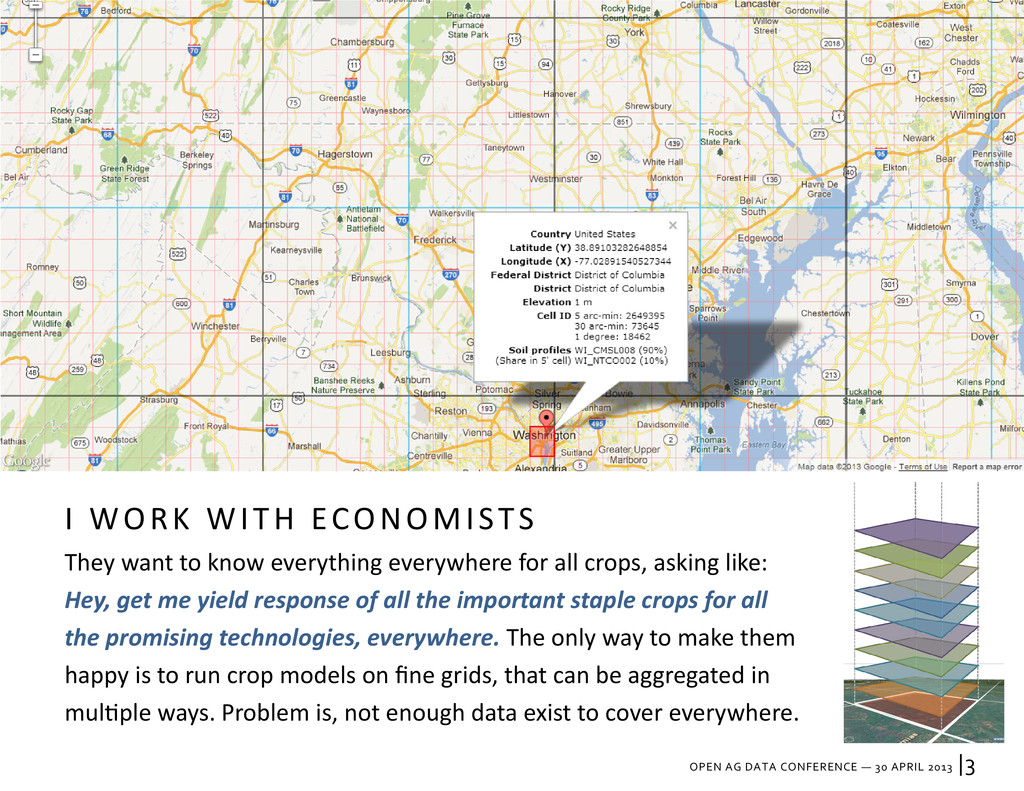
I WORK WITH ECONOMISTS They want to know everything everywhere for all crops, asking like: Hey, get me yield response of all the important staple crops for all the promising technologies, everywhere. The only way to make them happy is to run crop models on fine grids, that can be aggregated in multiple ways. Problem is, not enough data exist to cover everywhere.
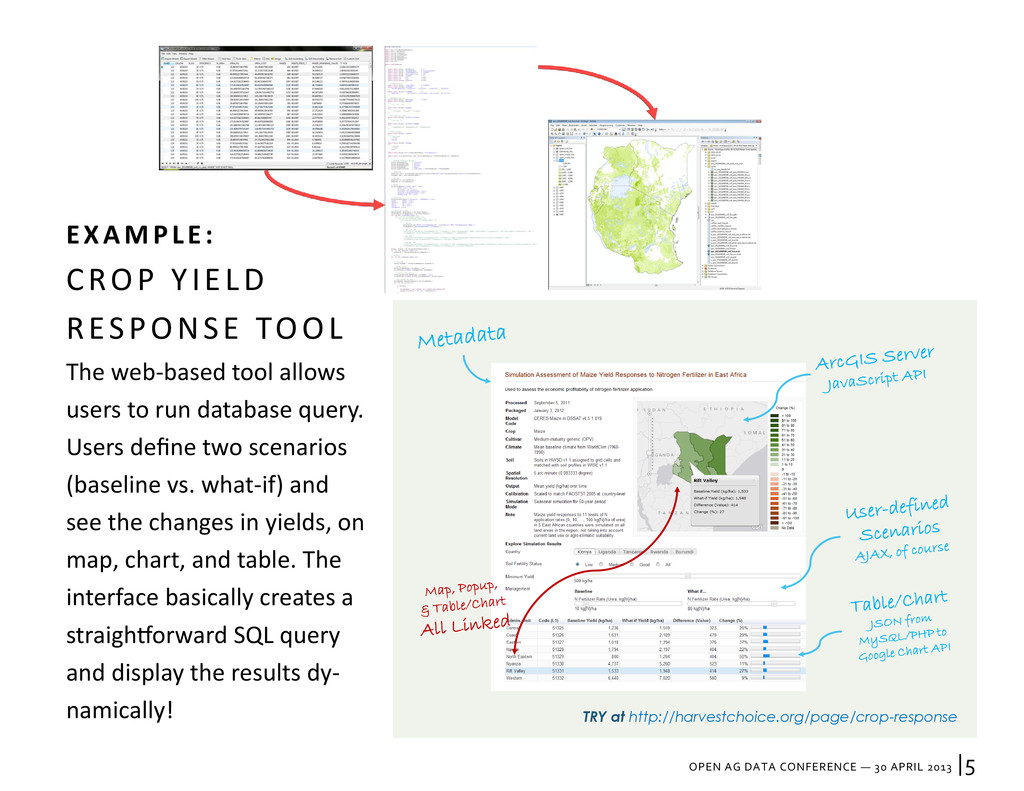
TRY at http://harvestchoice.org/page/crop-response EXAMPLE: CROP YIELD RESPONSE TOOL The web-based tool allows users to run database query. Users define two scenarios (baseline vs. what-if) and see the changes in yields, on map, chart, and table. The interface basically creates a straightforward SQL query and display the results dy- namically!
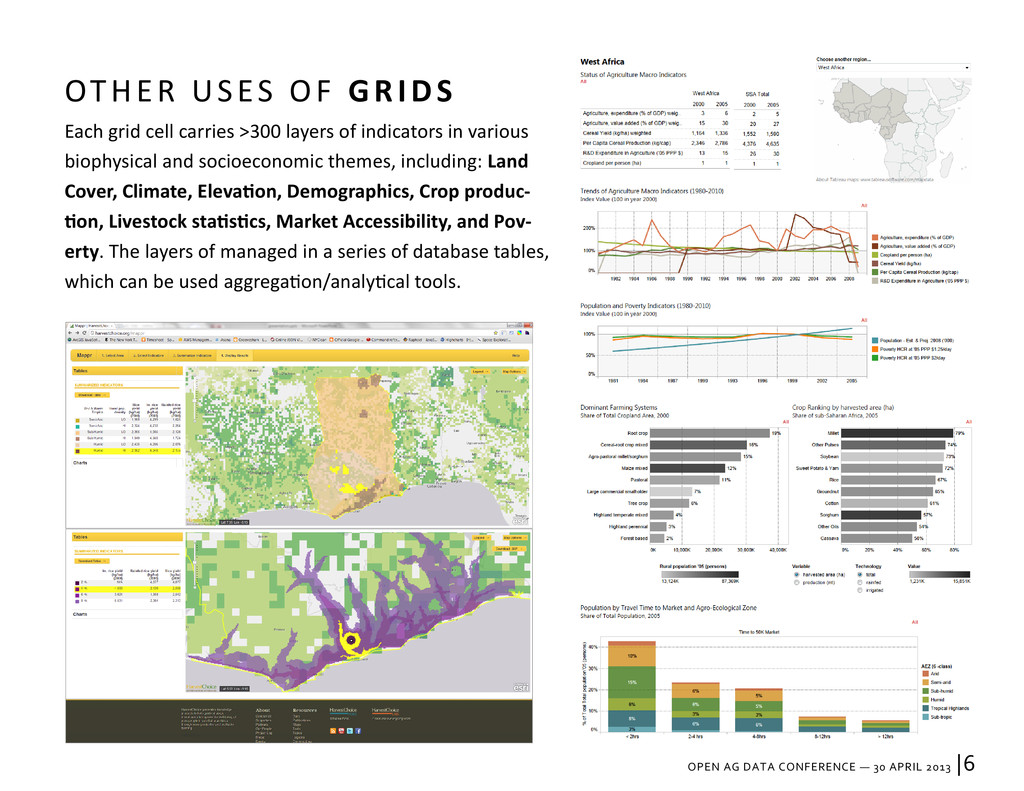
OTHER USES OF GRIDS Each grid cell carries >300 layers of indicators in various biophysical and socioeconomic themes, including: Land Cover, Climate, Elevation, Demographics, Crop produc- tion, Livestock statistics, Market Accessibility, and Pov- erty. The layers of managed in a series of database tables, which can be used aggregation/analytical tools.
IFPRI ifpri.org The International Food Policy Research Institute (IFPRI) seeks sustainable solutions for ending hunger and poverty. IFPRI is one of 15 centers supported by the Consultative Group on International Agricultural Research (CGIAR), an alliance of 64 governments, private foundations, and international and regional organizations. HarvestChoice harvestchoice.org HarvestChoice generates knowledge products to help guide strategic in- vestments to improve the well-being of poor people in sub-Saharan Africa through more productive and profitable farming. To do this, a novel and spatially explicit evaluation framework is being developed and deployed. By design, primary knowledge products are currently targeted to the needs of investors, policymakers and program managers, as well as the analysts and tech- nical specialists who support them. Most decisions that HarvestChoice targets are those having implications that cut across country bounda- ries. Mark Rosegrant / PI Jawoo Koo / Crop Modeling, Spatial Analysis Carlo Azzarri / Micro-economics, M&E Zhe Guo / GIS Coordinator, Spatial Analysis Ulrike Wood-Sichra / Database, Statistics Management Ivy Romero / Program Coordinator Cecile Martignac / Participatory GIS, Spatial Analysis Melanie Bacou / Economist Maria Comanescu / Developer Cindy Cox / Plant Pathology, Technical Writer Naomie Sakana / Farming Systems modeling Steve Kibet / Data Management in East Africa HARVESTCHOICE TEAM AT IFPRI