Upgrade to Pro — share decks privately, control downloads, hide ads and more …

Update: HarvestChoice and Global Futures 2012

Jawoo Koo
April 23, 2013

Update: HarvestChoice and Global Futures 2012

Presented at the Global Yield Gap Atlas Workshop at the Africa Rice HQ in Cotonou, Benin.

Jawoo Koo

April 23, 2013
Tweet

More Decks by Jawoo Koo

Other Decks in Research

Transcript

  1. GLOBAL YIELD GAP ATLAS WORKSHOP 2013 | UPDATES HARVESTCHOICE &

    GLOBAL FUTURES 23 April 2013 Prepared by Jawoo Koo ([email protected]) INTERNATIONAL FOOD POLICY RESEARCH INSTITUTE | WASHINGTON, DC
  2. GLOBAL YIELD GAP ATLAS 2013 — 23 APRIL 2013 |

    2 HarvestChoice Data Holdings Agro-ecology • Climate • Soil and water • Land cover and use • Agro-ecological domains Demography • Population • Income sources and poverty • Consumption • Nutrition Farming • Farm practices • Sub-national production • Input uses • Pests and diseases Productivity • Yield analysis • Adoption • Tech. evaluation • Spillovers • Profitability • Factor productivity Markets • Infrastructure and transportation • Market access • Value of production • Prices Investments • CGIAR CRP activities • CAADP CPP activities Who We Are, What We Do… Research program co-led by the International Food Policy Research Institute (IFPRI, CGIAR) and University of Minnesota.  We generate knowledge products to help guide strategic investments for more productive and profitable farming in sub-Saharan Africa.  We do this through: • Harmonized and geo-referenced datasets at administrative units down to 10-km grid • Analytics, modeling and data visualization tools • Flagship studies (livestock, productivity constraint analyses) Administrative Unit Cassava (ha) Groundnut (ha) Ashanti, Ghana 123,380 35 Nyanza, Kenya 33,238 12,821 Administrative Unit Livestock (TLU) Poverty ($1.25 - %) Eastern, Kenya 1,781,878 22.8 North Eastern, Kenya 896,120 45.4 Nyanza, Kenya 1,473,576 17.7 Rift Valley, Kenya 4,776,790 19.6
  3. GLOBAL YIELD GAP ATLAS 2013 — 23 APRIL 2013 |

    3 HARVESTCHOICEC GRIDS Each grid cell carries >300 layers of indicators in various biophysical and socioeconomic themes, including: Land Cover, Climate, Elevation, Demographics, Crop produc- tion, Livestock statistics, Market Accessibility, and Pov- erty. The layers of managed in a series of database tables, which can be used aggregation/analytical tools.
  4. GLOBAL YIELD GAP ATLAS 2013 — 23 APRIL 2013 |

    4 MODEL INPUT DATA GENERATED ON GRIDS BY MASHING-UP MULTI- PLE OPEN DATASETS Once everything is on the standard grids, I was able to utilize model output data in many interesting ways! A4 A3 A2 A1 A CELL A1 July 1980 - Rainfall 100 mm 12 x (daily rainfall pattern) for July at CELL A from POWER 1997: 68 mm 1998: 70 mm 1999: 80 mm 2000: 50 mm 2001: 60 mm 2002: 70 mm 2003: 80 mm 2004: 40 mm 2005: 95 mm 2006: 100 mm 2007: 80 mm 2008: 120 mm Use July 2006 daily weather at CELL A as July 1980 daily weather at CELL A1 WEATHER 1. Type (FAO 90) 2. Texture 3. Organic Carbon Content 4. pH 5. Water Availability *WI_PLMW001 WISE C 87 WISE DATABASE, SOIL MW001 @SITE COUNTRY LAT LONG SCS Family -99 Malawi -15.050 35.250 Eutric Planosol (PLe) @ SCOM SALB SLU1 SLDR SLRO SLNF SLPF SMHB SMPX SMKE G 0.13 11.52 0.25 73.00 1.00 1.00 SA001 SA001 SA001 @ SLB SLMH SLLL SDUL SSAT SRGF SSKS SBDM SLOC SLCL SLSI SLCF SLNI SLHW SLHB SCEC SADC 19 Ap 0.185 0.353 0.473 1.00 0.46 1.33 1.60 44.00 16.00 -99.0 0.14 6.10 -99.0 19.40 -99.0 48 B1 0.221 0.324 0.436 0.51 0.47 1.45 0.40 52.00 10.00 -99.0 0.04 6.80 -99.0 11.90 -99.0 72 B2 0.237 0.352 0.445 0.30 0.29 1.43 0.20 56.00 10.00 -99.0 0.02 8.30 -99.0 13.00 -99.0 87 B3 0.228 0.302 0.380 0.20 0.33 1.59 0.20 34.00 10.00 -99.0 0.02 8.80 -99.0 12.60 -99.0 @ SLB SLPX SLPT SLPO CACO3 SLAL SLFE SLMN SLBS SLPA SLPB SLKE SLMG SLNA SLSU SLEC SLCA 19 -99.0 -99.0 -99.0 -99.0 -99.0 -99.0 -99.0 72.0 -99.0 -99.0 0.2 3.8 0.3 -99.0 9.6 9.6 48 -99.0 -99.0 -99.0 -99.0 -99.0 -99.0 -99.0 91.0 -99.0 -99.0 0.9 3.6 0.2 -99.0 3.2 5.9 72 -99.0 -99.0 -99.0 -99.0 -99.0 -99.0 -99.0 100.0 -99.0 -99.0 0.4 6.7 0.2 -99.0 4.6 6.3 87 -99.0 -99.0 -99.0 -99.0 -99.0 -99.0 -99.0 100.0 -99.0 -99.0 0.4 4.2 0.2 -99.0 -99.0 9.9 PLAN B: HC27 (27 generic soil profiles for SSA; 3 texture x 3 fertility x 3 depth) MISSION: FIND THE BEST MATCHING PROFILE FOR EACH SOIL IN HWSD 1.1
  5. GLOBAL YIELD GAP ATLAS 2013 — 23 APRIL 2013 |

    6 TRY at http://harvestchoice.org/page/crop-response EXAMPLE CROP YIELD RESPONSE TOOL The web-based tool allows users to run database query. Users define two scenarios (baseline vs. what-if) and see the changes in yields, on map, chart, and table. The interface basically creates a straightforward SQL query and display the results dy- namically!
  6. GLOBAL YIELD GAP ATLAS 2013 — 23 APRIL 2013 |

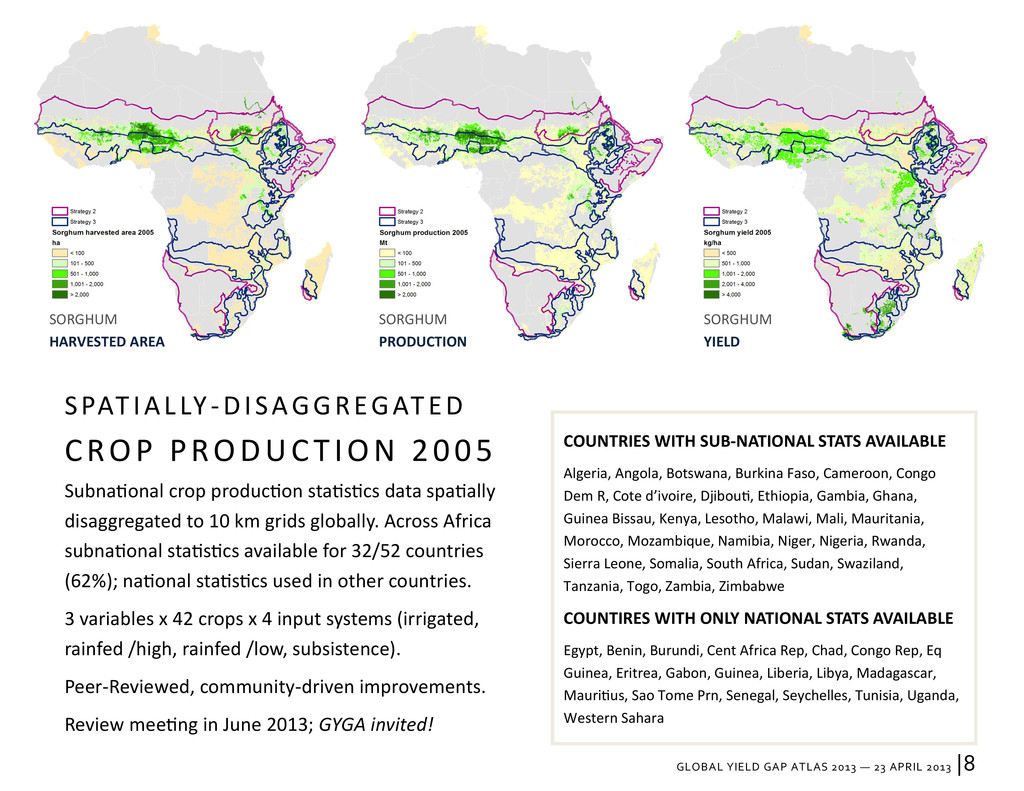
    8 SPATIALLY-DISAGGREGATED CROP PRODUCTION 2005 Subnational crop production statistics data spatially disaggregated to 10 km grids globally. Across Africa subnational statistics available for 32/52 countries (62%); national statistics used in other countries. 3 variables x 42 crops x 4 input systems (irrigated, rainfed /high, rainfed /low, subsistence). Peer-Reviewed, community-driven improvements. Review meeting in June 2013; GYGA invited! COUNTRIES WITH SUB-NATIONAL STATS AVAILABLE Algeria, Angola, Botswana, Burkina Faso, Cameroon, Congo Dem R, Cote d’ivoire, Djibouti, Ethiopia, Gambia, Ghana, Guinea Bissau, Kenya, Lesotho, Malawi, Mali, Mauritania, Morocco, Mozambique, Namibia, Niger, Nigeria, Rwanda, Sierra Leone, Somalia, South Africa, Sudan, Swaziland, Tanzania, Togo, Zambia, Zimbabwe COUNTIRES WITH ONLY NATIONAL STATS AVAILABLE Egypt, Benin, Burundi, Cent Africa Rep, Chad, Congo Rep, Eq Guinea, Eritrea, Gabon, Guinea, Liberia, Libya, Madagascar, Mauritius, Sao Tome Prn, Senegal, Seychelles, Tunisia, Uganda, Western Sahara SORGHUM HARVESTED AREA SORGHUM PRODUCTION SORGHUM YIELD
  7. GLOBAL YIELD GAP ATLAS 2013 — 23 APRIL 2013 |

    10 ABSTRACT Stem rust caused by Puccinia graminis f. sp. tritici is a potentially devastating fungal disease that can kill wheat plants and small grain cereals but more typi- cally reduces foliage, root growth, and grain yields. After years of success in keeping the disease at bay, new virulent races have emerged, with the potential to infect much of the world's wheat. De- spite, or because of, the success of past research, these programs saw an even- tual rundown in support. We estimate global wheat losses over the past 50 years absent investments in research to limit impacts of stem rust and discuss how this can inform decisions about “right-sizing” research investments. Right-Sizing Stem-Rust Research. P. G. Pardey, J. M. Beddow, D. J. Kriticos, T. M. Hurley, R. F. Park, E. Duveiller, R. W. Sutherst, J. J. Burdon, and D. Hodson. Science 12 April 2013: 340 (6129), 147-148. [DOI:10.1126/science.122970]
  8. GLOBAL YIELD GAP ATLAS 2013 — 23 APRIL 2013 |

    11 IFPRI ifpri.org The International Food Policy Research Institute (IFPRI) seeks sustainable solutions for ending hunger and poverty. IFPRI is one of 15 centers supported by the Consultative Group on International Agricultural Research (CGIAR), an alliance of 64 governments, private foundations, and international and regional organizations. HarvestChoice harvestchoice.org HarvestChoice generates knowledge products to help guide strategic in- vestments to improve the well-being of poor people in sub-Saharan Africa through more productive and profitable farming. To do this, a novel and spatially explicit evaluation framework is being developed and deployed. By design, primary knowledge products are currently targeted to the needs of investors, policymakers and program managers, as well as the analysts and tech- nical specialists who support them. Most decisions that HarvestChoice targets are those having implications that cut across country bounda- ries. Mark Rosegrant / PI Jawoo Koo / Crop Modeling, Spatial Analysis Carlo Azzarri / Micro-economics, M&E Zhe Guo / GIS Coordinator, Spatial Analysis Ulrike Wood-Sichra / Database, Statistics Management Ivy Romero / Program Coordinator Cecile Martignac / Participatory GIS, Spatial Analysis Melanie Bacou / Economist Maria Comanescu / Developer Cindy Cox / Plant Pathology, Technical Writer Naomie Sakana / Farming Systems modeling Steve Kibet / Data Management in East Africa HARVESTCHOICE TEAM AT IFPRI
  9. GLOBAL YIELD GAP ATLAS 2013 — 23 APRIL 2013 |

    12 HARVESTCHOICE/INTENSIFICATION GLOBAL FUTURES/FORESIGHTING Analytical Focus Country. regional , and local scenarios on economic and environmental tradeoffs under alternative inten- sification scenarios Analytical Focus Global scenarios on food supply, demand, trade, pric- es, and malnutrition Focal Units Households, countries, regions, landscapes, policy op- tions Focal Units Countries, global markets, policy options Key Indicators Food security, income, energy use, GHG mitigation, ecosystem services, and natural resources Key Indicators Food demand/supply quantities, food prices, food trade flows, Kcal consumption, malnourishment rates Methods Integrated crop, land use, and economic modeling along spatial dimensions Methods Partial equilibrium global agri sector model linked to biophysical crop models Data SPAM data; finer spatial production allocation data; micro-level hh data from multiple sources; economic returns to crop/variety cultivation; economic returns and environmental impacts of technologies and prac- tices Data IMPACT data: 40 commodities; 115 geopolitical re- gions ; 115 country-level supply & demand eq’s; 126 river basins; data aggregated from SPAM Time Horizon Short- to medium-term (5-30 year) Time Horizon Medium to long-term (30-50 years)
  10. GLOBAL YIELD GAP ATLAS 2013 — 23 APRIL 2013 |

    13 GLOBAL FUTURES 2012/2013 The core analytical engine is the IMPACT model, which is being revised to incorporate higher spatial resolution, more biophysical elements, and welfare effects. Relevant pa- rameters and drivers of crop simulation models will be modified based on ex-ante evaluations of promising agricultural tech- nology interventions identified by CGIAR breeders and partners, with contributions from HarvestChoice. MODEL DEVELOPMENT A comprehensive suite of scenarios on key environ- mental and socio-economic drivers of global change were developed and simulated within IMPACT to examine potential technology improvements. The module that calculates the various returns on in- vestment measures was created and tested with the initial set of virtual crop coefficients. The ORYZA 2000 rice crop model was incorporated into the DSSAT crop modeling suite. MAIZE AND WHEAT A report on promising maize and wheat technolo- gies for the various maize and wheat production systems as well as papers on crop/system produc- tivity potential were completed. Compilation of the biophysical data on wheat was completed. An initial set of the spatial data for global biophysical and economic runs for wheat and maize were compiled and validation exercises to identify any additional data gaps are ongoing. Existing knowledge of maize and wheat systems across the developing world will be used to develop a suit of scenarios on the key environmental and socio-economic drivers of global change. Drought-tolerant wheat varieties were as- sessed for alternative technologies. RICE A study on “Opportunities for Global Rice Research
  11. GLOBAL YIELD GAP ATLAS 2013 — 23 APRIL 2013 |

    14 in a Changing World” and a journal article version of the study were completed. A report on “Ex Ante Im- pact Assessment of a Drought Tolerant Rice Variety in the Presence of Climate Change” was also com- pleted. The net yield gain of a virtual drought toler- ant rice variety was estimated using ORYZA2000 crop simulation model and IRRI Global Rice Model (IGRM). A paper on this study was presented at the Agricultural & Applied Economics Association (AAEA) conference in Seattle in August 2012 as well as submitted to the Applied Economics and Policy Perspective Journal. PEARL MILLET, SORGHUM, GROUNDNUT, CHICKPEA, AND PIGEON PEA A development and elucidation of the adoption process and the integration of the adoption path- way model into the IMPACT model was conducted. An application of this exercise was demonstrated in a case study presentation on “Evaluation of the im- pact of drought tolerant technology of sorghum us- ing the integrated IMPACT model.” The calibration of baseline cultivars of sorghum and groundnuts us- ing the DSSAT crop model for three different regions around the world was completed. The “virtual culti- vars” for drought tolerant, heat tolerant and high yield potential promising technologies for sorghum and groundnuts were also completed. The calibrat- ed crop model was used to assess the impact of cli- mate change on the yield of baseline cultivars as well as targeted promising technologies. LIVESTOCK Progress was made on the assessment of promising new technologies for livestock production systems, and the enhancement of the IMPACT model through the improvement of livestock demand and supply systems specification as well as on a report on promising interventions in livestock production systems, for eventual inclusion in an edited book and to provide inputs into the virtual crop/livestock management modeling system.
  12. GLOBAL YIELD GAP ATLAS 2013 — 23 APRIL 2013 |

    15 PLAN FOR 2013 2013 marks the end of the Global Futures project and the transition of its activities to an ongoing pro- gram under the auspices of the strategic foresight activity of the Policies, Institutions, and Markets re- search program (CRP2) of the CGIAR. The first part of the 2013 will be devoted to finaliza- tion of project deliverables, including a document on the potential new technologies identified by the participating centers, the assessment of a few of these technologies, and continued improvements in the modeling methodology. In particular, the IM- PACT suite of models is undergoing a major up- grade, including an update of its base year to 2005, adding all of the CGIAR mandate crops, increasing the spatial resolution both by breaking up regions into their constituent countries, and by increasing the number of production units (FPUs). There will also be major improvements in how wa- ter modeling is undertaken, both in a stand alone mode and incorporated into the economic model- ing. The second half of 2013 will be devoted to evalua- tion of more of the promising technologies identi- fied by the initial centers and addition of new tech- nologies as more centers are integrated into the program. These outputs, in particular, the metrics already developed to measure technology perfor- mance, will form an integral part of the CGIAR’s next Strategic Results Framework document.