Map Services and Viewers at NOAA's National Geophysical Data Center
An overview of interactive maps, cartographic products, and services at NOAA/NGDC. Presented at NACIS 2013 by Jesse Varner, CIRES/University of Colorado.
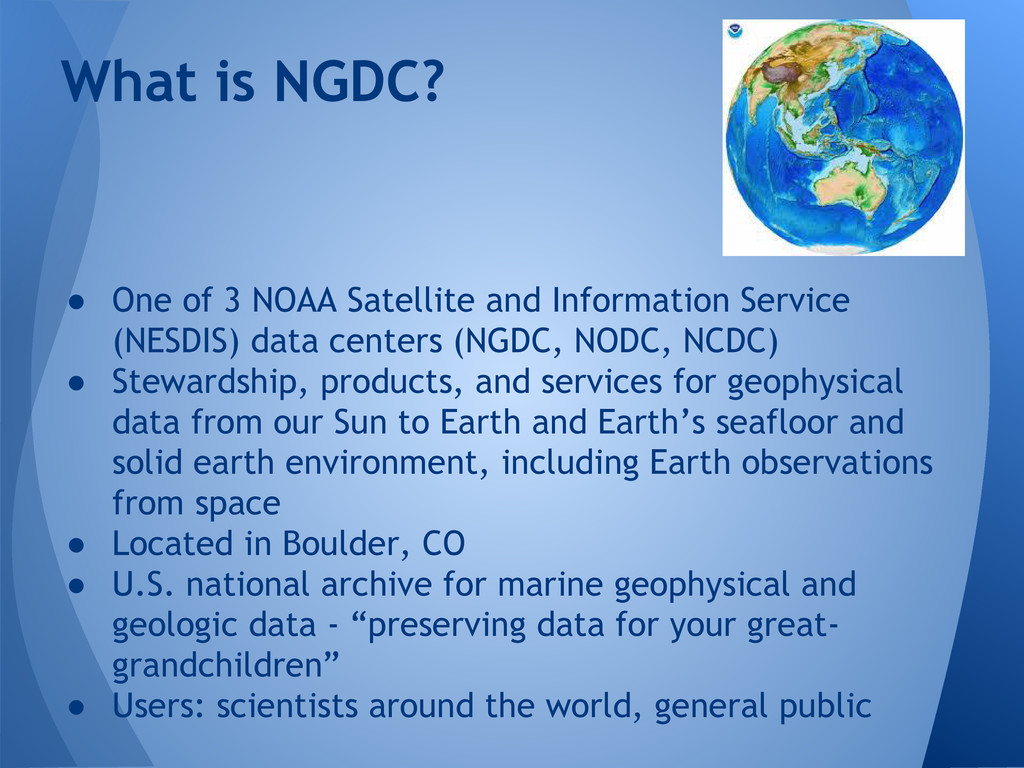
data centers (NGDC, NODC, NCDC) • Stewardship, products, and services for geophysical data from our Sun to Earth and Earth’s seafloor and solid earth environment, including Earth observations from space • Located in Boulder, CO • U.S. national archive for marine geophysical and geologic data - “preserving data for your great- grandchildren” • Users: scientists around the world, general public What is NGDC?
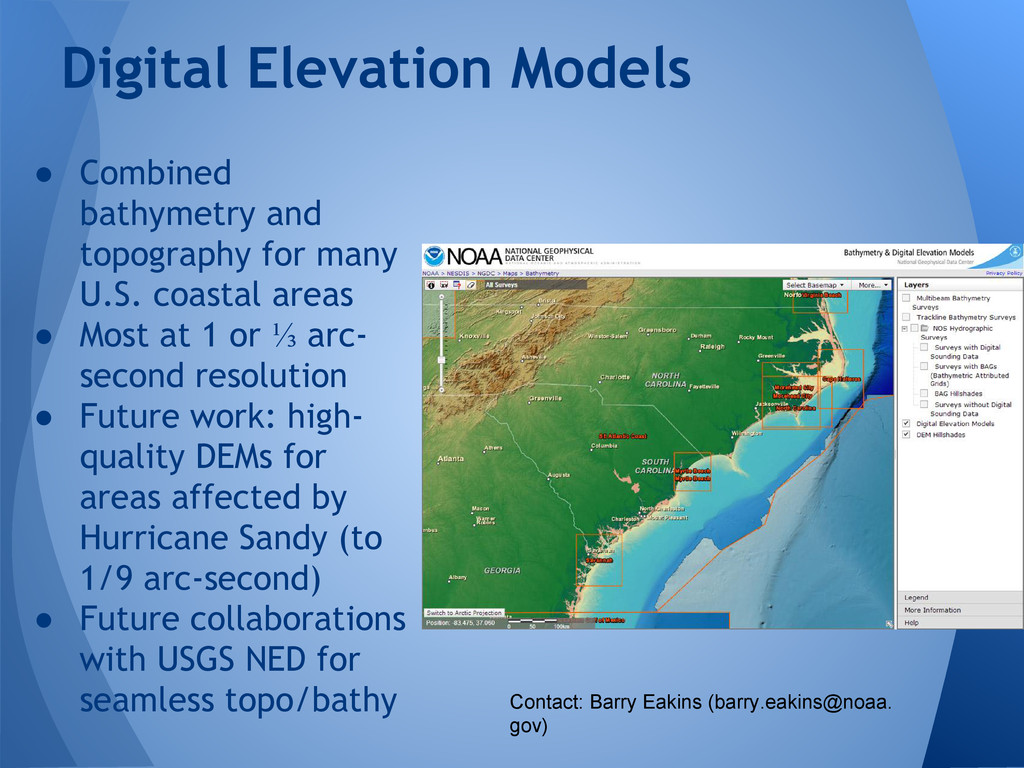
• Most at 1 or ⅓ arc- second resolution • Future work: high- quality DEMs for areas affected by Hurricane Sandy (to 1/9 arc-second) • Future collaborations with USGS NED for seamless topo/bathy Digital Elevation Models Contact: Barry Eakins (barry.eakins@noaa. gov)
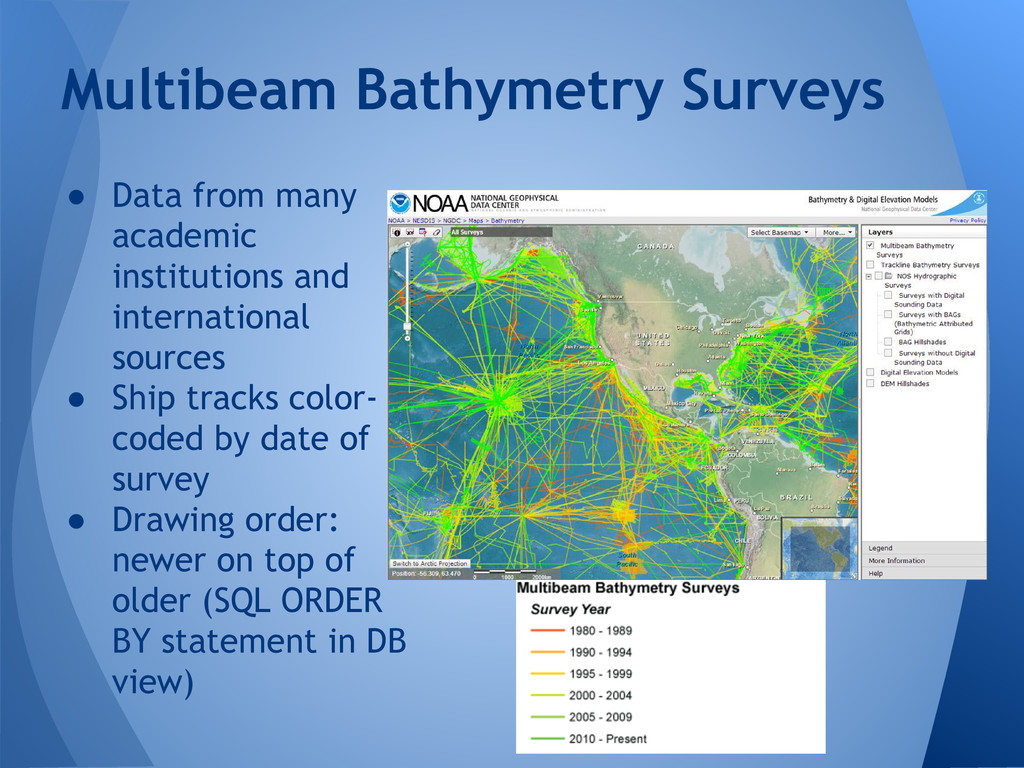
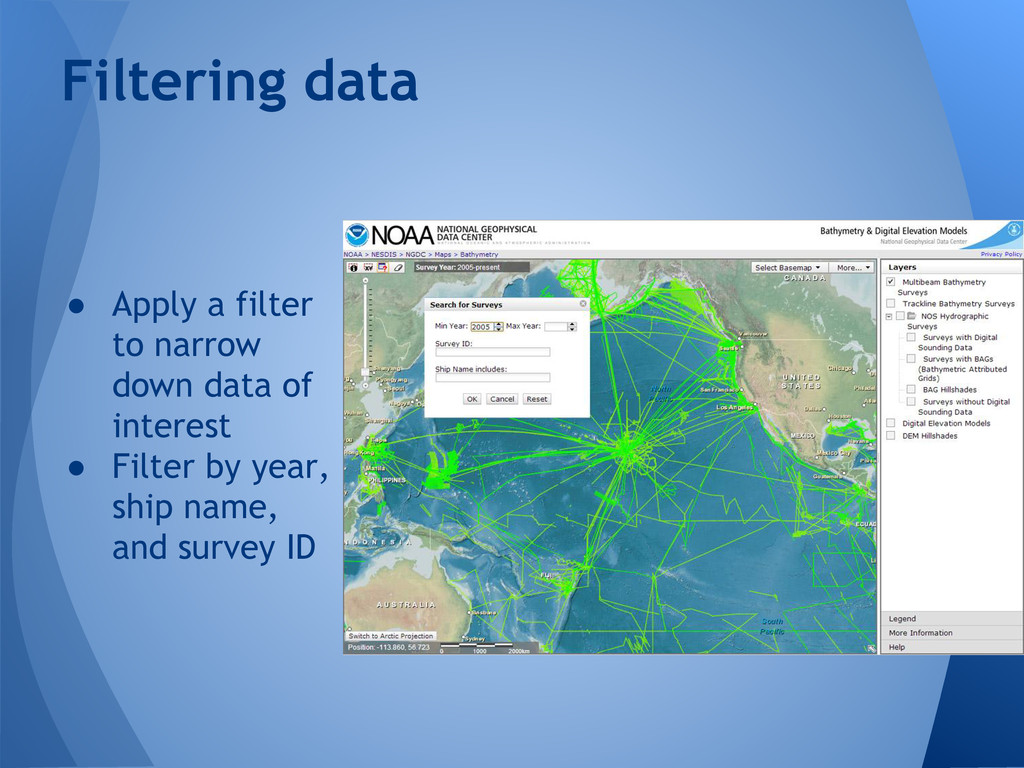
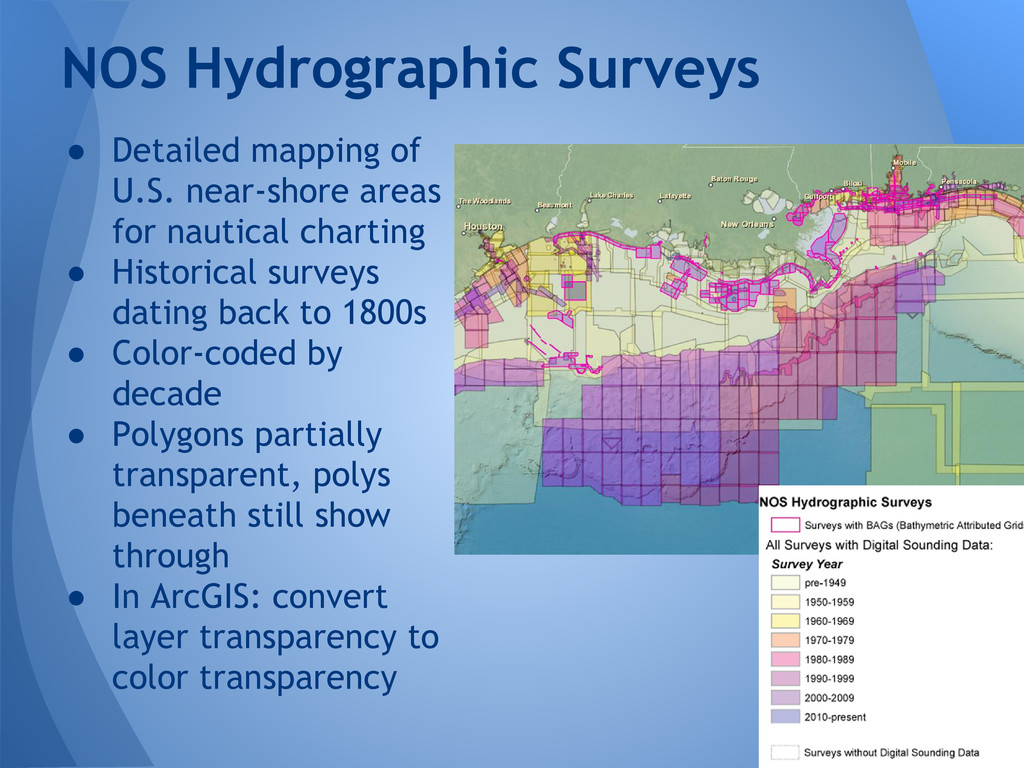
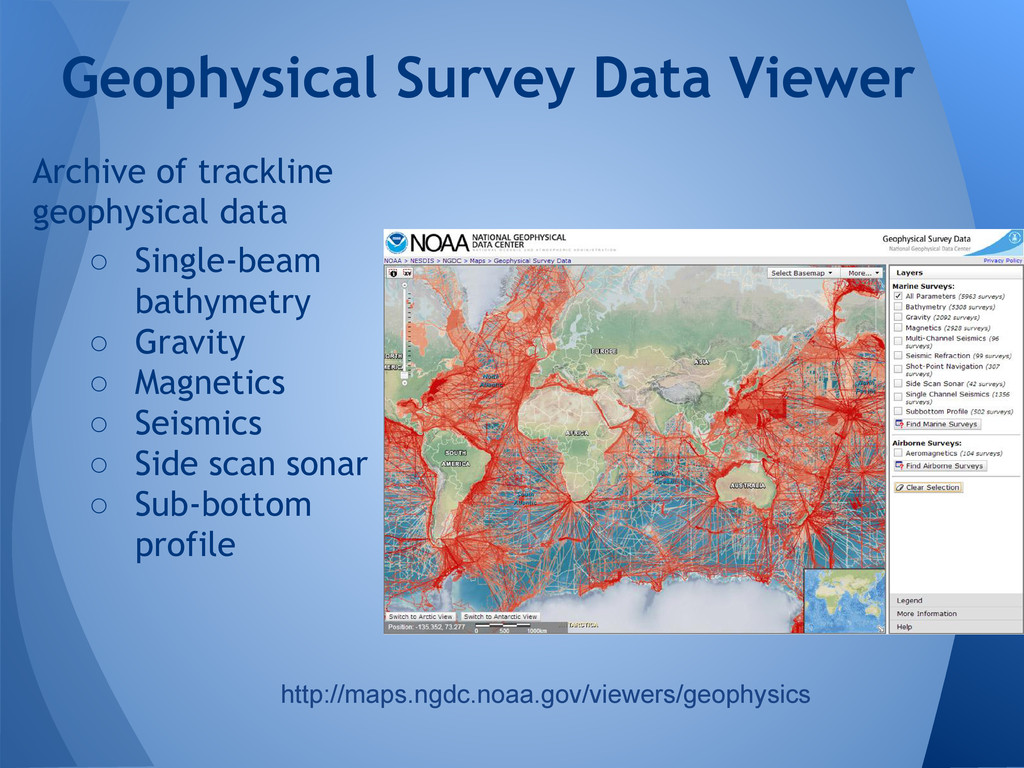
• Historical surveys dating back to 1800s • Color-coded by decade • Polygons partially transparent, polys beneath still show through • In ArcGIS: convert layer transparency to color transparency NOS Hydrographic Surveys
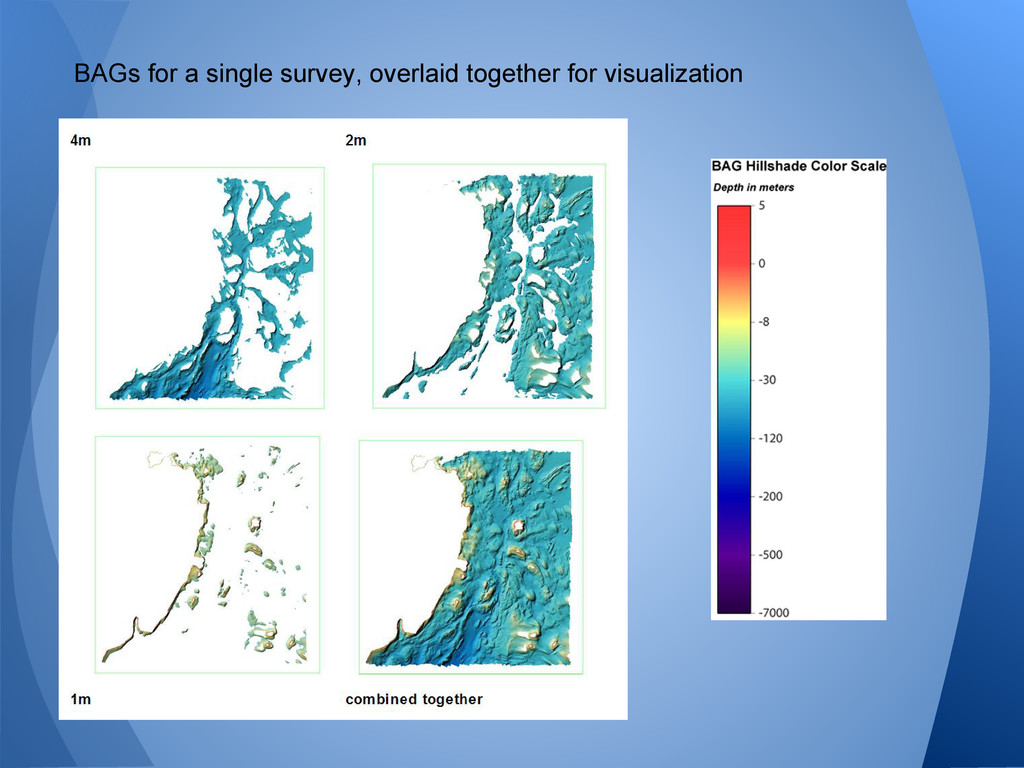
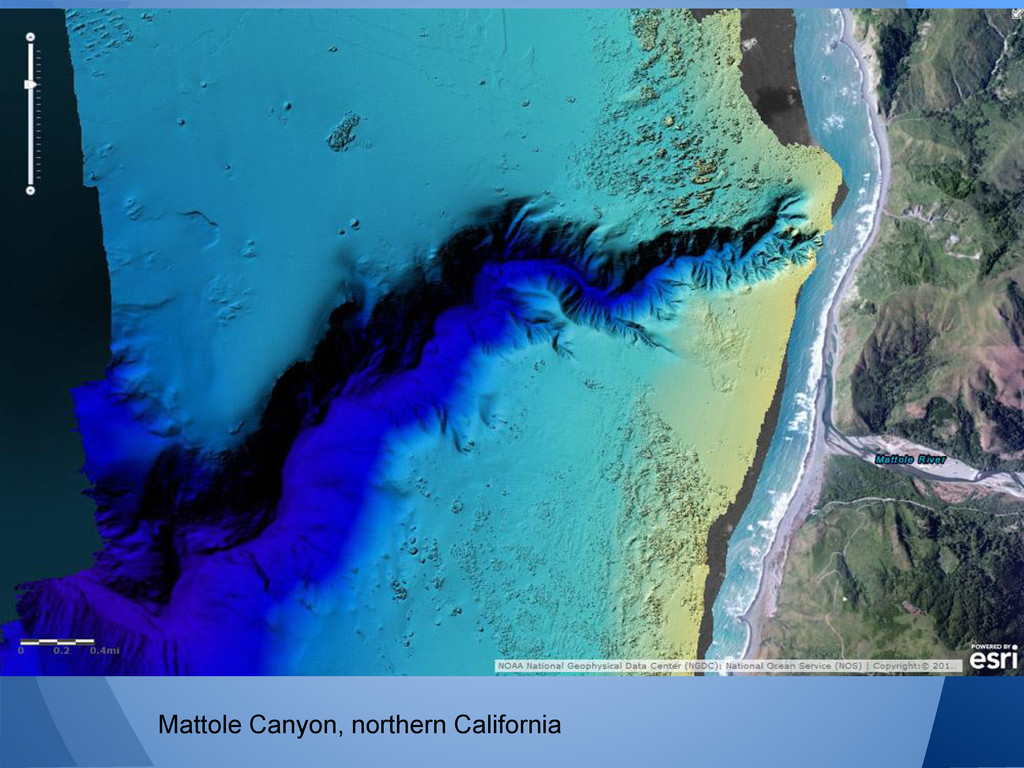
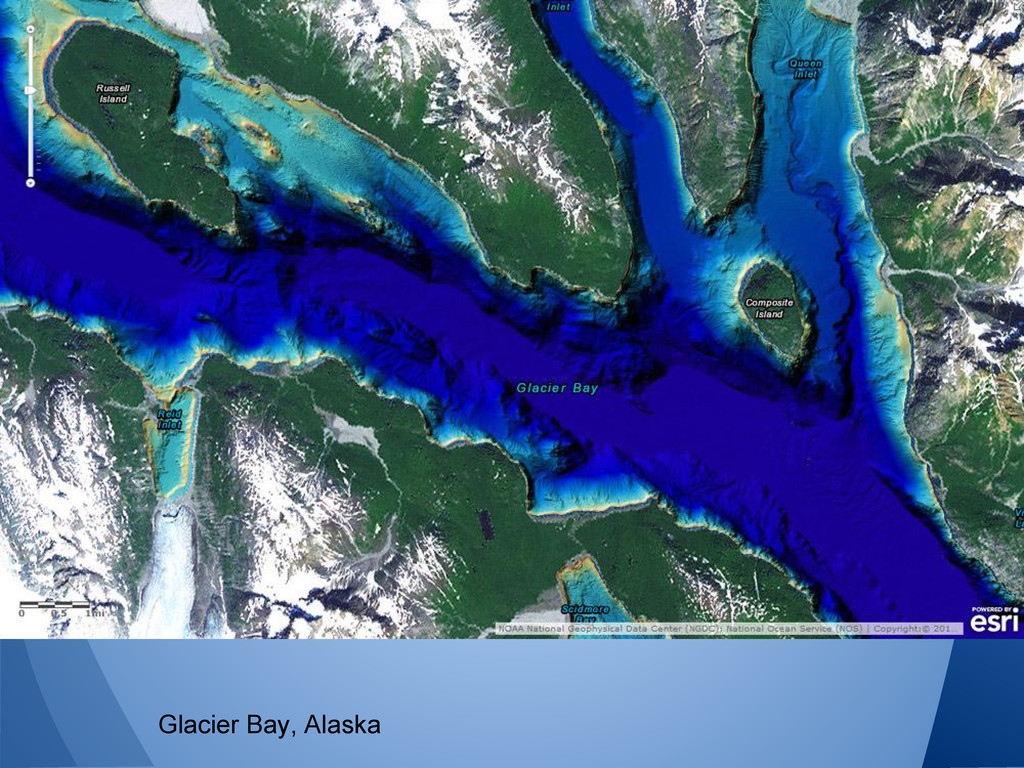
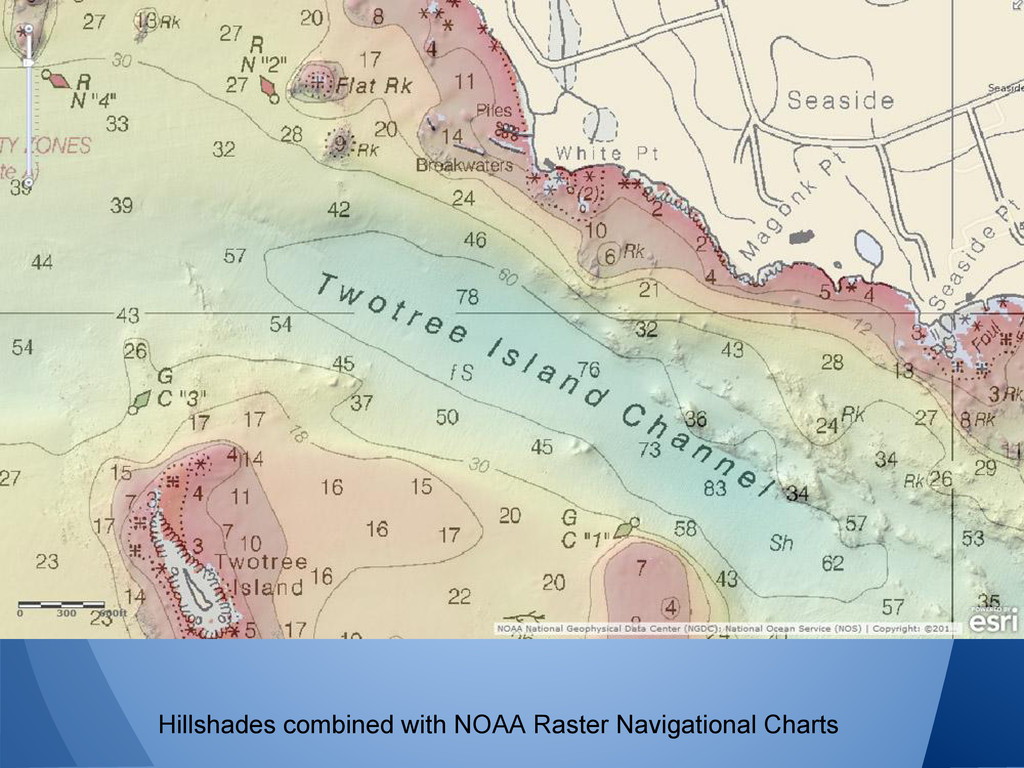
surveys • Often 1 meter resolution or better • Now readable by GDAL, ArcGIS 10.2 (bugs recently addressed) • Hillshade visualizations: preview of data coverage and quality • Workflow: Python, GDAL, ImageMagick (multiply) • ~100 GB of imagery, ArcGIS Mosaic Dataset, ArcGIS Image Service NOS Hydrographic Survey BAGs
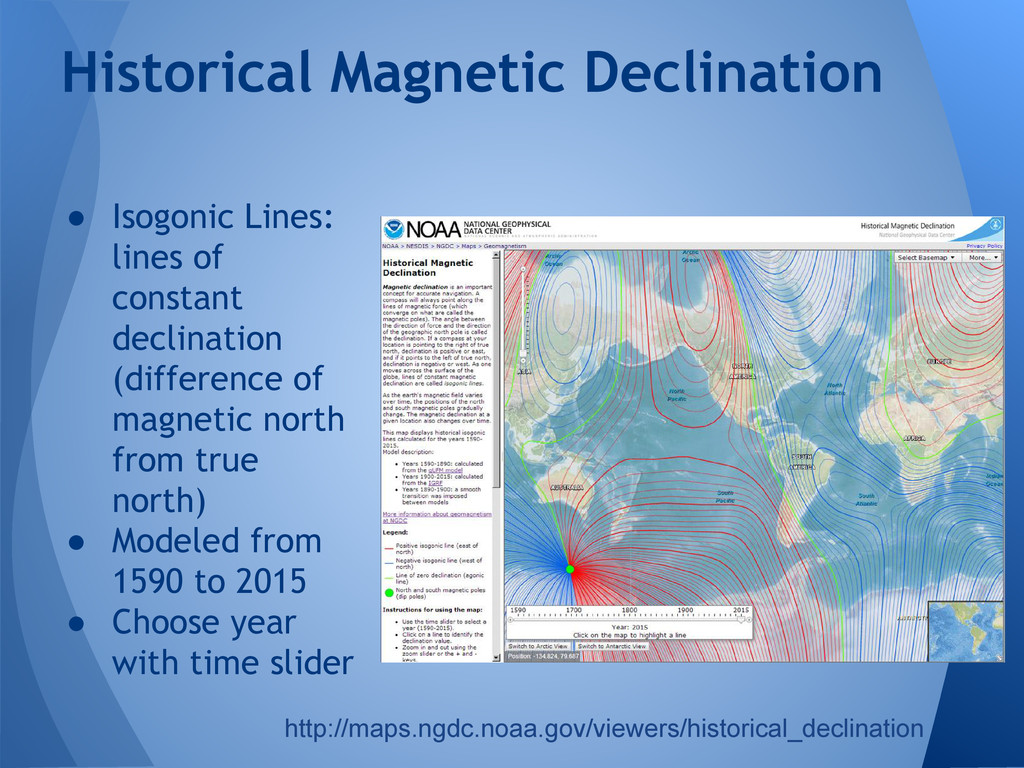
north from true north) • Modeled from 1590 to 2015 • Choose year with time slider Historical Magnetic Declination http://maps.ngdc.noaa.gov/viewers/historical_declination
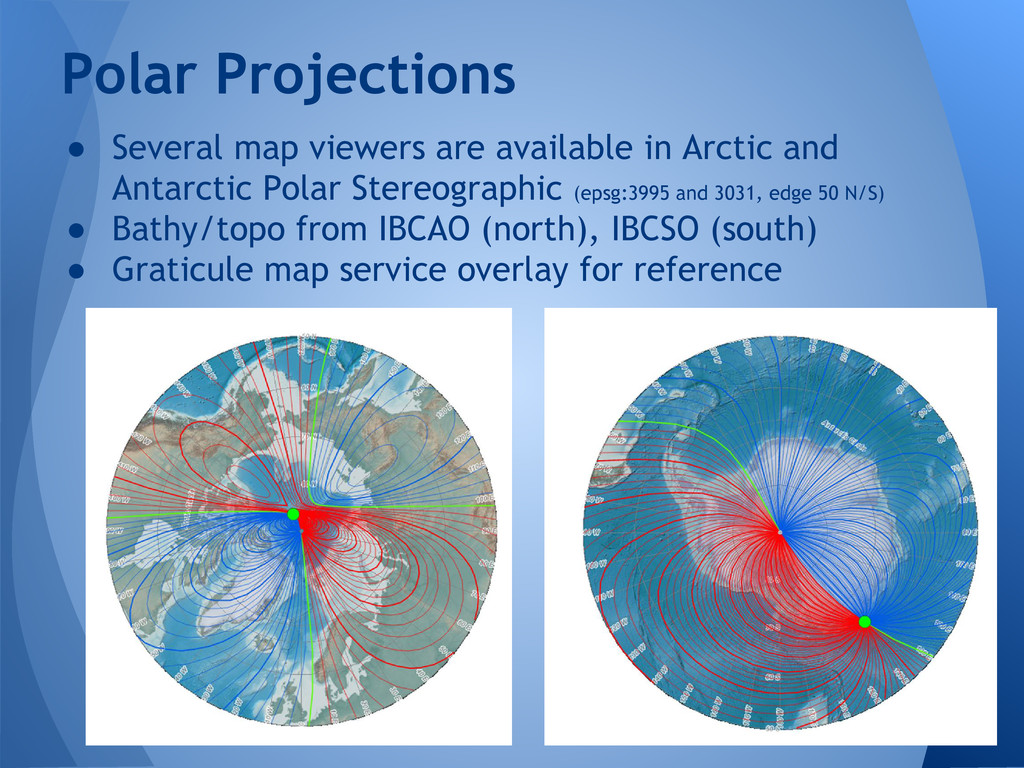
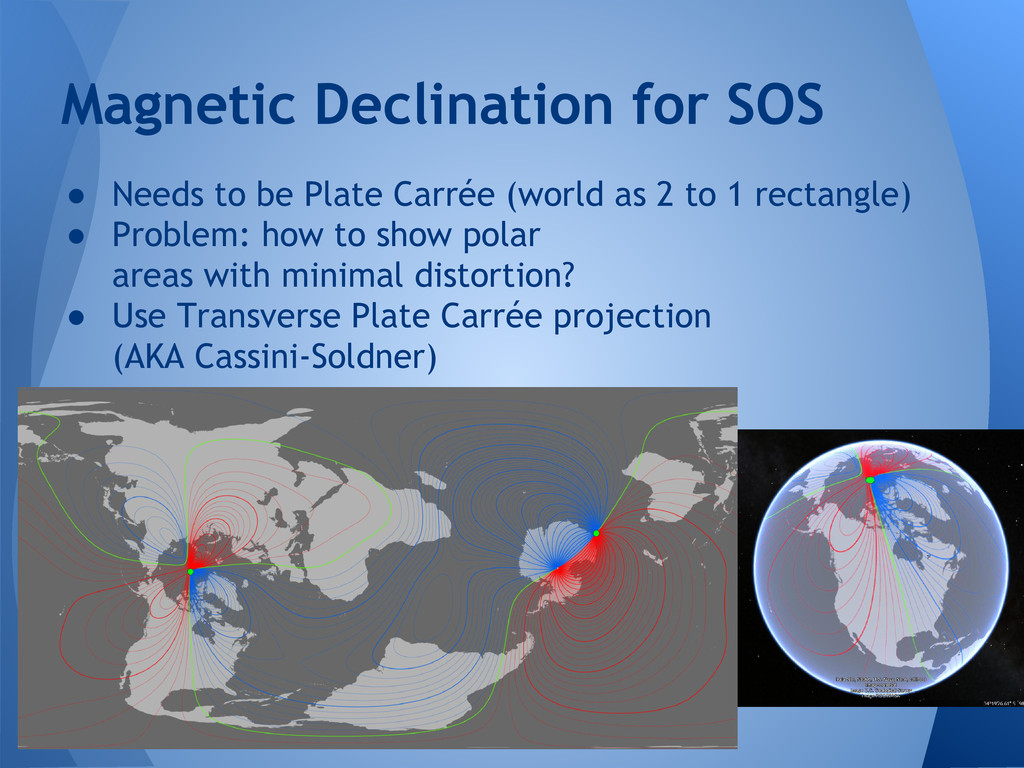
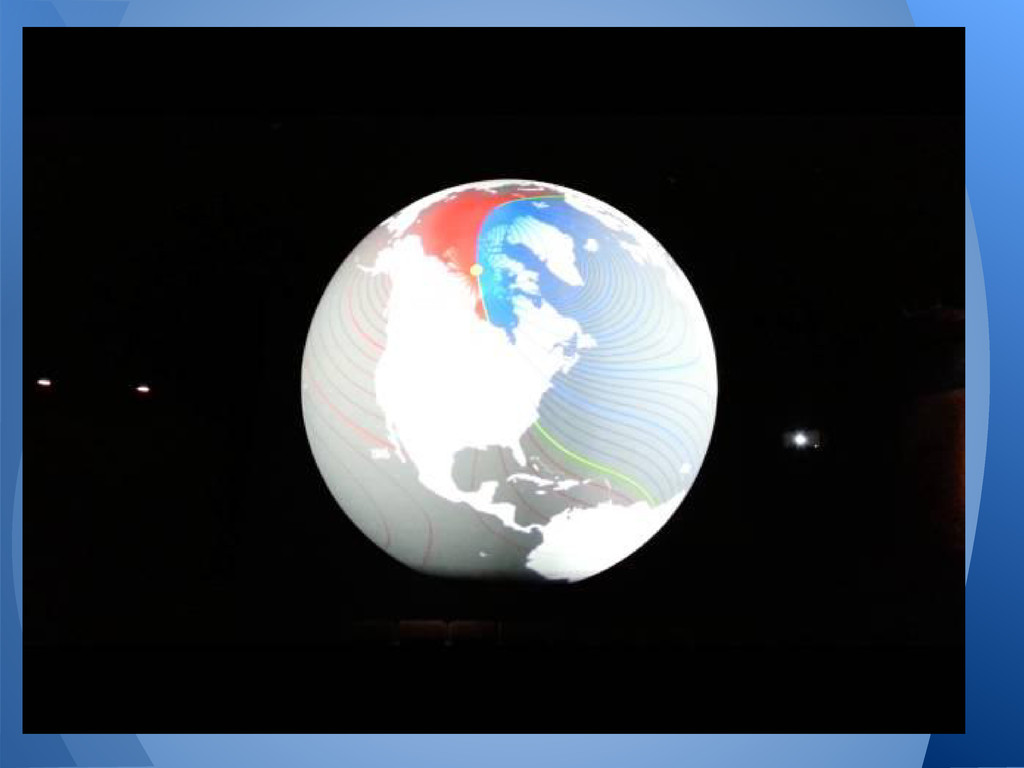
1 rectangle) • Problem: how to show polar areas with minimal distortion? • Use Transverse Plate Carrée projection (AKA Cassini-Soldner) Magnetic Declination for SOS
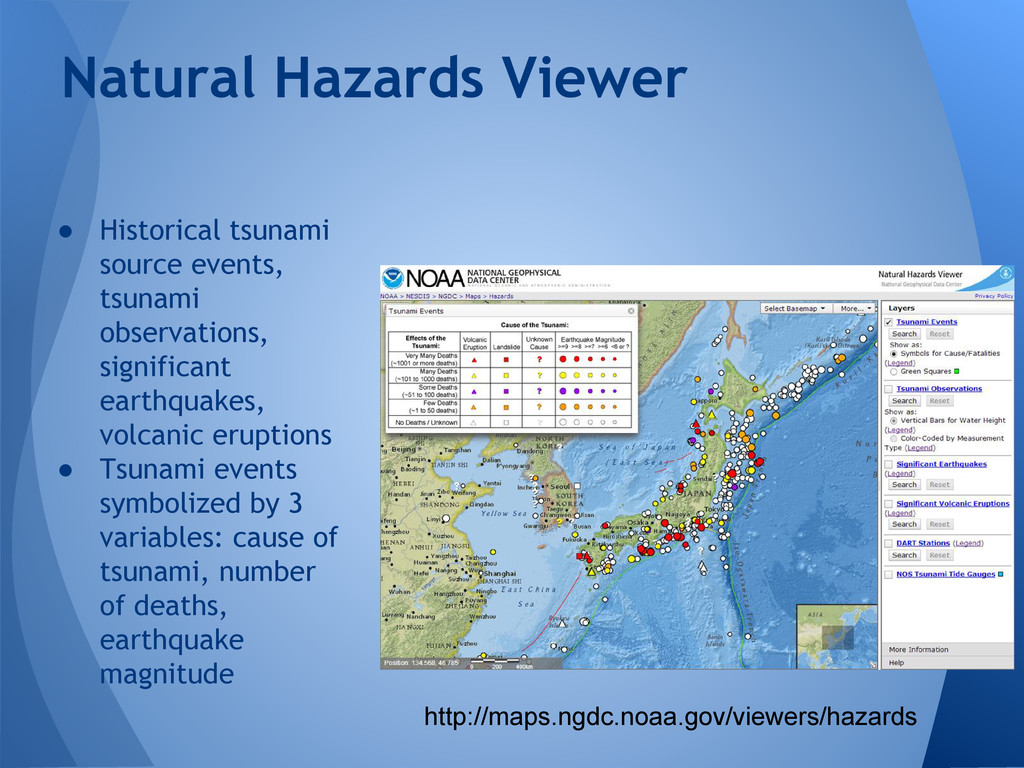
eruptions • Tsunami events symbolized by 3 variables: cause of tsunami, number of deaths, earthquake magnitude Natural Hazards Viewer http://maps.ngdc.noaa.gov/viewers/hazards
![Questions? [email protected] or [email protected] http://ngdc.noaa.gov](https://files.speakerdeck.com/presentations/a3031e7019ab0131125d56e746a4125e/slide_35.jpg)