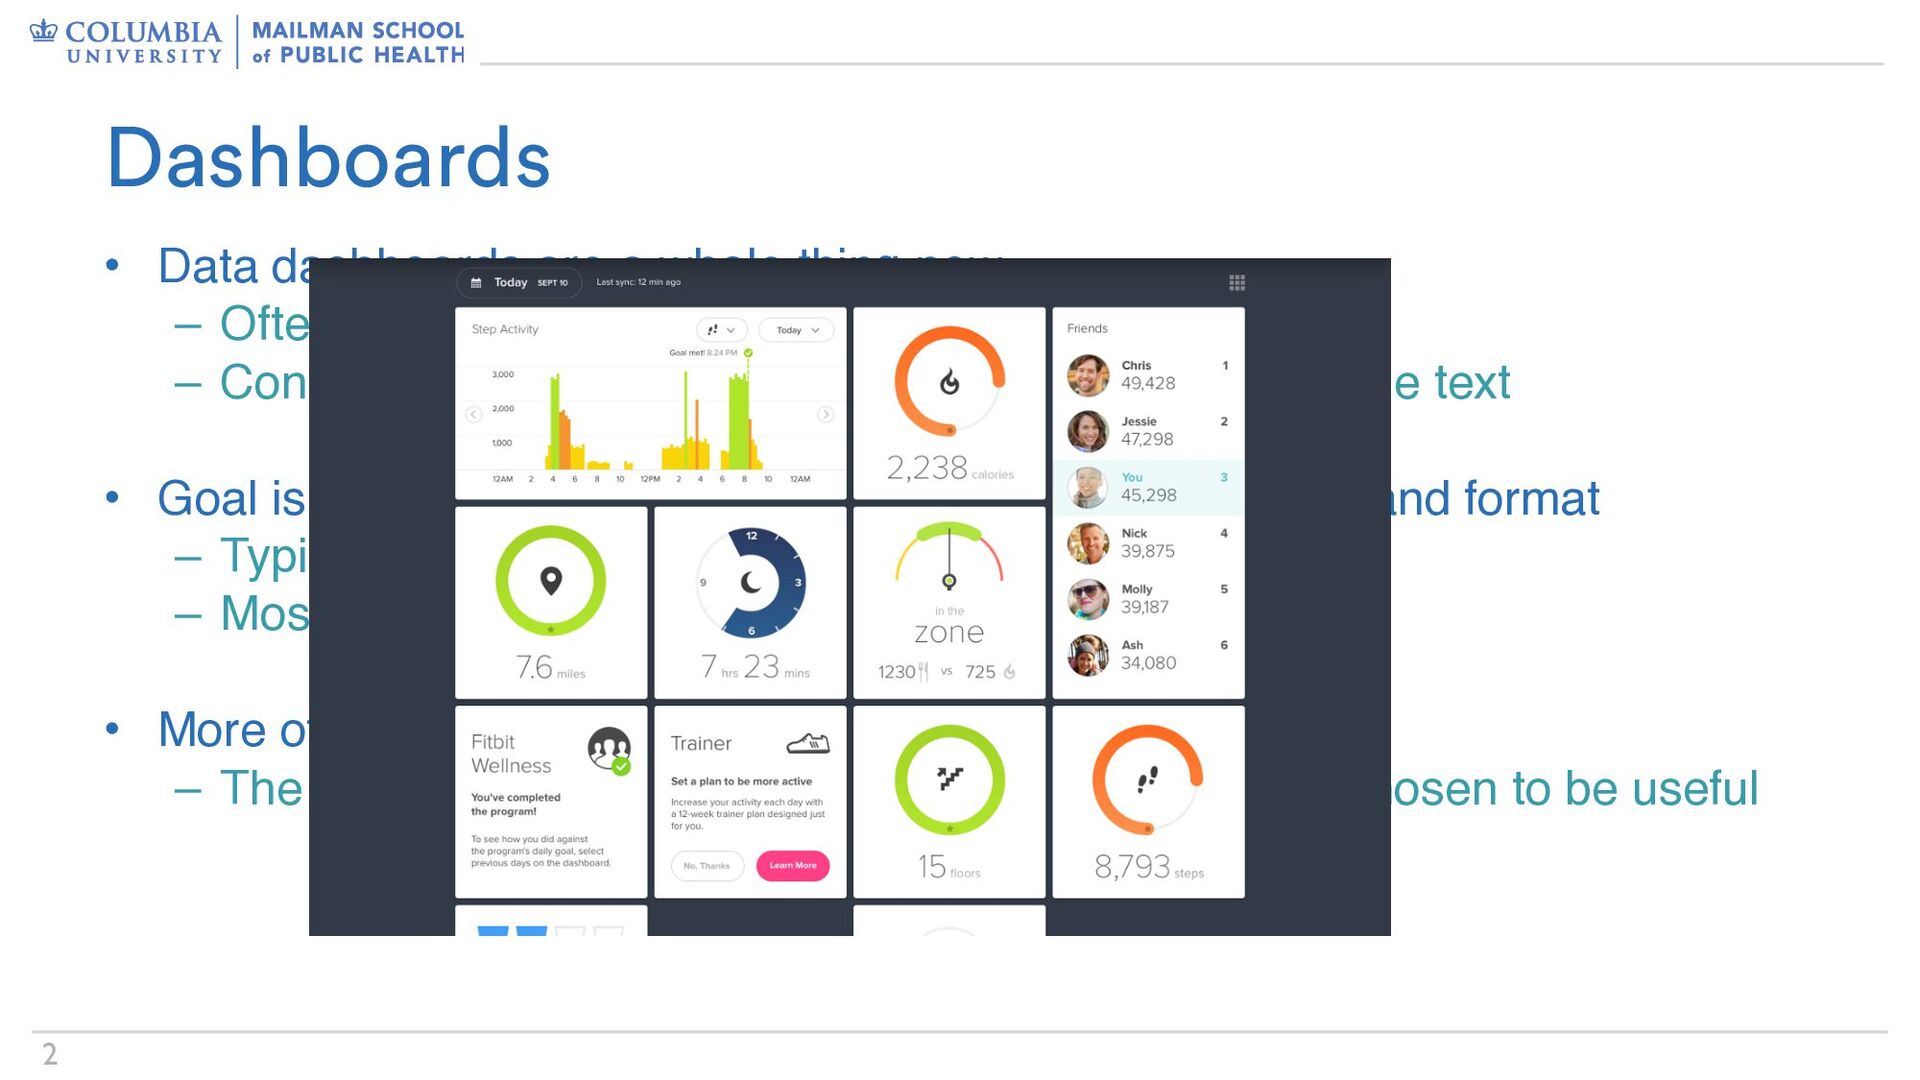
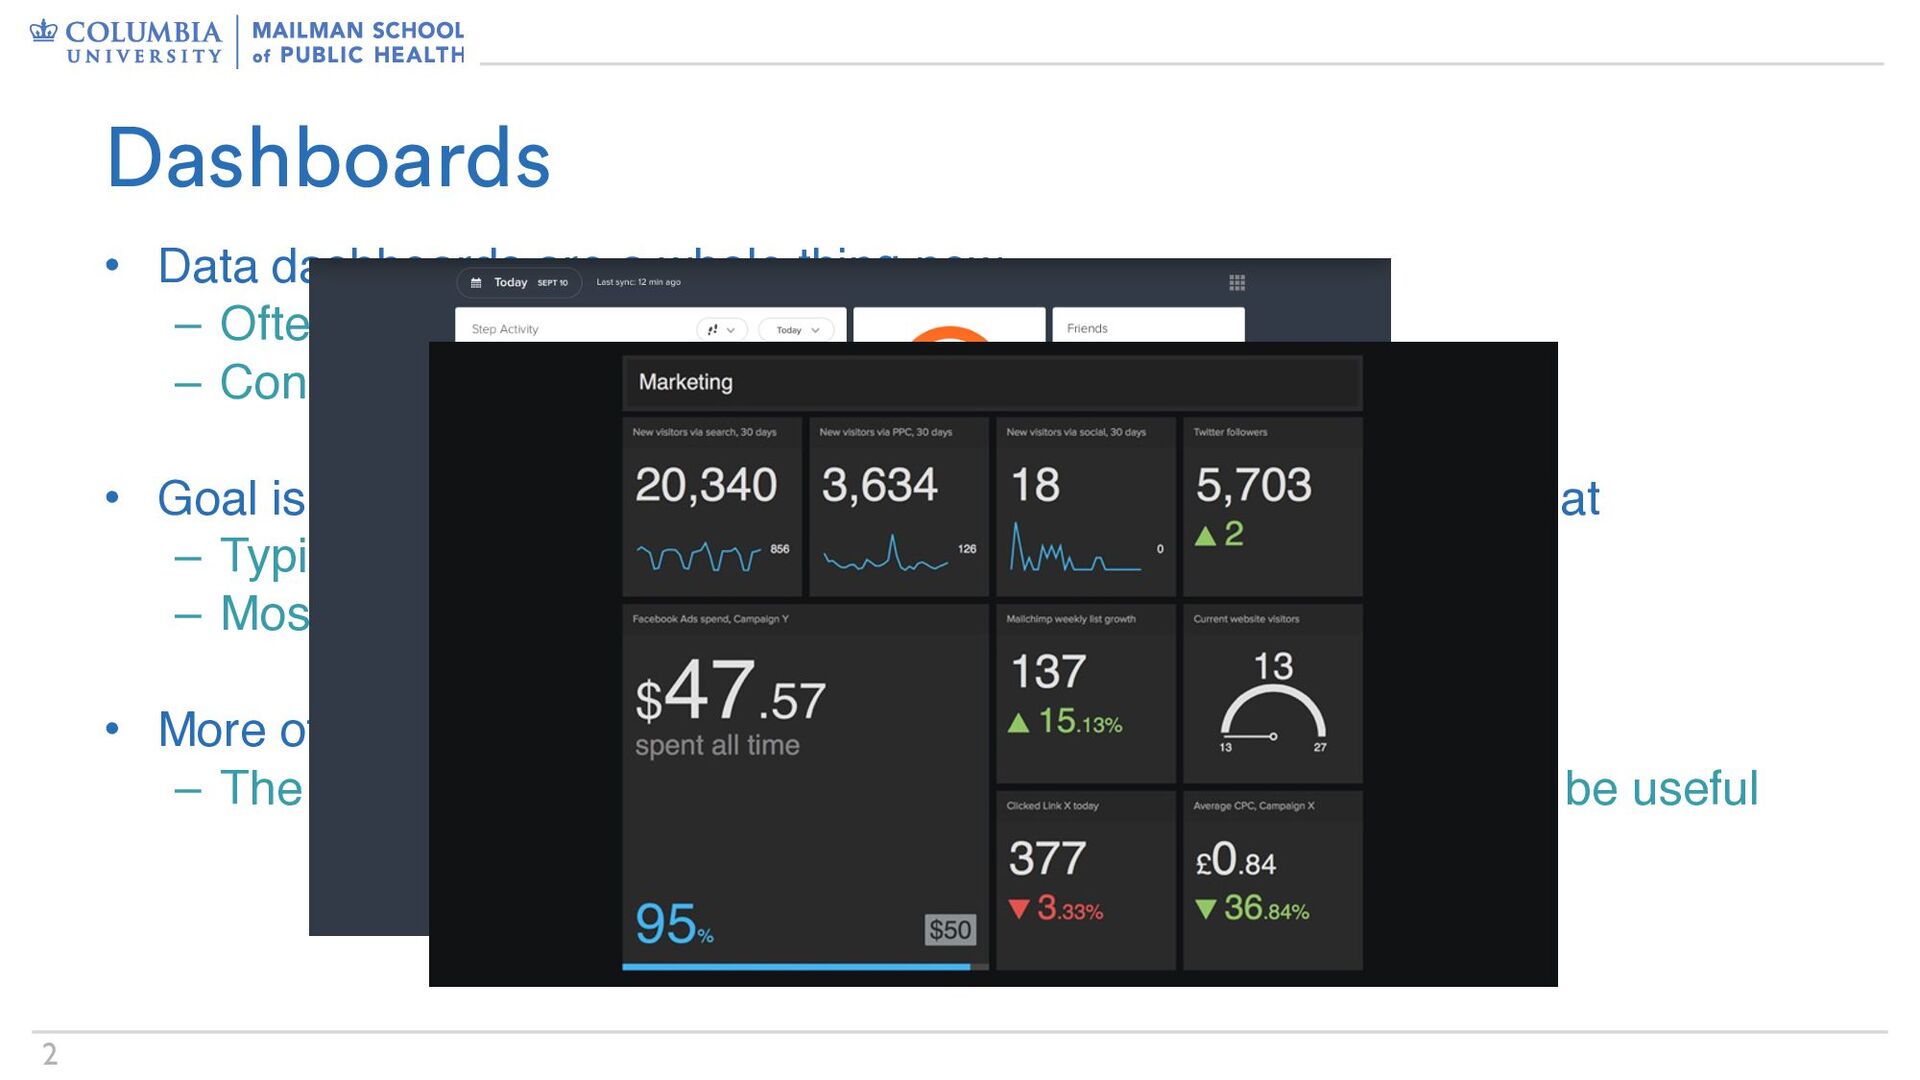
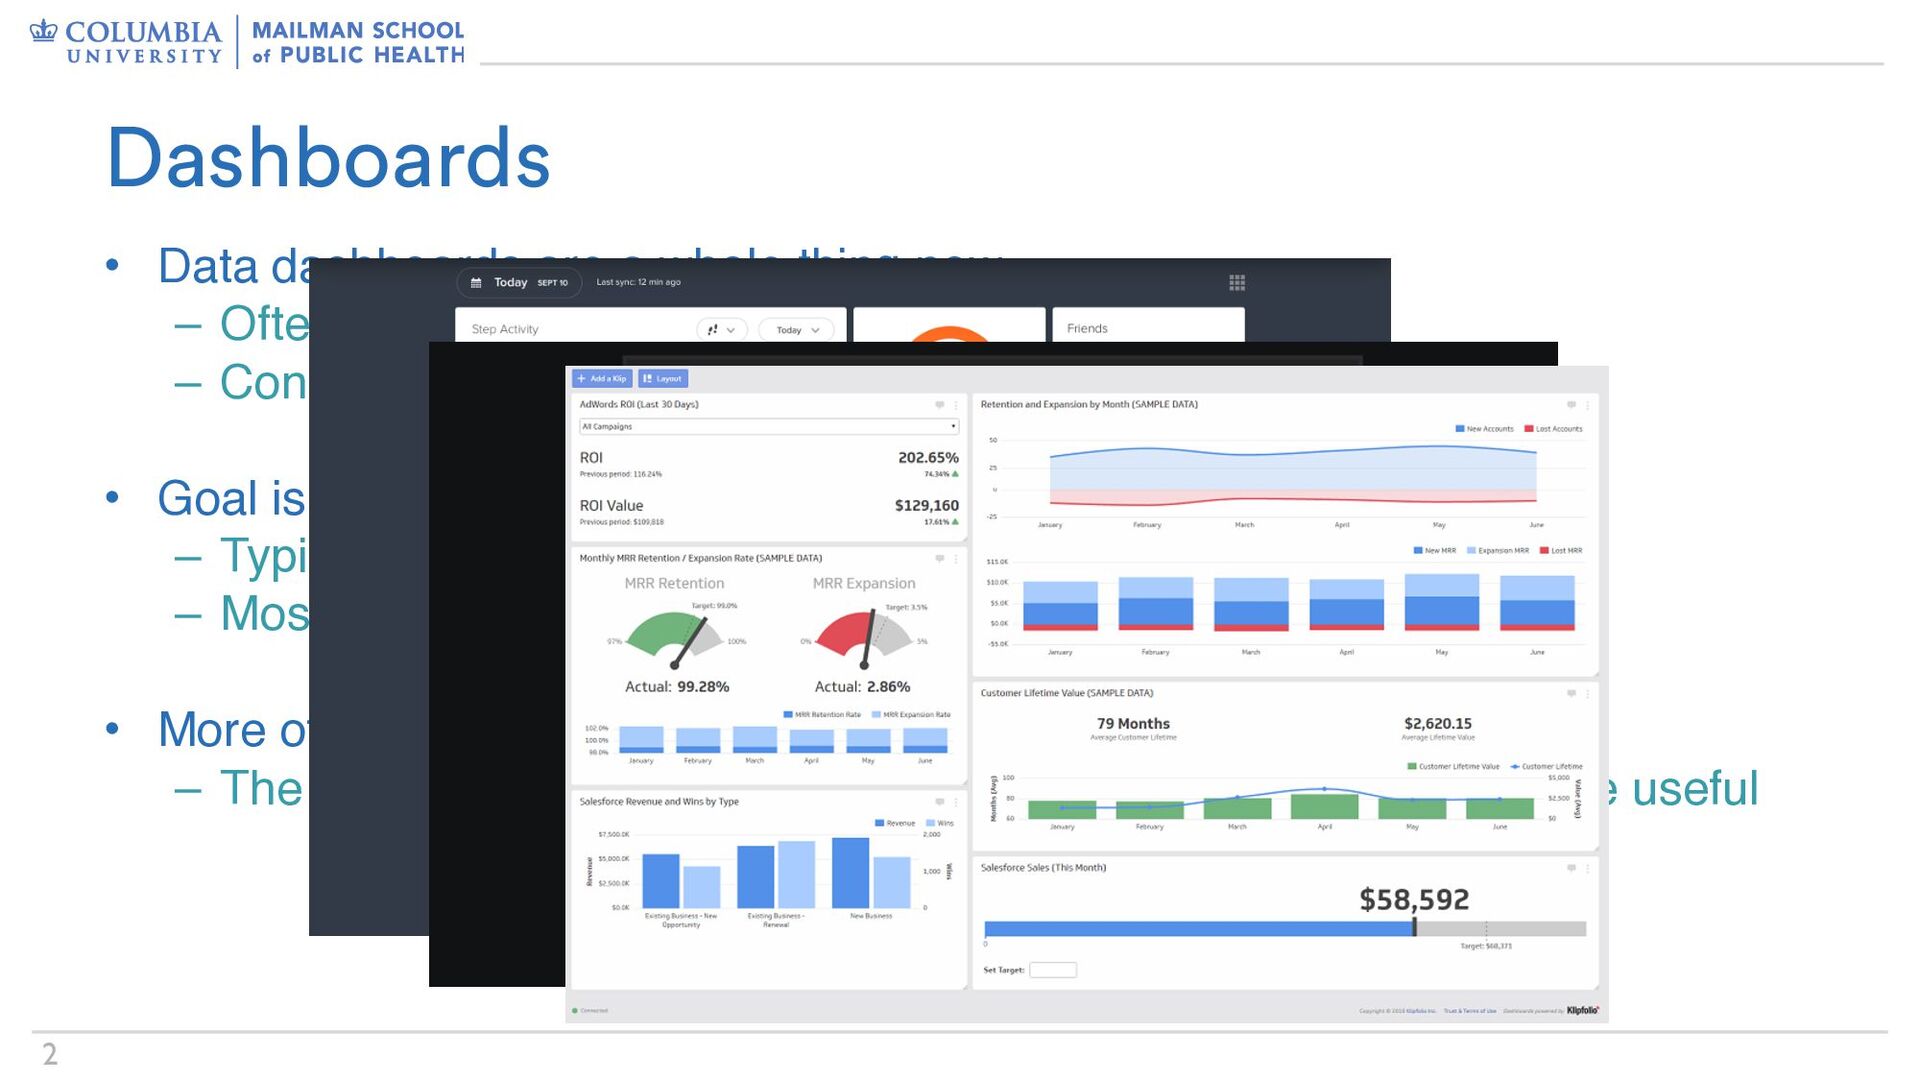
Often web-based (or at least web-inspired) – Contain well-organized plots, tables, etc. with only a little text • Goal is to convey a lot of information in a easy-to-understand format – Typically enable exploration by the user – Most useful for large, complex datasets • More of a “deliverable” than an “exploratory product” – The plots embedded in a dashboard are deliberately chosen to be useful Dashboards
Often web-based (or at least web-inspired) – Contain well-organized plots, tables, etc. with only a little text • Goal is to convey a lot of information in a easy-to-understand format – Typically enable exploration by the user – Most useful for large, complex datasets • More of a “deliverable” than an “exploratory product” – The plots embedded in a dashboard are deliberately chosen to be useful Dashboards
Often web-based (or at least web-inspired) – Contain well-organized plots, tables, etc. with only a little text • Goal is to convey a lot of information in a easy-to-understand format – Typically enable exploration by the user – Most useful for large, complex datasets • More of a “deliverable” than an “exploratory product” – The plots embedded in a dashboard are deliberately chosen to be useful Dashboards
Often web-based (or at least web-inspired) – Contain well-organized plots, tables, etc. with only a little text • Goal is to convey a lot of information in a easy-to-understand format – Typically enable exploration by the user – Most useful for large, complex datasets • More of a “deliverable” than an “exploratory product” – The plots embedded in a dashboard are deliberately chosen to be useful Dashboards
… • flexdashboard allows R Markdown to output a structured HTML file – You have to learn (or copy) elements for layout, but otherwise you’re writing an RMD file • Can host online as part of a webpage, just like any other HTML file produced by R Markdown – Create a GitHub repo + R Project – Put website stuff in it – Tell GitHub this is a website – … – Profit? flexdashboard