• They’re rarely even in the form you need • The process of taking data in whatever form they exist and transforming them to the form you need is “wrangling” Data wrangling
subject – Column = variable • The variables may be of different types • In R, data.frames are designed to hold this kind of dataset – Looks like a matrix – Actually a very specific list Data tables
• Some things change; base R is not one of those things • Tibbles are data frames, just slightly different – They keep you from printing everything by accident – They make you type complete variable names Why tibbles?
do a lot of when you manipulate data: – Select relevant variables – Filter out unnecessary observations – Create new variables, or change existing ones – Arrange in an easy-to-digest format Major steps
to each of these major steps – select relevant variables – filter out unnecessary observations – mutate (sorry) new variables, or change existing ones – arrange in an easy-to-digest format dplyr
to each of these major steps – select relevant variables – filter out unnecessary observations – mutate (sorry) new variables, or change existing ones – arrange in an easy-to-digest format dplyr
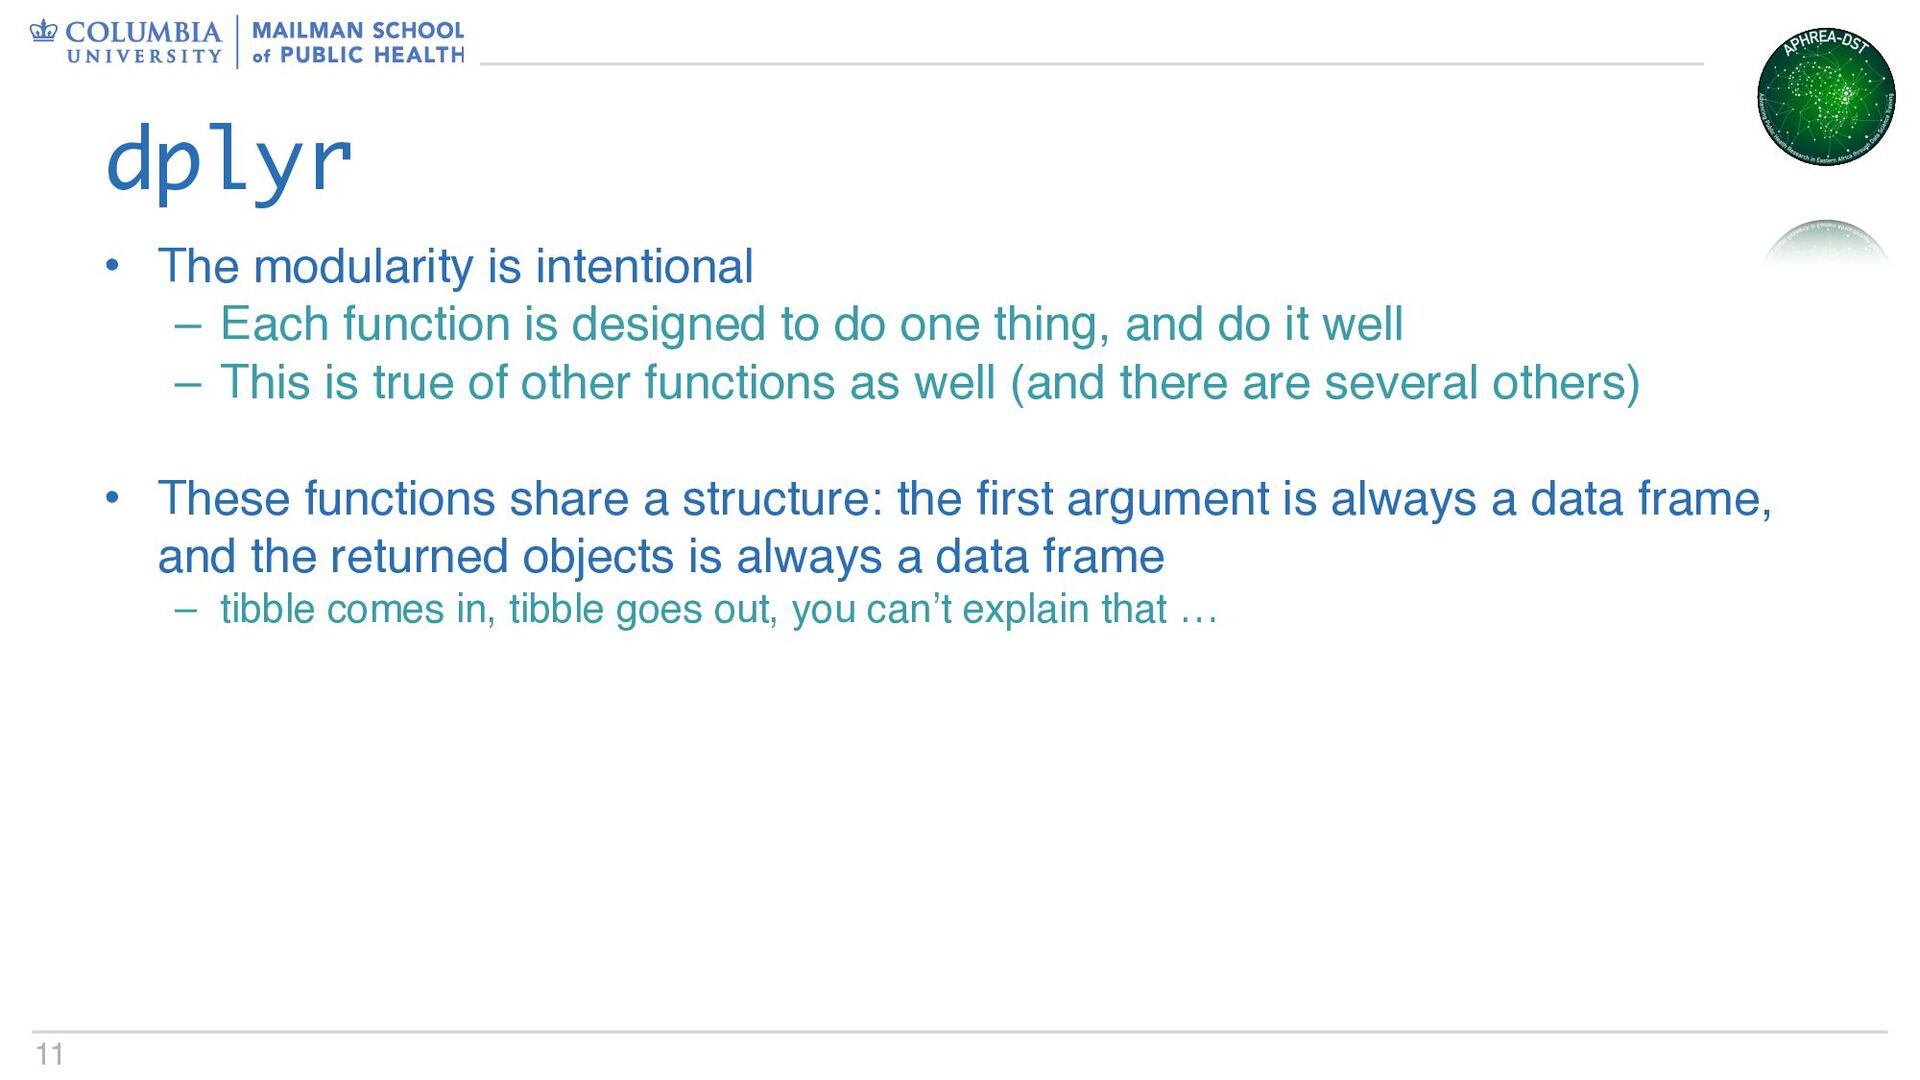
designed to do one thing, and do it well – This is true of other functions as well (and there are several others) • These functions share a structure: the first argument is always a data frame, and the returned objects is always a data frame – tibble comes in, tibble goes out, you can’t explain that … dplyr
actions – “New” to R (2014) – Came from the magrittr package; loaded by everything in the tidyverse – Even Newer!! Added to Base R (2021) and updated (2023) Pipes
actions – “New” to R (2014) – Came from the magrittr package; loaded by everything in the tidyverse – Even Newer!! Added to Base R (2021) and updated (2023) Pipes
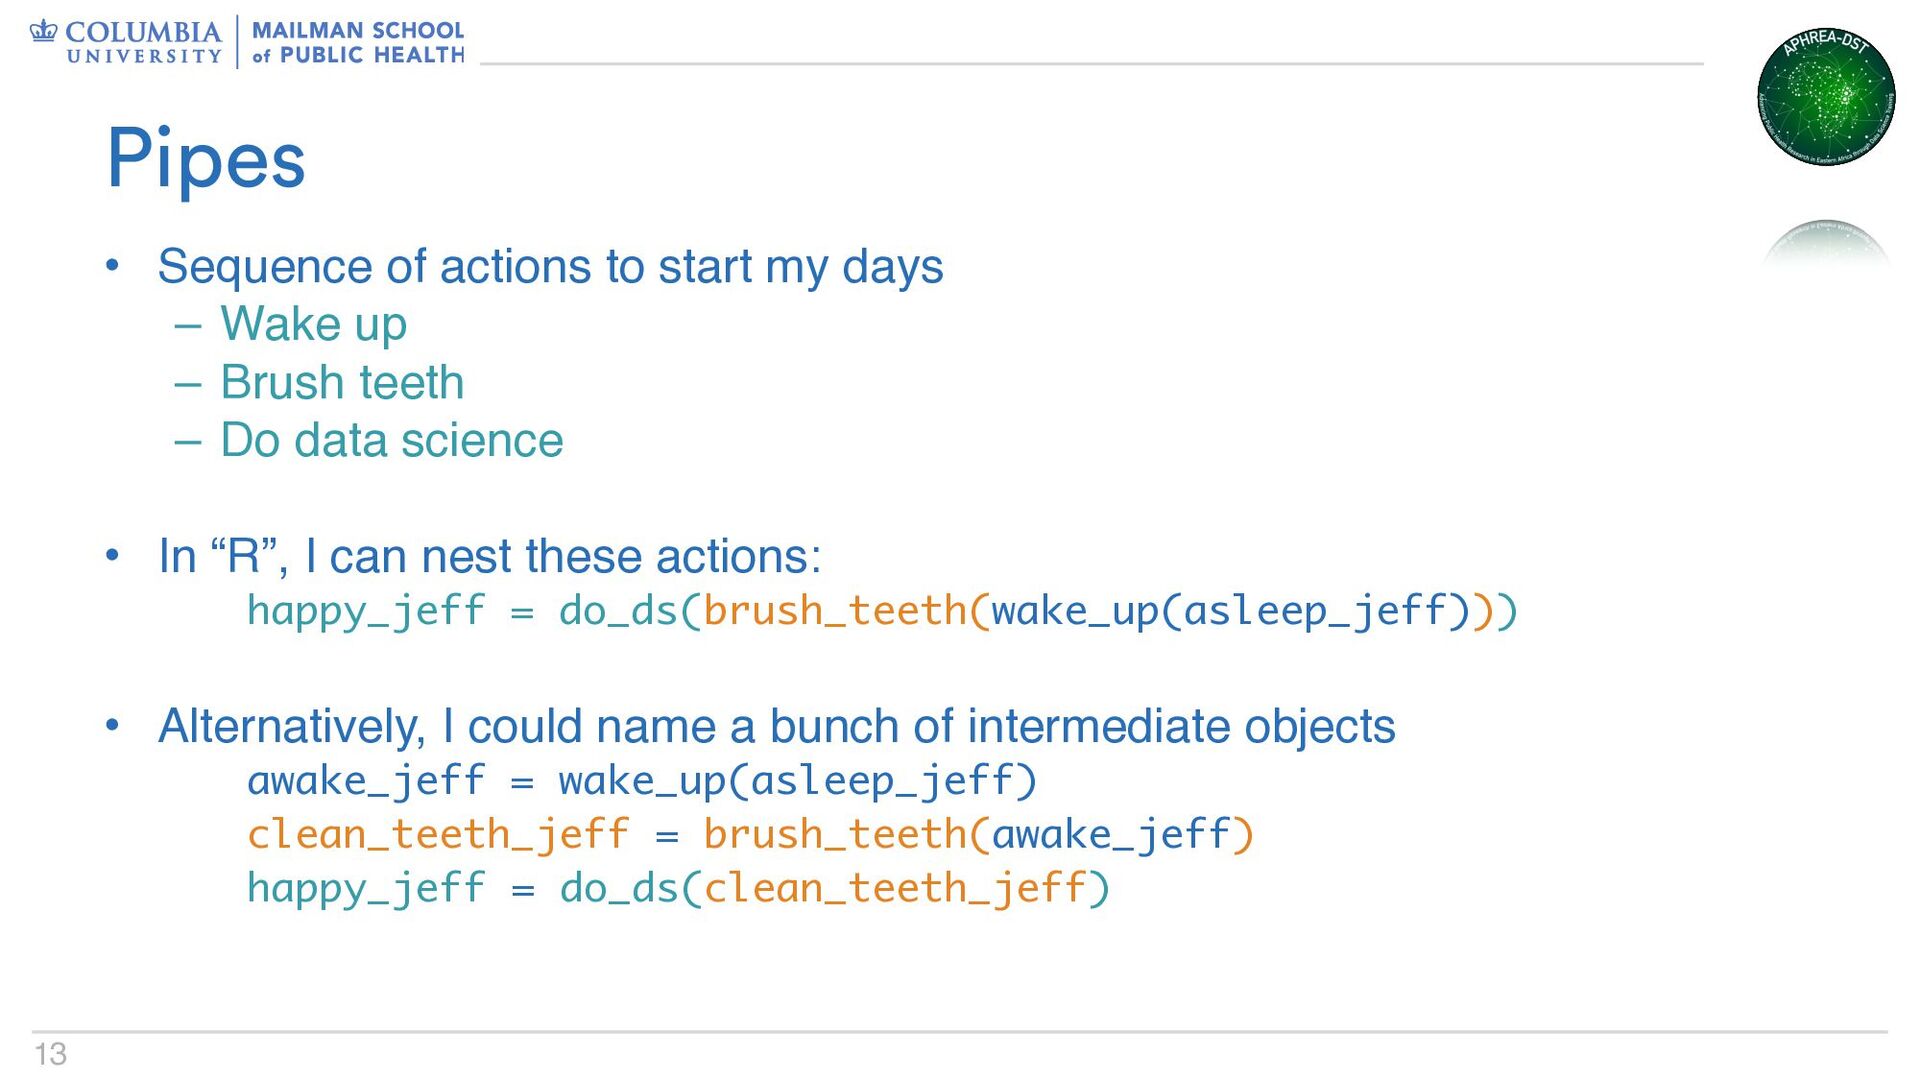
Wake up – Brush teeth – Do data science • In “R”, I can nest these actions: happy_jeff = do_ds(brush_teeth(wake_up(asleep_jeff))) • Alternatively, I could name a bunch of intermediate objects awake_jeff = wake_up(asleep_jeff) clean_teeth_jeff = brush_teeth(awake_jeff) happy_jeff = do_ds(clean_teeth_jeff) Pipes
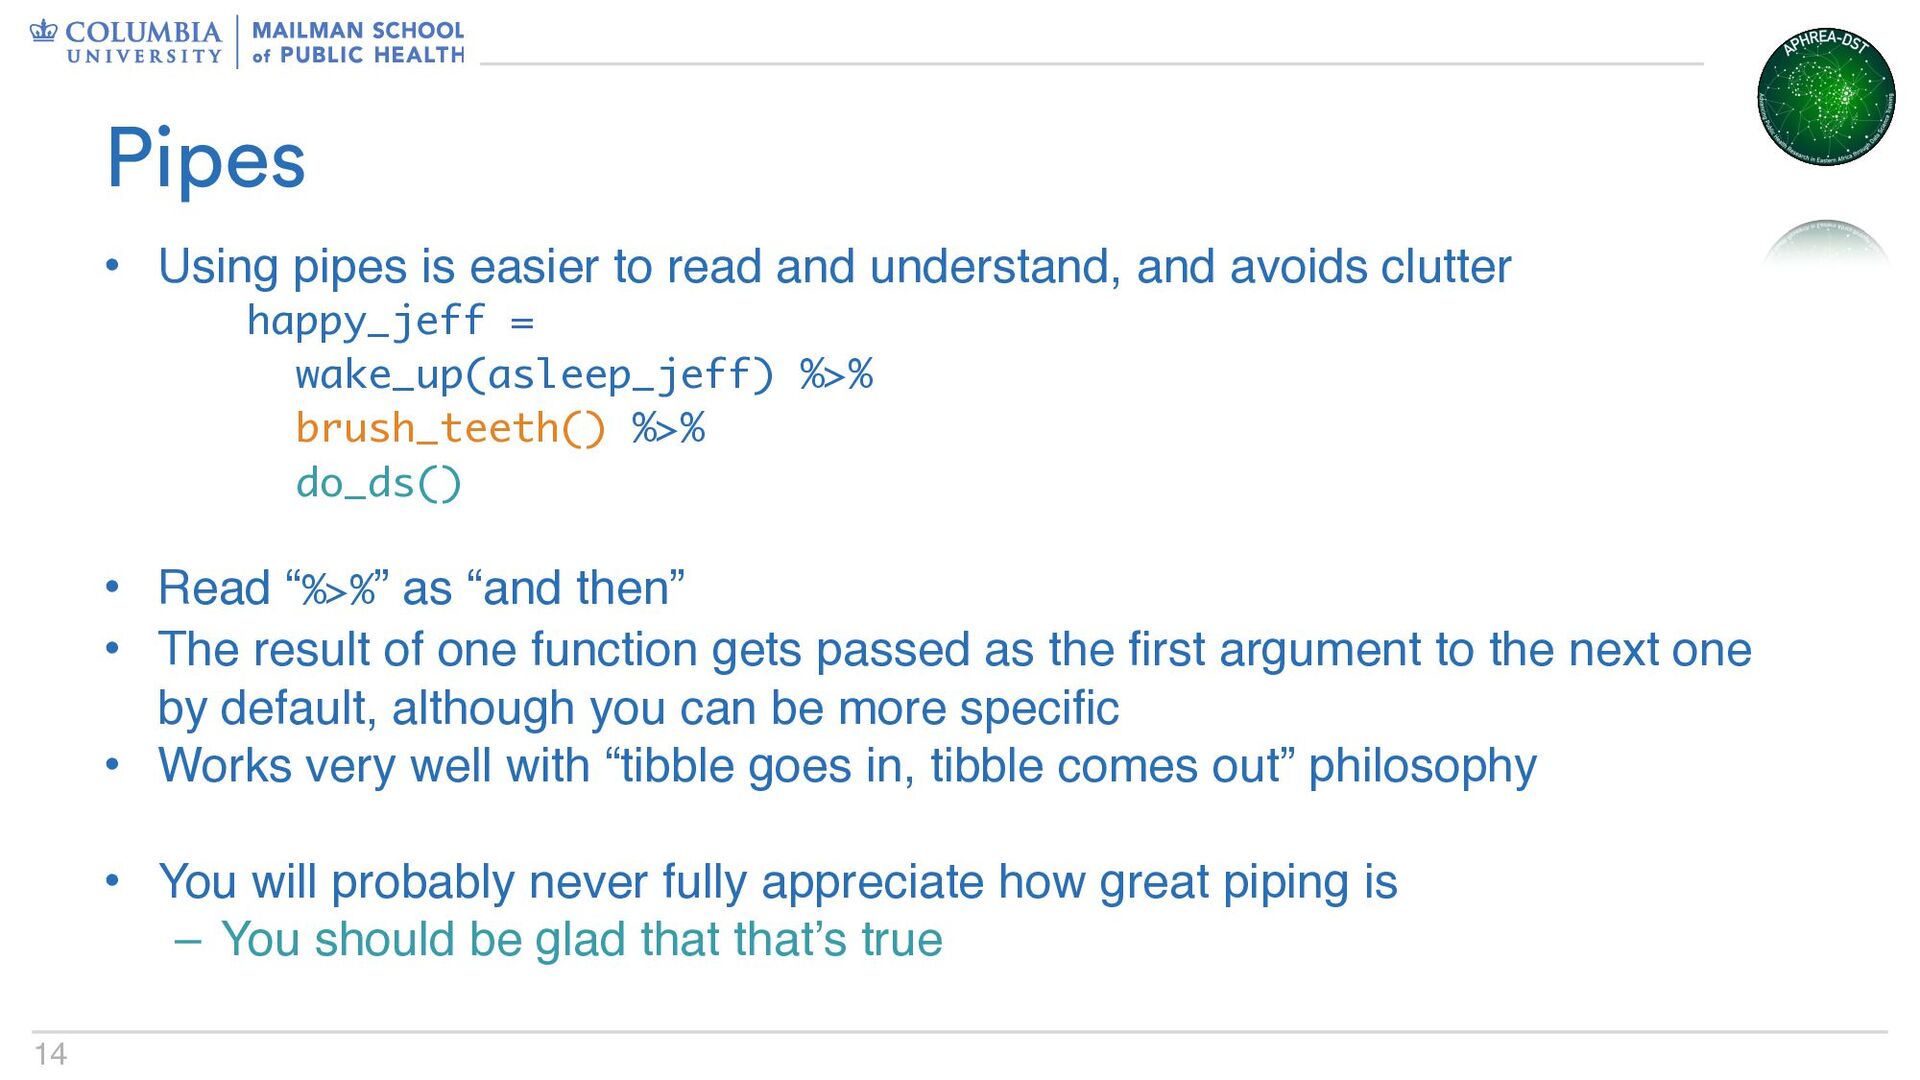
and avoids clutter happy_jeff = wake_up(asleep_jeff) %>% brush_teeth() %>% do_ds() • Read “%>%” as “and then” • The result of one function gets passed as the first argument to the next one by default, although you can be more specific • Works very well with “tibble goes in, tibble comes out” philosophy • You will probably never fully appreciate how great piping is – You should be glad that that’s true Pipes