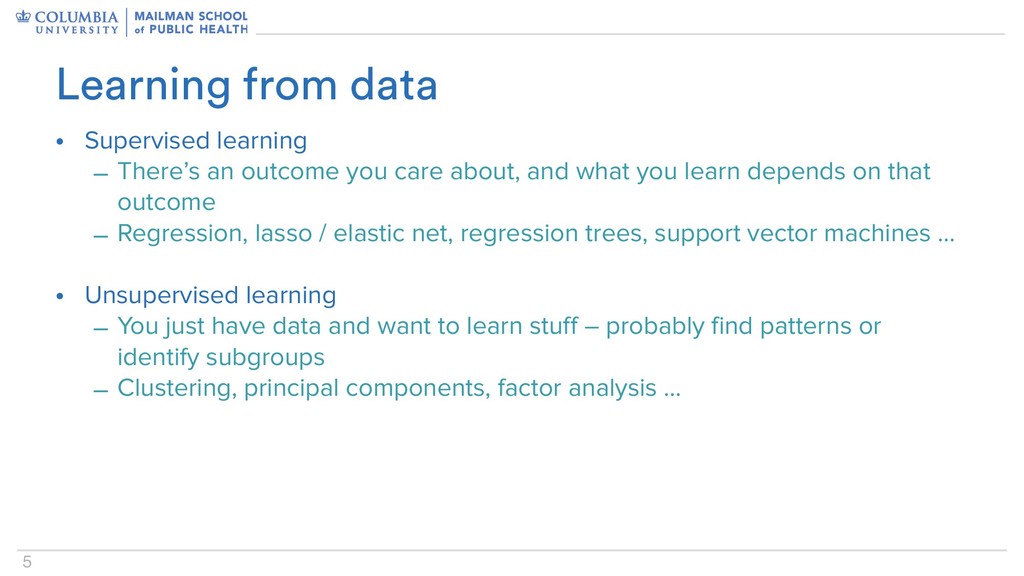
about, and what you learn depends on that outcome – Regression, lasso / elastic net, regression trees, support vector machines … • Unsupervised learning – You just have data and want to learn stuff – probably find patterns or identify subgroups – Clustering, principal components, factor analysis … Learning from data
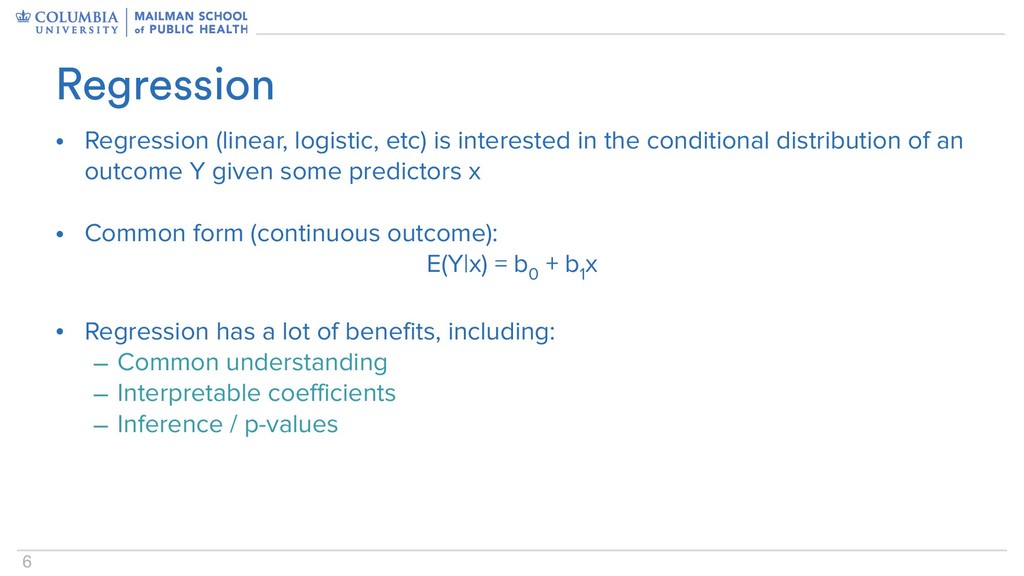
the conditional distribution of an outcome Y given some predictors x • Common form (continuous outcome): E(Y|x) = b 0 + b 1 x • Regression has a lot of benefits, including: – Common understanding – Interpretable coefficients – Inference / p-values
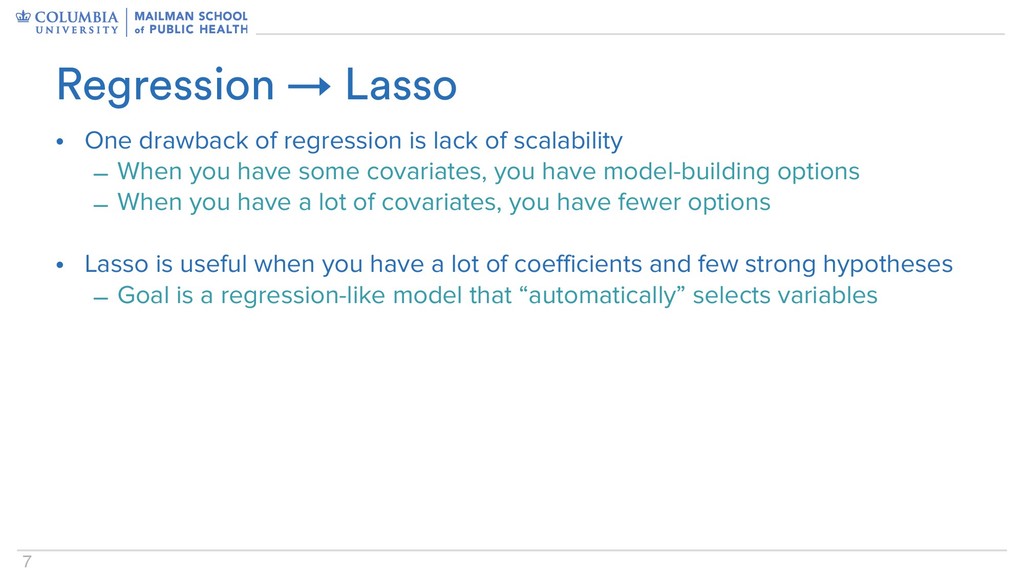
lack of scalability – When you have some covariates, you have model-building options – When you have a lot of covariates, you have fewer options • Lasso is useful when you have a lot of coefficients and few strong hypotheses – Goal is a regression-like model that “automatically” selects variables
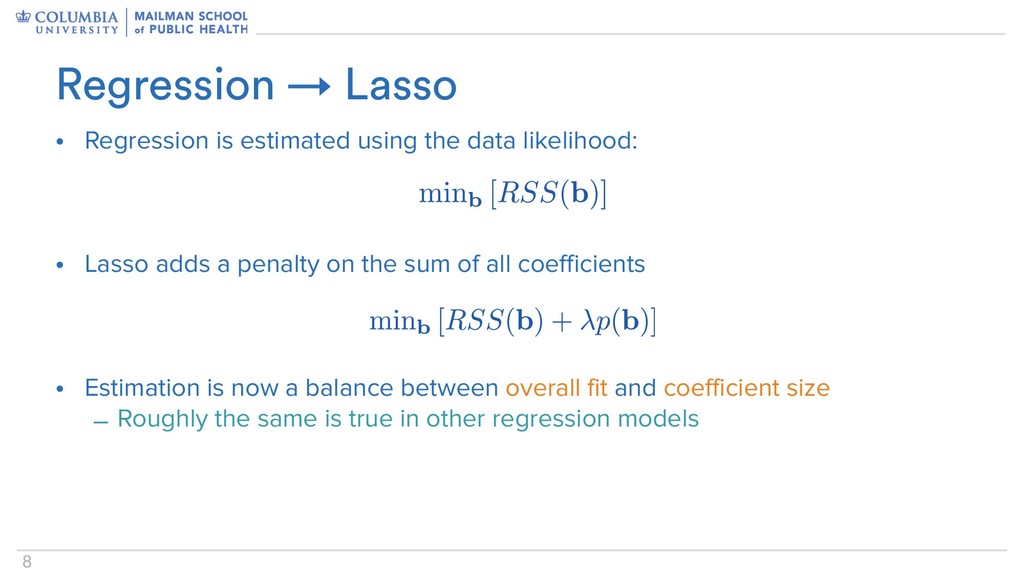
data likelihood: • Lasso adds a penalty on the sum of all coefficients • Estimation is now a balance between overall fit and coefficient size – Roughly the same is true in other regression models
inference / p-values – Very different interpretation (if any) – Have to choose the tuning parameter (to maximize prediction accuracy) – Coefficients for included covariates is not the same as in a regression using only those covariates These drawbacks are roughly similar across statistical learning methods
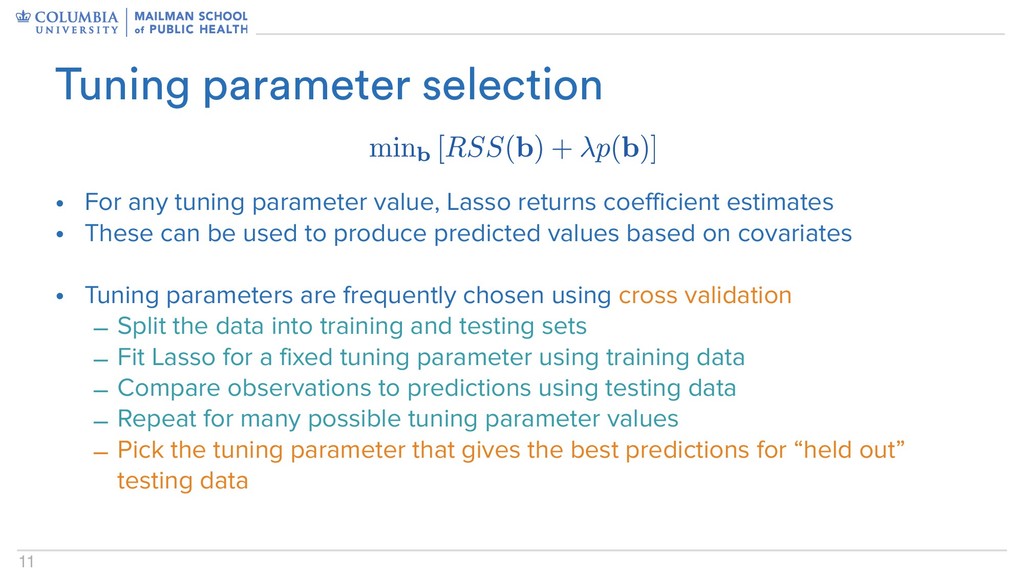
Lasso returns coefficient estimates • These can be used to produce predicted values based on covariates • Tuning parameters are frequently chosen using cross validation – Split the data into training and testing sets – Fit Lasso for a fixed tuning parameter using training data – Compare observations to predictions using testing data – Repeat for many possible tuning parameter values – Pick the tuning parameter that gives the best predictions for “held out” testing data
data-driven subgroups – Subgroups are non-overlapping, and every data point is in one subgroup – Data points in the same subgroup are more similar to each other than to points in another subgroup • Have to define “similarity” … • You can usually tell if clustering worked if it looks right • Lots of methods; we’ll look at k-means Clustering
groups, each with it’s own mean (“centroid”) – Put all data points in a group at random – Alternate between two steps: • Recompute group mean • Reassign points to the cluster with the closest centroid – Stop when things stop • Not a lot of guarantees here… K-means clustering
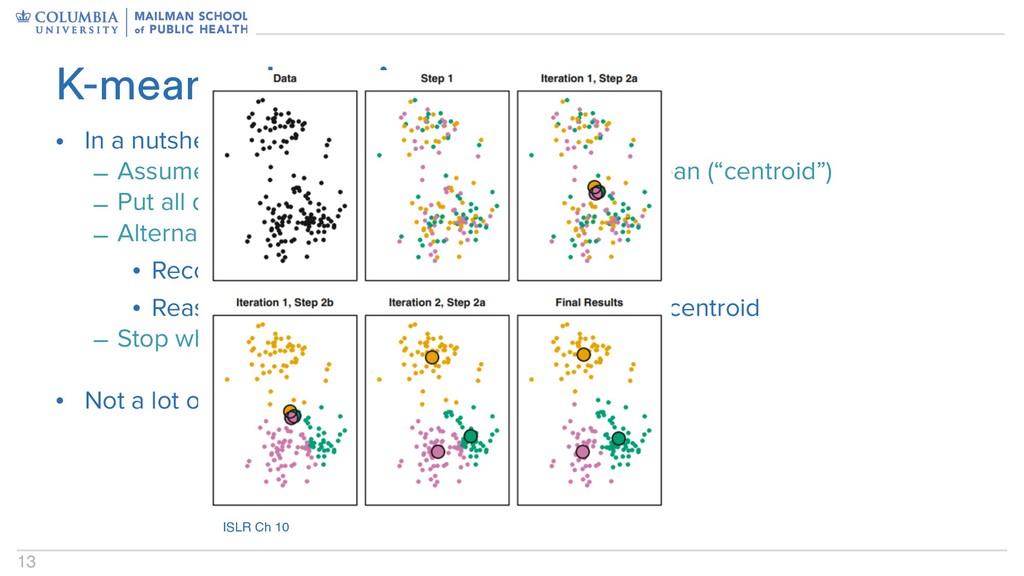
groups, each with it’s own mean (“centroid”) – Put all data points in a group at random – Alternate between two steps: • Recompute group mean • Reassign points to the cluster with the closest centroid – Stop when things stop • Not a lot of guarantees here… K-means clustering ISLR Ch 10
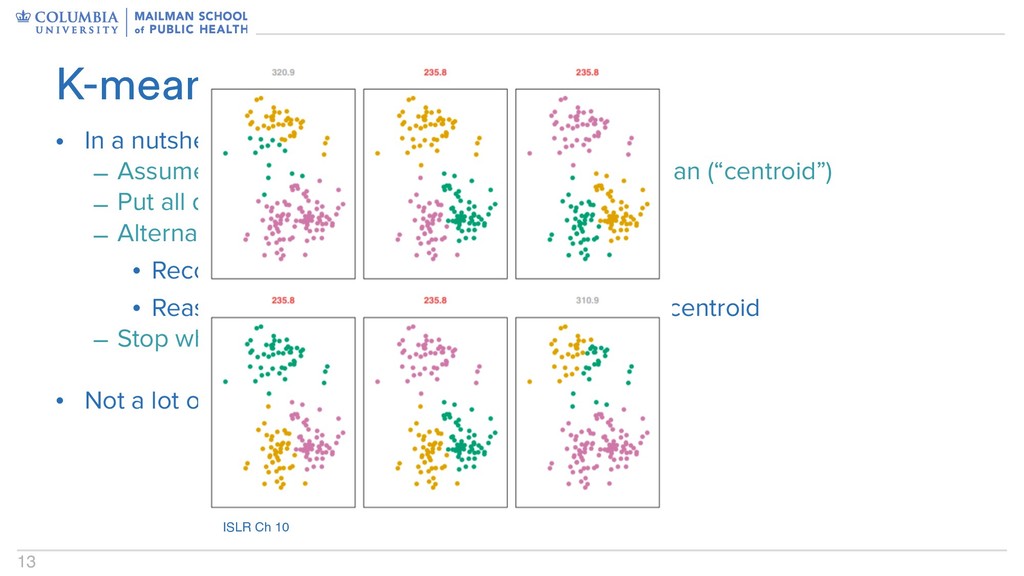
groups, each with it’s own mean (“centroid”) – Put all data points in a group at random – Alternate between two steps: • Recompute group mean • Reassign points to the cluster with the closest centroid – Stop when things stop • Not a lot of guarantees here… K-means clustering ISLR Ch 10