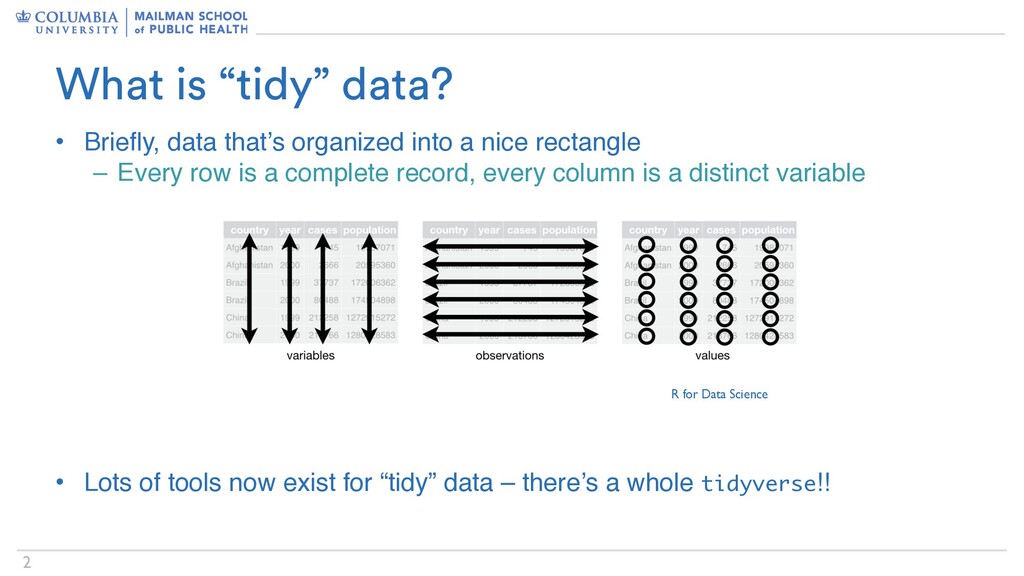
into a nice rectangle – Every row is a complete record, every column is a distinct variable • Lots of tools now exist for “tidy” data – there’s a whole tidyverse!! R for Data Science
for functional data don’t work in this format – Conceptually, whole functions are single “values” – Ideally, these would be stored in a single cell in a tidy data rectangle • Instead, we have … matrices? “Wide” or “long” data? • All of these are painful to work with, typically in distinct ways – Don’t encode anything “functional”, like temporal structure, interpolation methods, smoothing approaches, etc – Don’t work with the tidyverse (and often aren’t easy with Base R either)
and well-documented software to make functional data analysis in R easy • Specifically emphasizes data wrangling, exploratory analysis, and visualization • Integrates functional data with data frames containing other variables, enabling data manipulation using tidyverse tools
data type (tf) with useful subclasses (tfd and tfb) – tf vectors can be operated on using many standard functions (+, mean, etc.) – tidyfun introduces new functions for tf vectors (tf_smooth, tf_where, etc) • tidyfun also provides: – tidyverse verbs for handling functional data – especially inside data frames – Tools for converting between “old” data structures and tf vectors – New pasta-themed graphics functions for tf vectors and tidy functional data frames
with functional data • Intuitive exploratory data analysis • Slick visualizations, especially with ggplot • Coming soon – integration with robust functional data analysis pipelines • Stickers!