you as an analyst – True for you as a communicator • You should make dozens of graphics for each dataset – Most of these are for your eyes only – A (small) subset are for others A picture is worth 1000 words
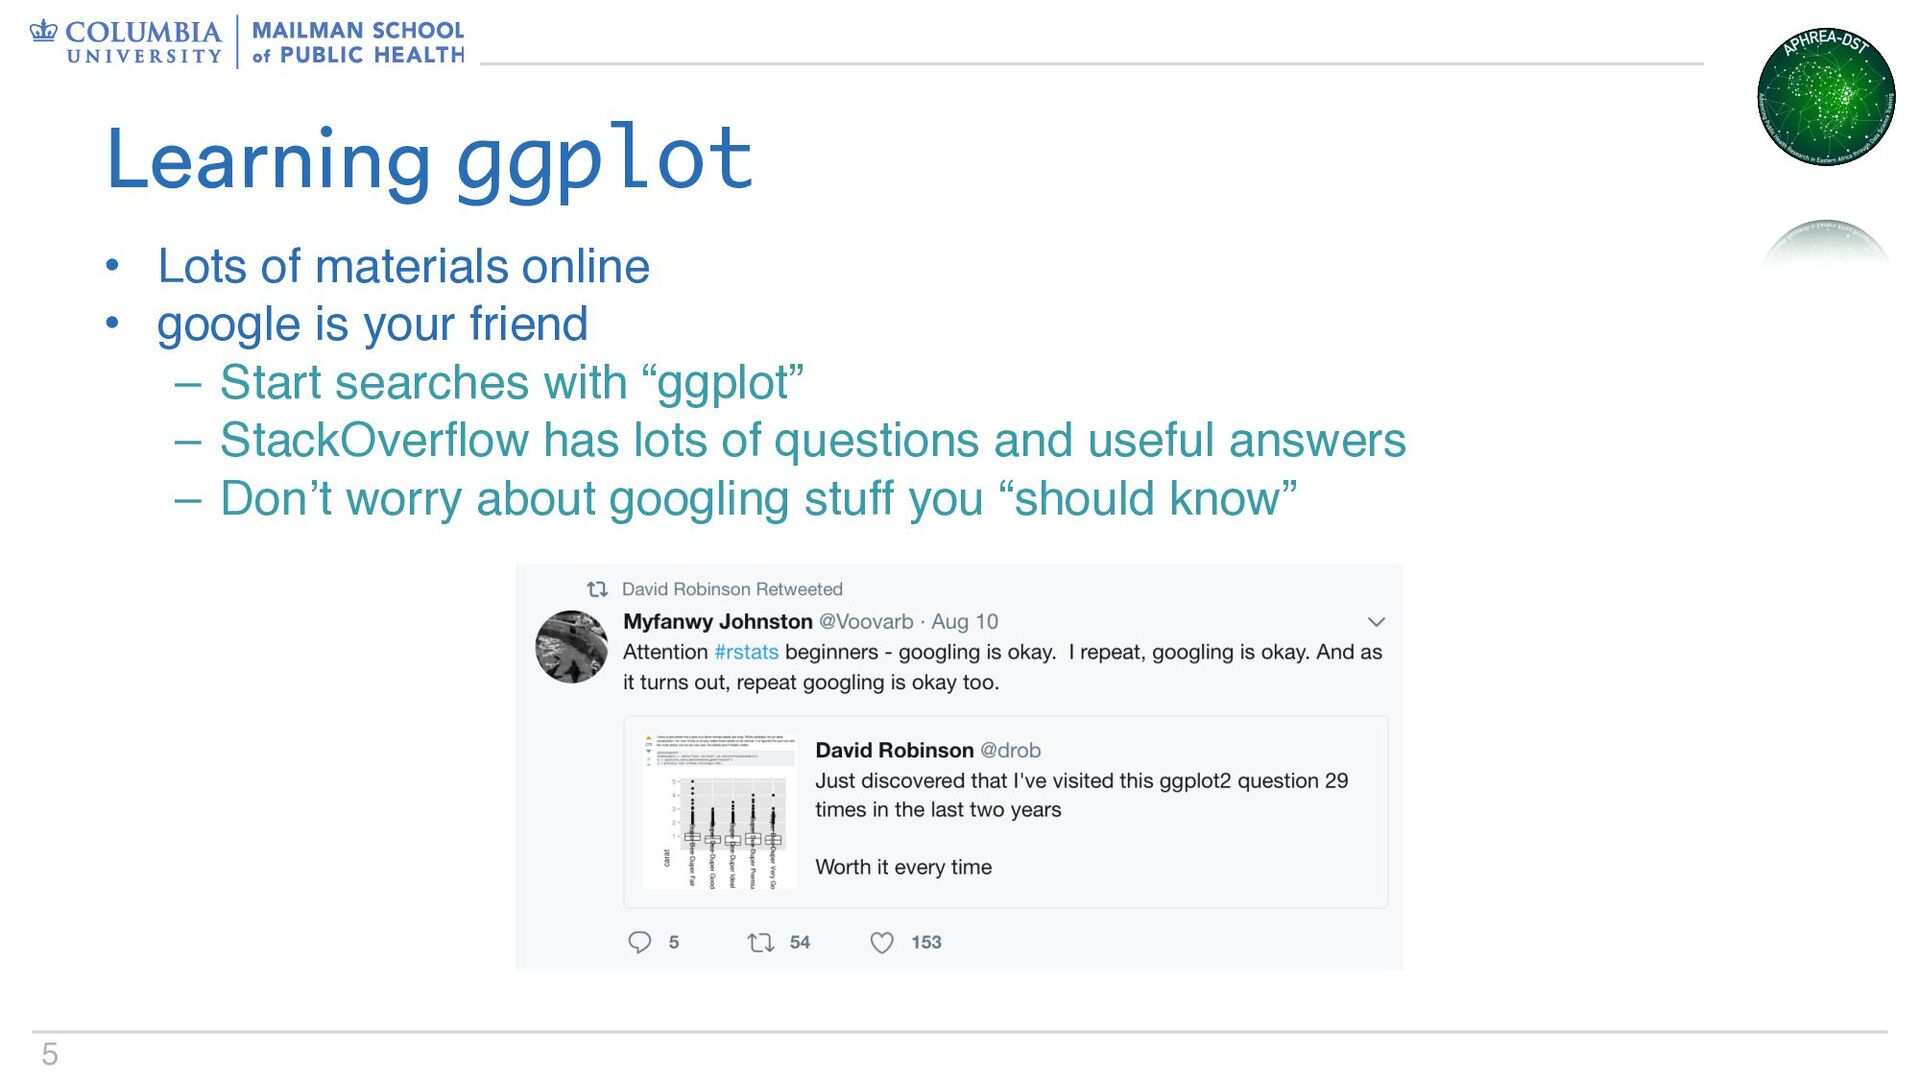
friend – Start searches with “ggplot” – StackOverflow has lots of questions and useful answers – Don’t worry about googling stuff you “should know” Learning ggplot
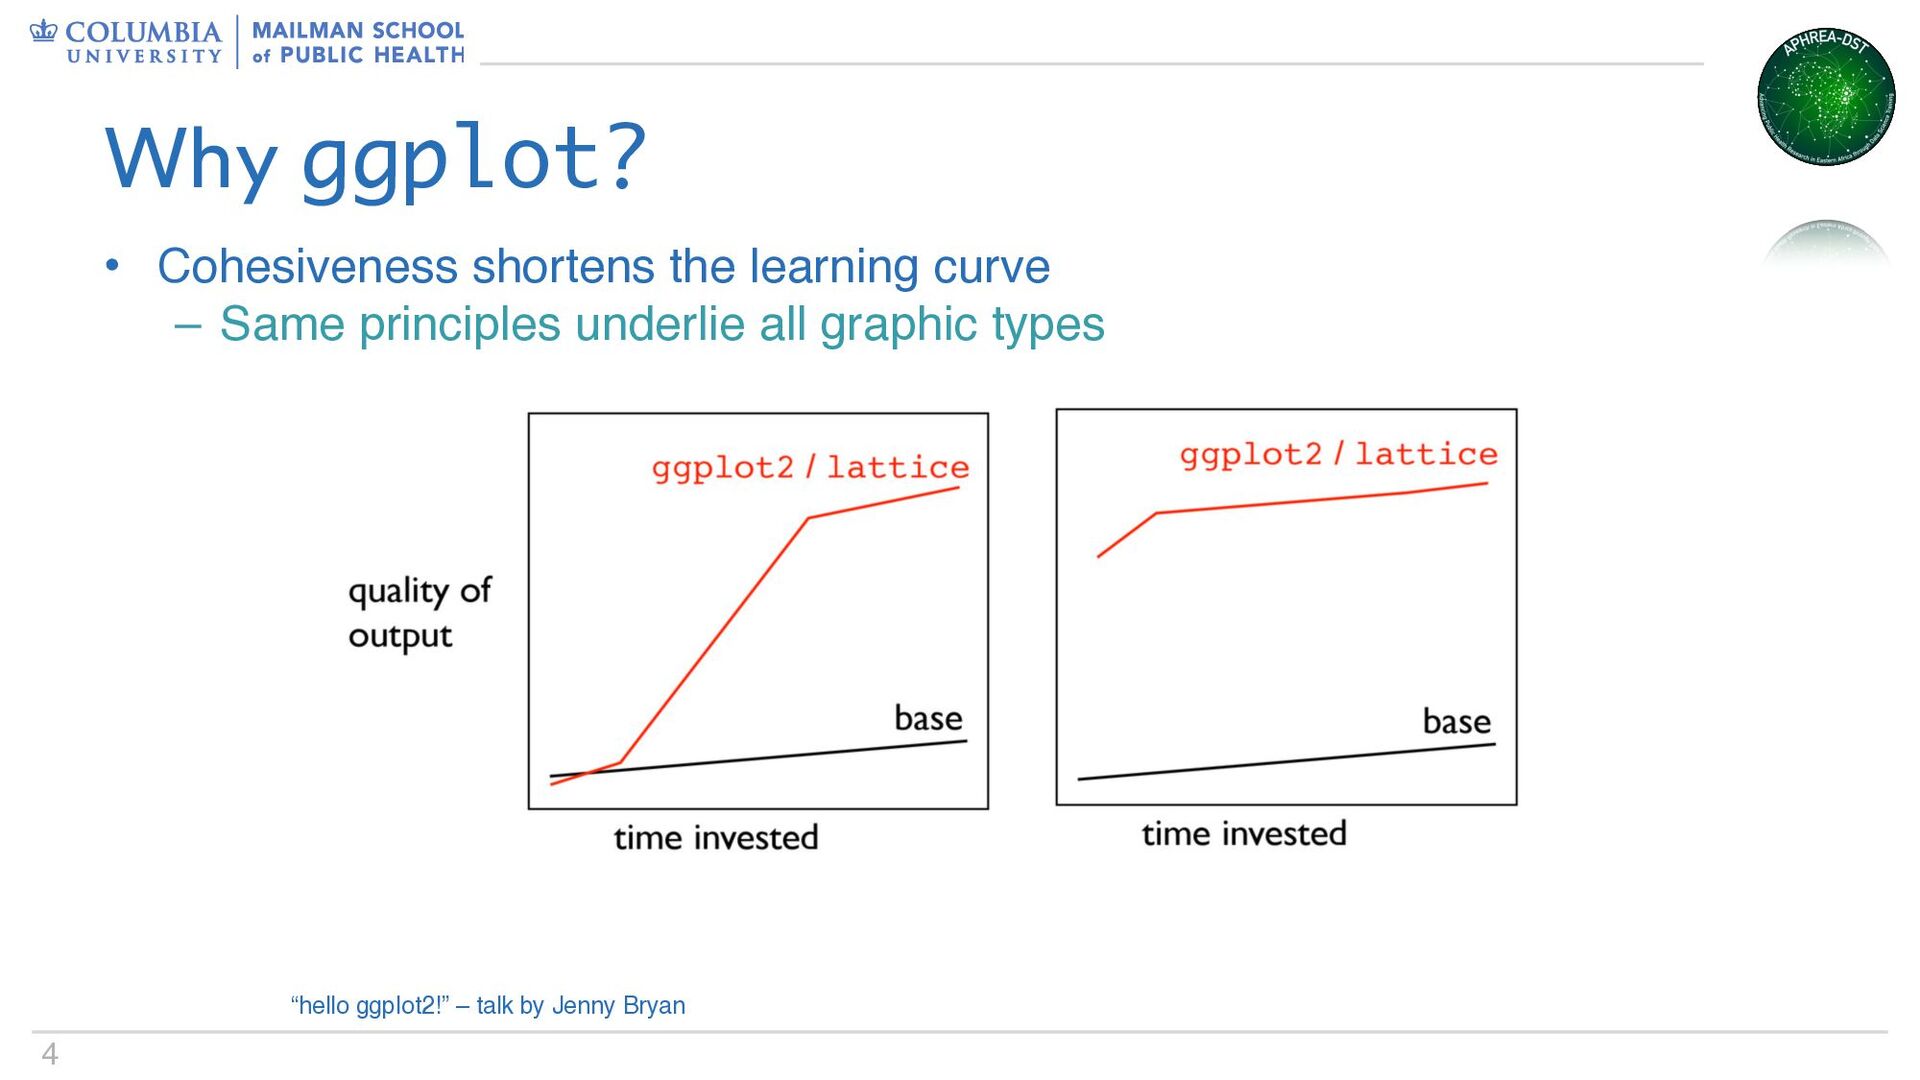
– geoms • Advanced graph components – facets – scales – statistics • A graph is built by combining these components • Components are consistent across graph types – Scatterplots, bar graphs, density plots, ridge plots … Using ggplot