• They’re rarely even in the form you need • The process of taking data in whatever form they exist and transforming them to the form you need is “wrangling” Data wrangling
isn’t a way around the need to load, organize, and transform data • If you expect someone to do this for you, that person will also do the rest of your job You’re going to have to wrangle
subject – Column = variable • The variables may be of different types • In R, data.frames are designed to hold this kind of dataset – Looks like a matrix – Actually a very specific list Data tables
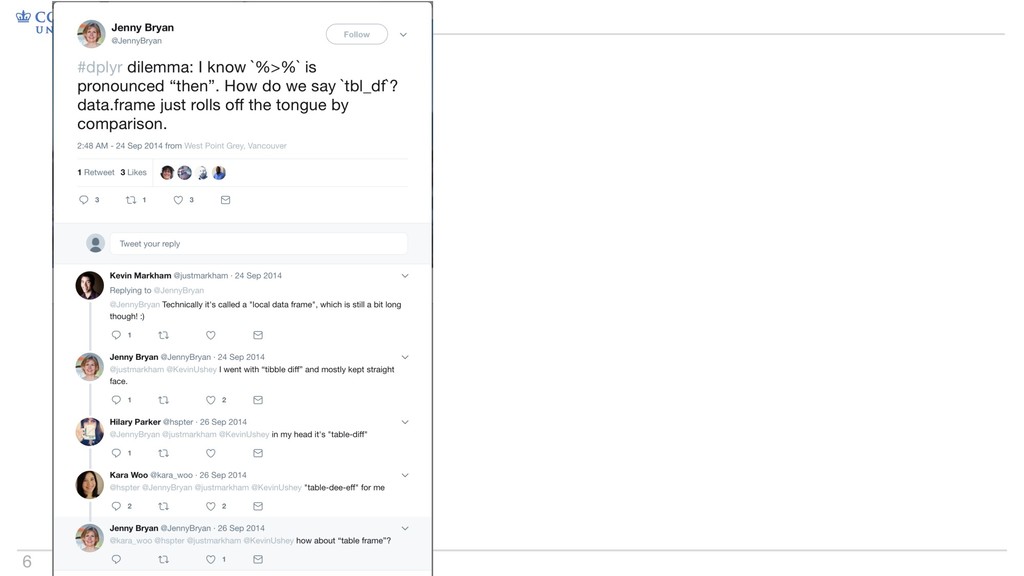
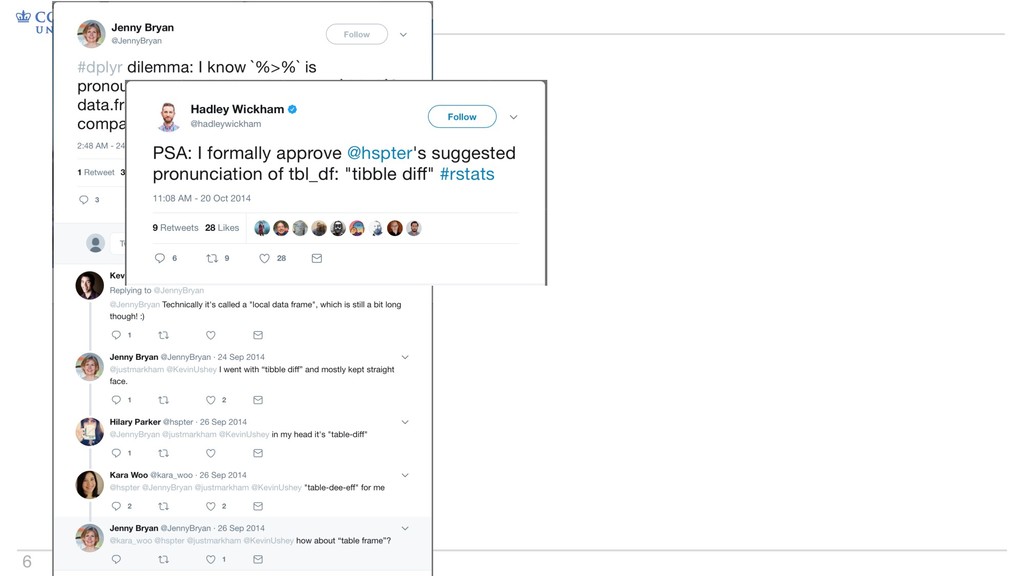
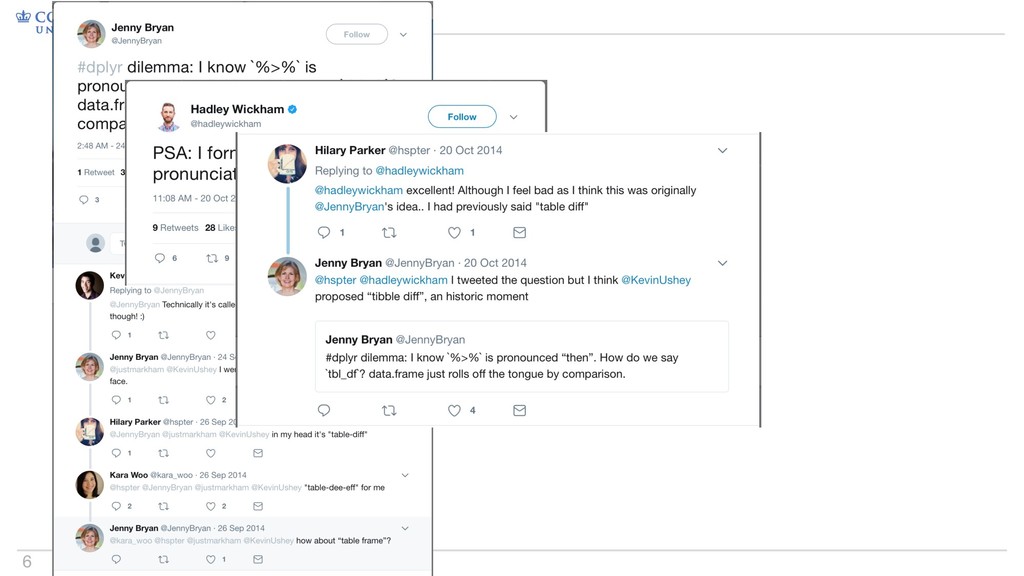
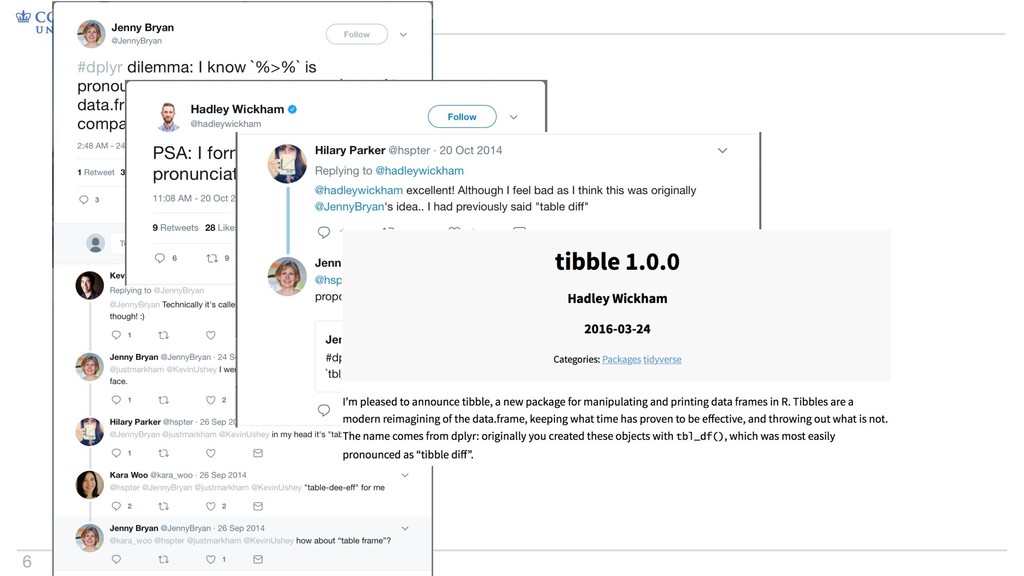
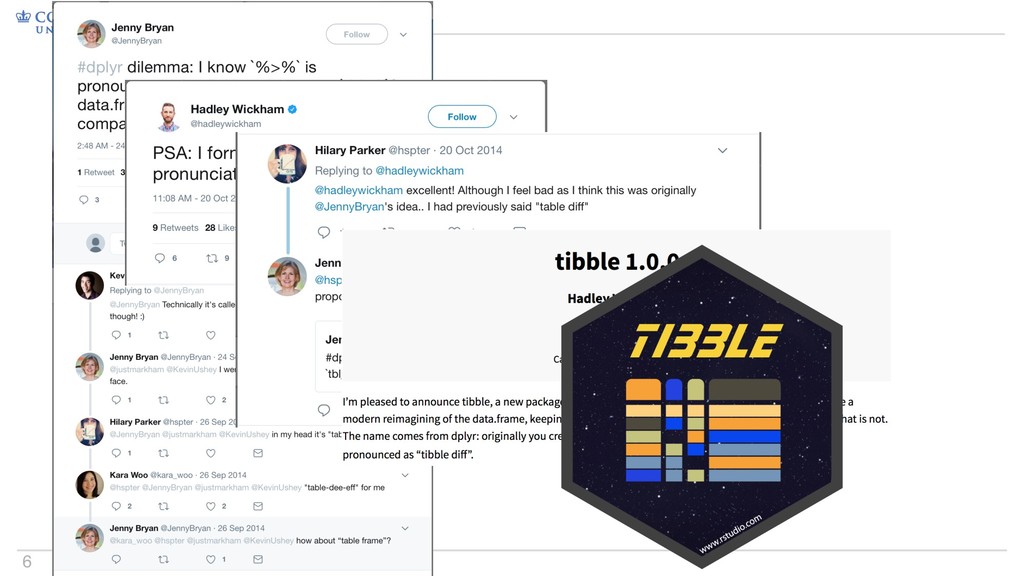
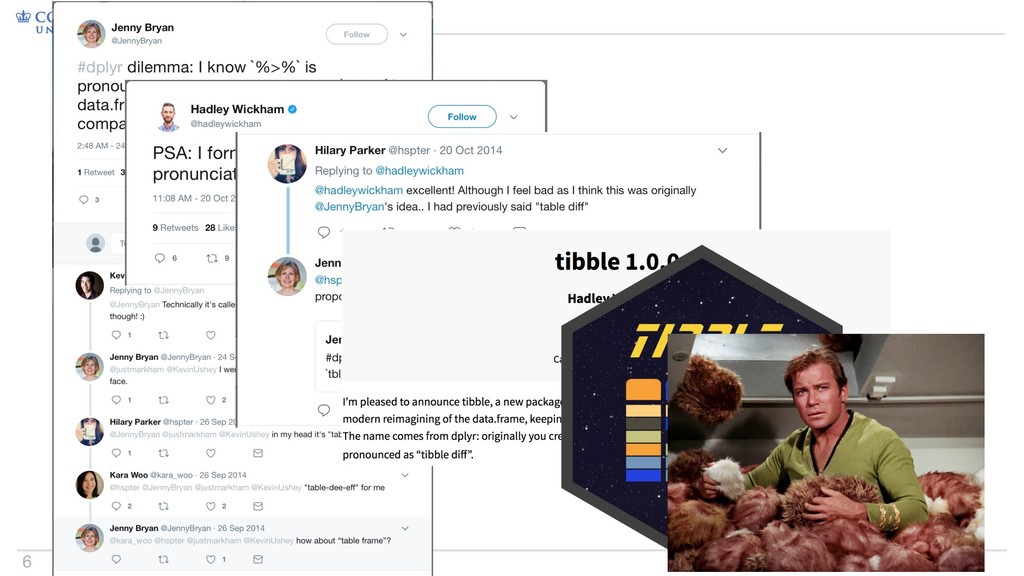
• Some things change; base R is not one of those things • Tibbles are data frames, just slightly different – They keep you from printing everything by accident – They make you type complete variable names Why tibbles?
cases will take up a lot of time • You still have to learn to handle the easy cases – readr, haven, readxl – Parsing columns can be helpful – Watch out for inconsistencies in columns – Be sure you know what missing data looks like 80/20 applies to data import
data possible • This gives you the ability to transform the data yourself • This does not mean you are less likely to make mistakes in cleaning data than someone else – Your mistakes should be transparent – Fixing them shouldn’t hurt your analysis pipeline • Cleaning data is also how you really get to know it “Raw” data