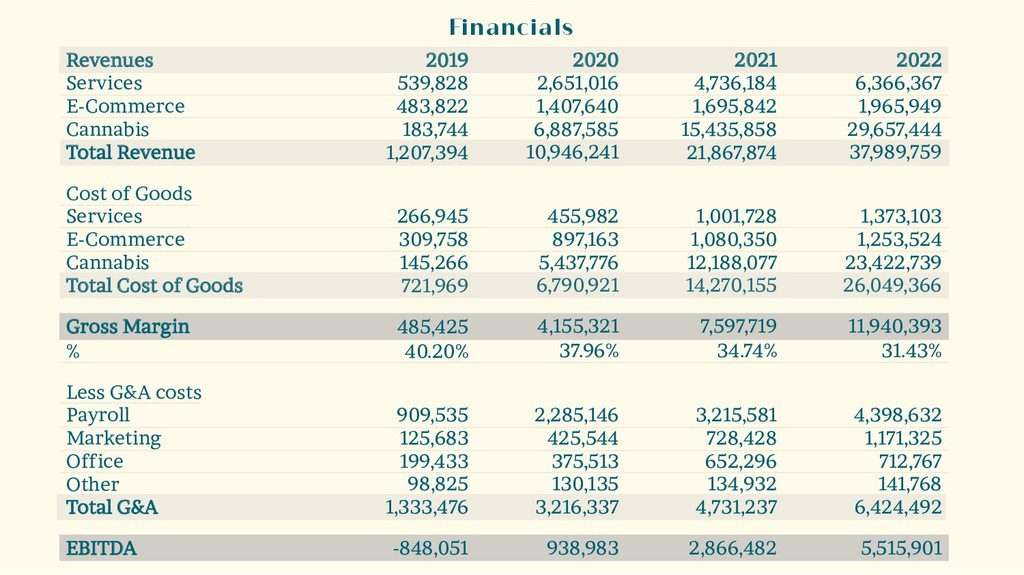
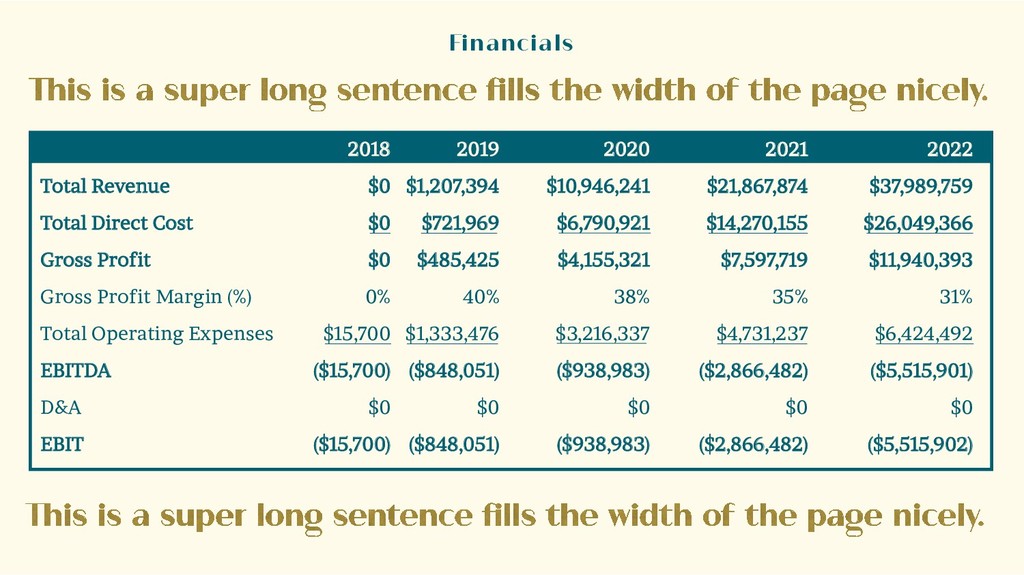
gize, and balance the body, including hemp derived CBD. Revenues Services E-Commerce Cannabis Total Revenue Cost of Goods Services E-Commerce Cannabis Total Cost of Goods Gross Margin % Less G&A costs Payroll Marketing Office Other Total G&A EBITDA Financials 2019 539,828 483,822 183,744 1,207,394 266,945 309,758 145,266 721,969 485,425 40.20% 909,535 125,683 199,433 98,825 1,333,476 -848,051 2020 2,651,016 1,407,640 6,887,585 10,946,241 455,982 897,163 5,437,776 6,790,921 4,155,321 37.96% 2,285,146 425,544 375,513 130,135 3,216,337 938,983 2021 4,736,184 1,695,842 15,435,858 21,867,874 1,001,728 1,080,350 12,188,077 14,270,155 7,597,719 34.74% 3,215,581 728,428 652,296 134,932 4,731,237 2,866,482 2022 6,366,367 1,965,949 29,657,444 37,989,759 1,373,103 1,253,524 23,422,739 26,049,366 11,940,393 31.43% 4,398,632 1,171,325 712,767 141,768 6,424,492 5,515,901


 jennifer29292
 speakerdeck
 reverentgeek
 kimpetersen
 morganepeng
 irinanazarova
 schlessera
 marcduiker
 addyosmani
 lara
 destraynor
 bermonpainter
 gurzu