Upgrade to Pro — share decks privately, control downloads, hide ads and more …

A Development Analytics Dashboard For Apache CloudStack

A Development Analytics Dashboard For Apache CloudStack

Talk at ApacheCon Europe 2014, Budapest (Hungary), Nov. 17th 2014.

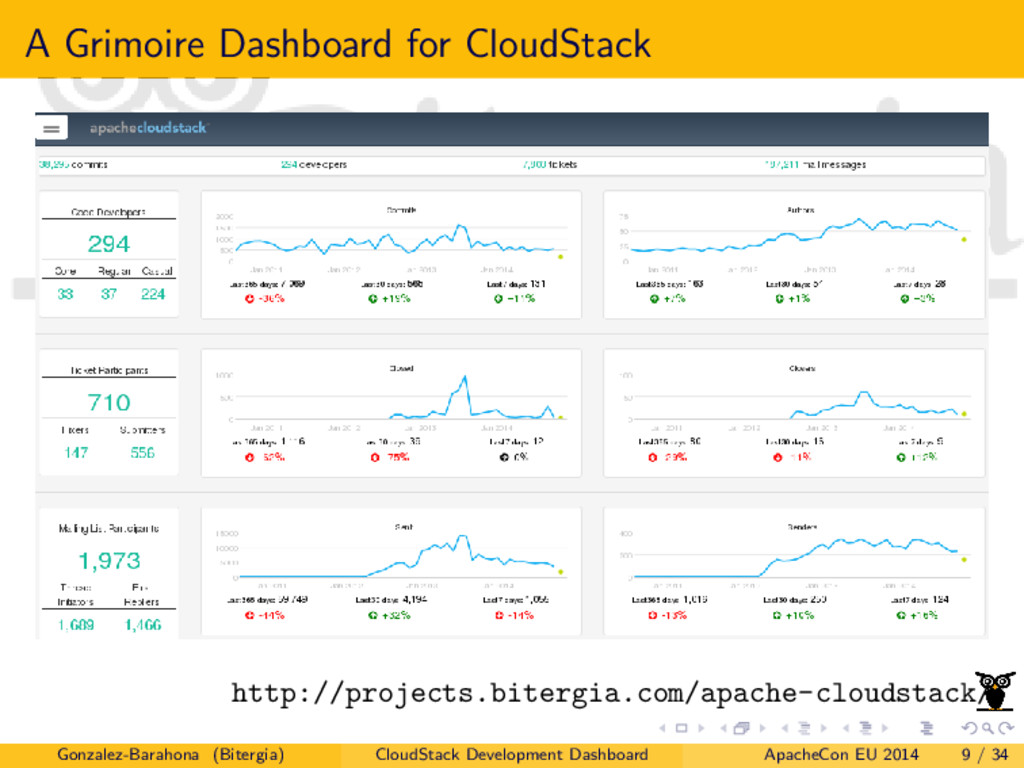
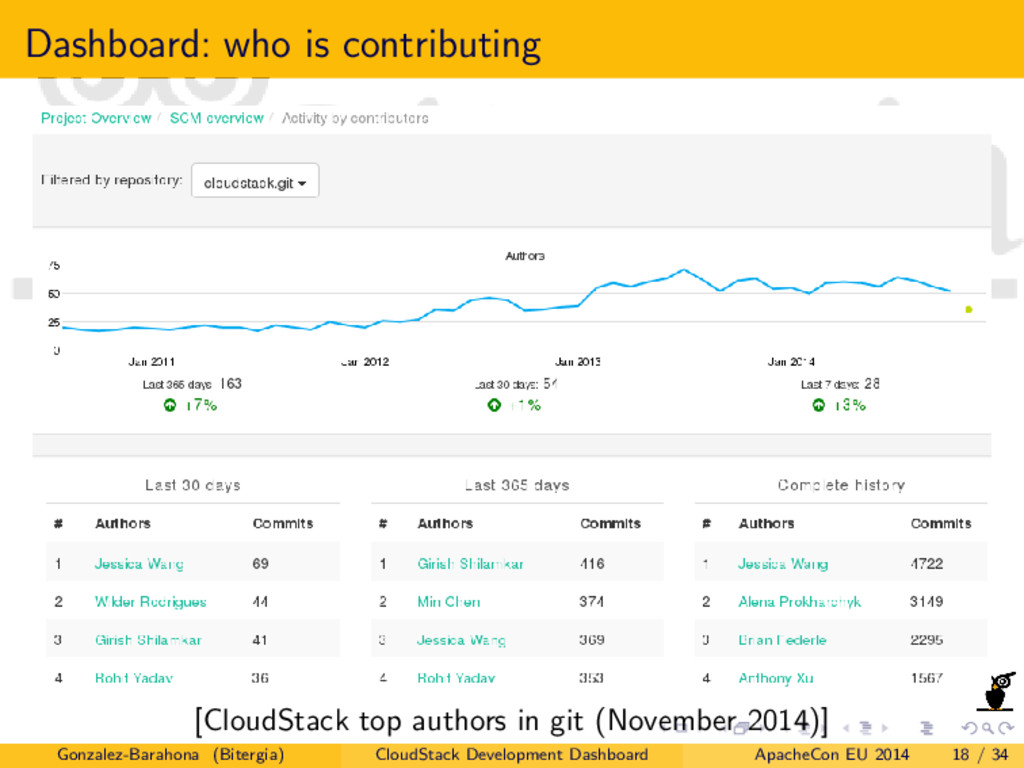
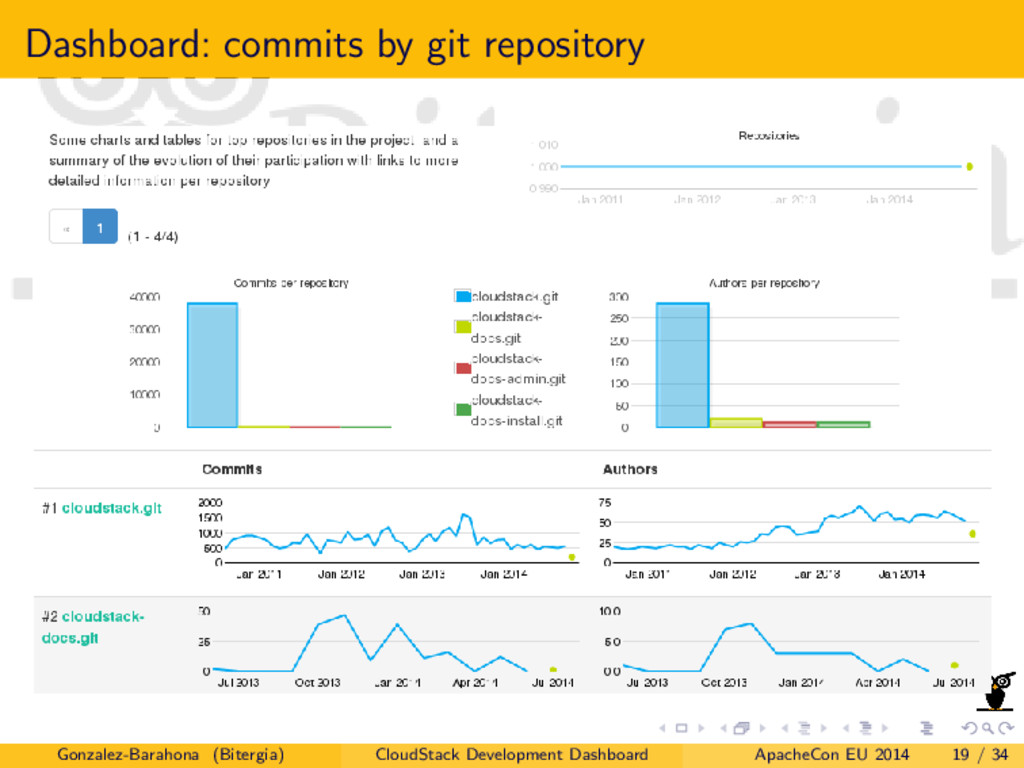
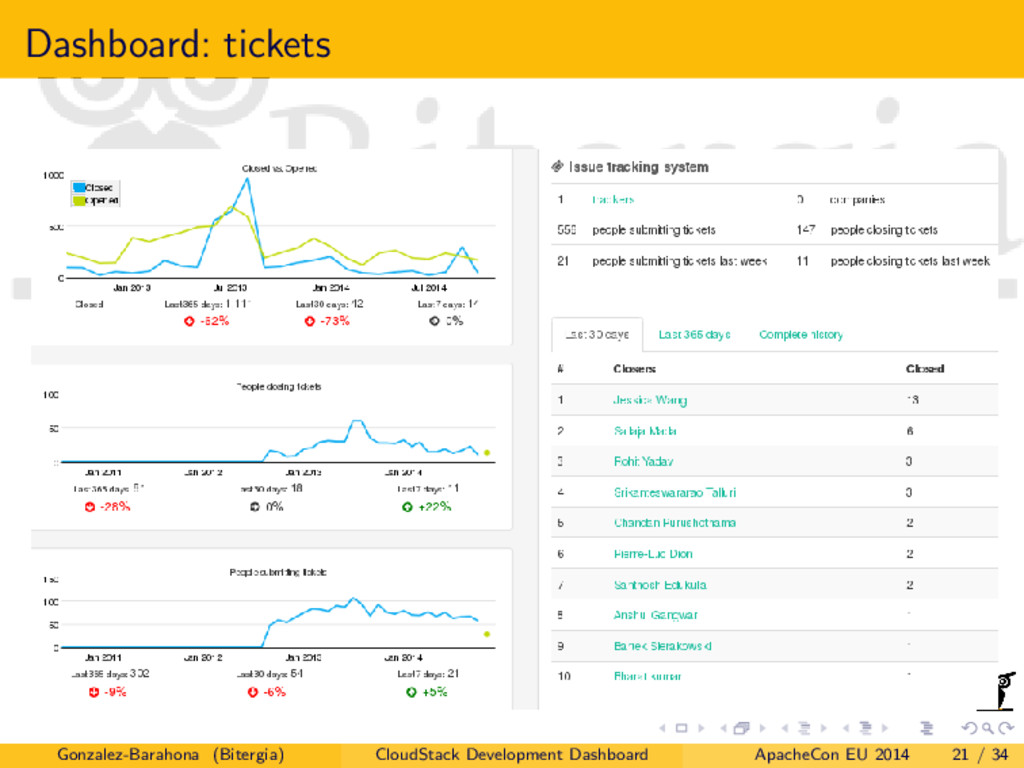
The Apache CloudStack Development Analytics Dashboard helps to better understand how the project is evolving and performing. Using information from git, Jira and mailing lists, several charts and numbers provide some insight on relevant parameters of the project. The talk will explain the meaning of the different panels in the dashboard, and will use them and some complementary quantitative data to analyze specific aspects of the inner life of the project. Those will be used to describe the CloudStack community, its activity, and some of their most important development processes.

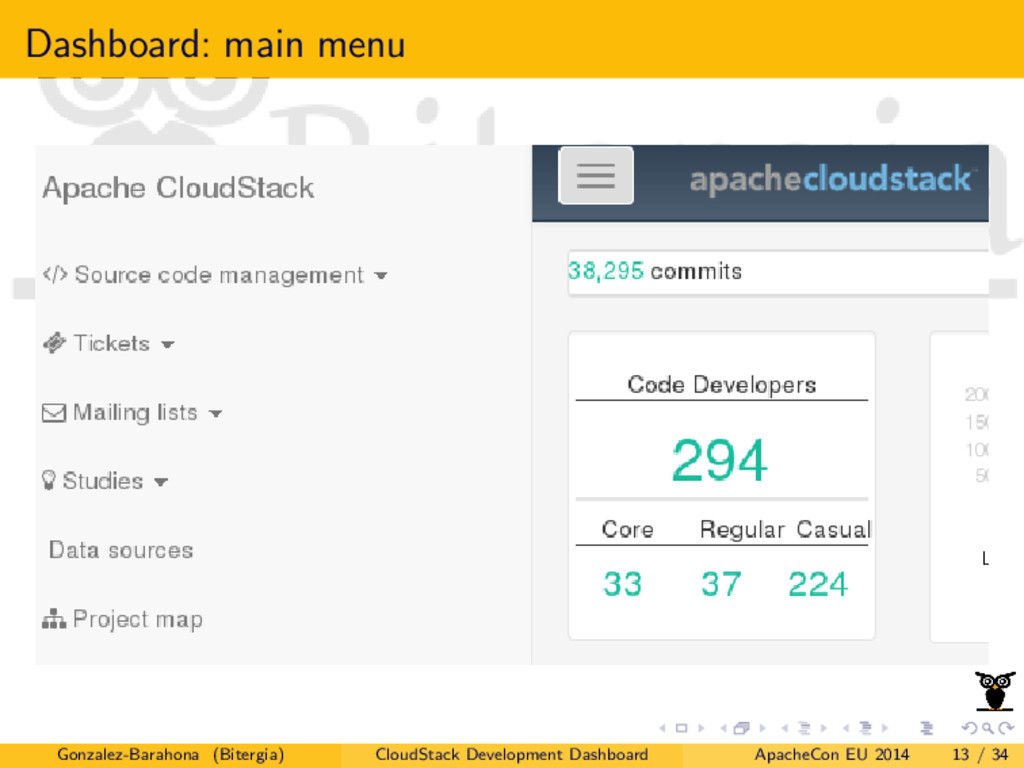
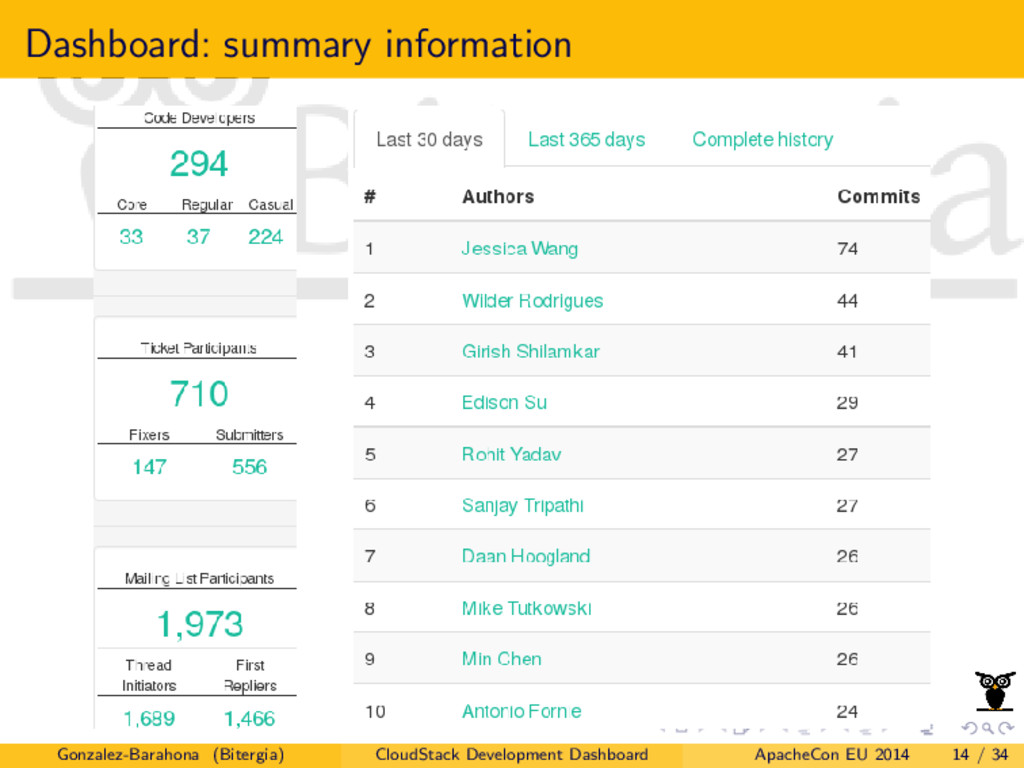
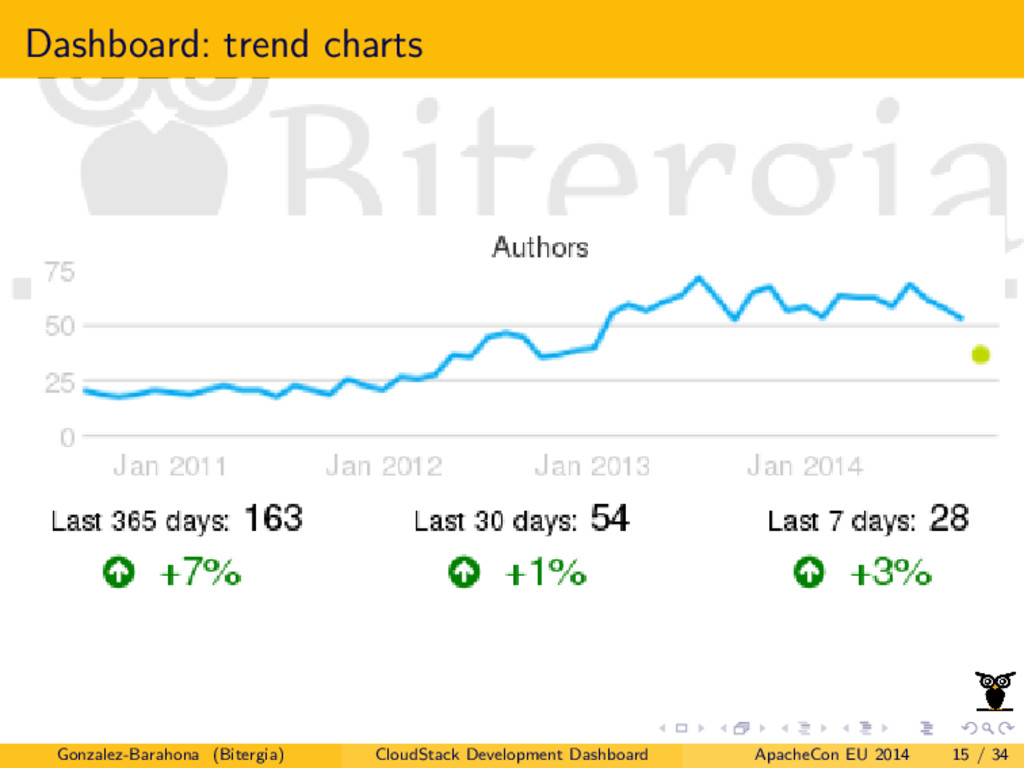
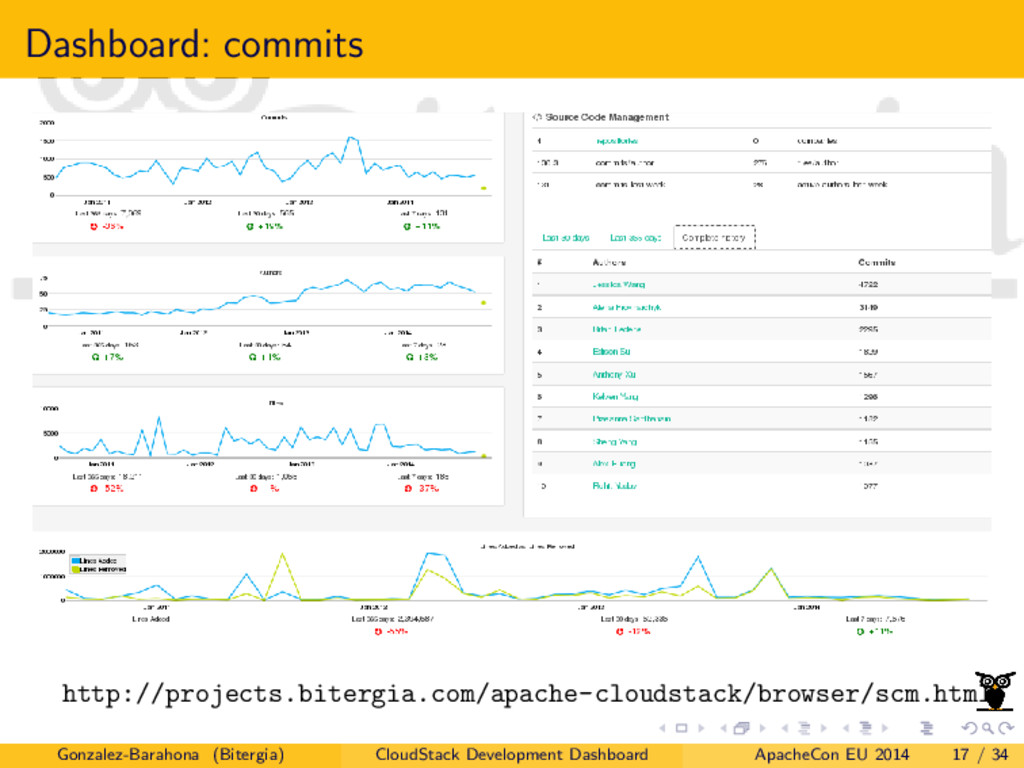
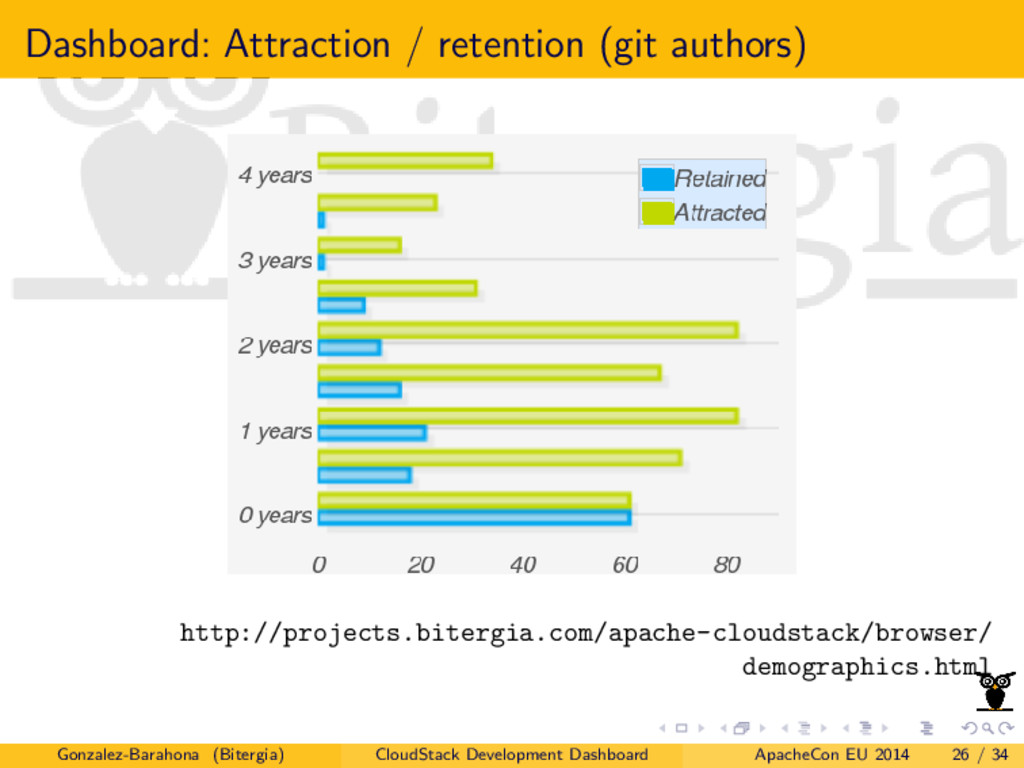
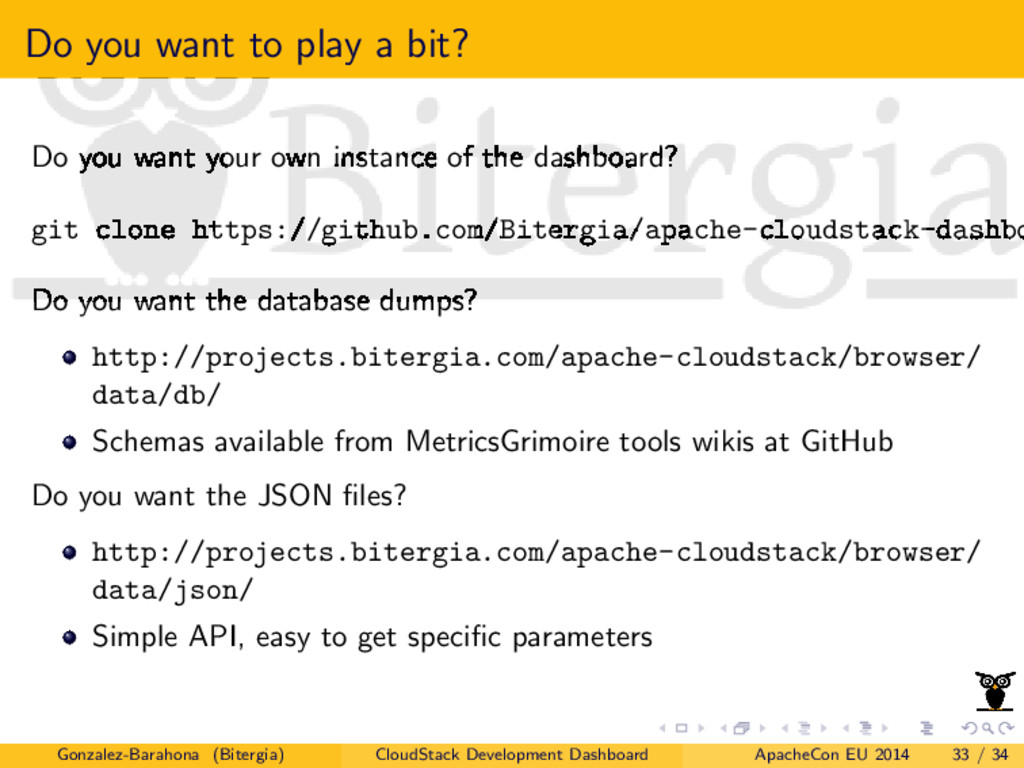
CloudStack Dashboard: http://projects.bitergia.com/apache-cloudstack/browser/

Jesus M. Gonzalez-Barahona

November 16, 2014
Tweet

More Decks by Jesus M. Gonzalez-Barahona

Other Decks in Technology

Transcript

  1. A Development Analytics Dashboard For Apache CloudStack Jesus M. Gonzalez-Barahona

    [email protected] Twitter: @jgbarah Bitergia http://bit.ly/cloudstack-dashboard ApacheCon Europe 2014 Budapest (Hungary), November 17th 2014 Gonzalez-Barahona (Bitergia) CloudStack Development Dashboard ApacheCon EU 2014 1 / 34
  2. Structure of the presentation 1 Why a software development dashboard?

    2 The CloudStack Development Dashboard 3 Browsing the data 4 Browsing the data: git 5 Browsing the data: Jira 6 Browsing the data: other 7 Bonus track 8 Final remarks Gonzalez-Barahona (Bitergia) CloudStack Development Dashboard ApacheCon EU 2014 2 / 34
  3. From open development to open development analytics Information about code,

    community, development for open development projects can be retrieved, organized, analyzed Let’s publish analytics results & data Open Development Analytics: A new standard for transparency Gonzalez-Barahona (Bitergia) CloudStack Development Dashboard ApacheCon EU 2014 4 / 34
  4. Who makes a project successful? Persons (and organizations) with different

    interests common goals Need for coordination, common decision making Availability of data as a tool: Transparency to the community (fairness) Transparency to third parties (trust) Gonzalez-Barahona (Bitergia) CloudStack Development Dashboard ApacheCon EU 2014 5 / 34
  5. Assessing transparency Development communities: companies and developers working together Policies,

    procedures, tools, source code... and development data Do they really provide enough data to enable assessment? Analysis of all repositories (data sources)... ...and associated information (eg: affiliation) Gonzalez-Barahona (Bitergia) CloudStack Development Dashboard ApacheCon EU 2014 6 / 34
  6. Examples of areas of interest Performance (understanding activity) Company participation

    (beyond copyright notices) Transparency (available information) Auditing (certify participation, experience, etc.) Profiling (key people, companies) Neutrality (fair treatment) Gonzalez-Barahona (Bitergia) CloudStack Development Dashboard ApacheCon EU 2014 7 / 34
  7. Tools: Grimoire system MetricsGrimoire: Free software for retrieving data from

    repositories vizGrimoire (GrimoireLib, vizGrimoireJS): Free software for analyzing, visualizing data Grimoire Dashboard: Many panels, different views of the project (charts, summaries, statistic analysis) Commercially supported by Bitergia http://metricsgrimoire.github.com http://vizgrimoire.github.com Gonzalez-Barahona (Bitergia) CloudStack Development Dashboard ApacheCon EU 2014 10 / 34
  8. Dashboard: who is contributing [CloudStack top authors in git (November

    2014)] Gonzalez-Barahona (Bitergia) CloudStack Development Dashboard ApacheCon EU 2014 18 / 34
  9. Time zone analysis (1) 15 10 5 0 5 10

    15 tz 0 50 100 150 200 authors 15 10 5 0 5 10 15 tz 0 50 100 150 200 250 300 350 400 450 authors [Posters in mailing lists per time zone (2012, 2014)] Gonzalez-Barahona (Bitergia) CloudStack Development Dashboard ApacheCon EU 2014 30 / 34
  10. Time zone analysis (2) 15 10 5 0 5 10

    15 tz 0 5 10 15 20 25 30 authors 15 10 5 0 5 10 15 tz 0 10 20 30 40 50 60 authors [Authors in git repos per time zone (2010, 2014)] Gonzalez-Barahona (Bitergia) CloudStack Development Dashboard ApacheCon EU 2014 31 / 34
  11. Do you want to play a bit? Do you want

    your own instance of the dashboard? git clone https://github.com/Bitergia/apache-cloudstack-dashbo Do you want the database dumps? http://projects.bitergia.com/apache-cloudstack/browser/ data/db/ Schemas available from MetricsGrimoire tools wikis at GitHub Do you want the JSON files? http://projects.bitergia.com/apache-cloudstack/browser/ data/json/ Simple API, easy to get specific parameters Gonzalez-Barahona (Bitergia) CloudStack Development Dashboard ApacheCon EU 2014 33 / 34
  12. Polishing the final version Still (and continuously) fixing bugs, adding

    new functionality improving performance Your feedback is welcome!!! https://github.com/Bitergia/apache-cloudstack-dashboard/issues Gonzalez-Barahona (Bitergia) CloudStack Development Dashboard ApacheCon EU 2014 34 / 34