Upgrade to Pro — share decks privately, control downloads, hide ads and more …

Things Your Application Does While You're Not Looking (Lone Star PHP 2015)

Things Your Application Does While You're Not Looking (Lone Star PHP 2015)

Josh Butts

April 17, 2015
Tweet

More Decks by Josh Butts

Other Decks in Technology

Transcript

  1. Things  Your  Application  Does  
    While  You’re  Not  Looking
    Josh Butts
    VP of Engineering

    View Slide

  2. About  Me
    • VP  of  Engineering

    at  Offers.com  
    • Austin  PHP  Organizer  
    •            github.com/jimbojsb                              
    •              @jimbojsb
    2

    View Slide

  3. About  Offers.com
    • We  help  people  save  money  
    • Launched  in  2009  
    • 50k  line  ZF1  application  
    • Millions  of  Uniques  /  Month
    3

    View Slide

  4. Agenda
    • What  is  application  health?  
    • How  can  we  collect  data  to  
    determine  if  our  application  is  
    healthy  
    • How  can  we  make  this  data  
    actionable?
    4

    View Slide

  5. What  is  application  health?
    • Depends  on  who  you  ask  
    • Combination  of  performance  and  
    quality  
    – Uptime  
    – Response  time  
    – Error  rate
    5

    View Slide

  6. Uptime
    • Set  realistic  expectations  -­‐  no  one  
    is  up  100%  of  the  time  
    • How  many  9’s  can  you  tolerate?  
    • Measure  uptime  monthly  
    • Planned  maintenance  counts!
    6

    View Slide

  7. Up  isn’t  good  enough,  but  it’s  a  start
    • Ping  
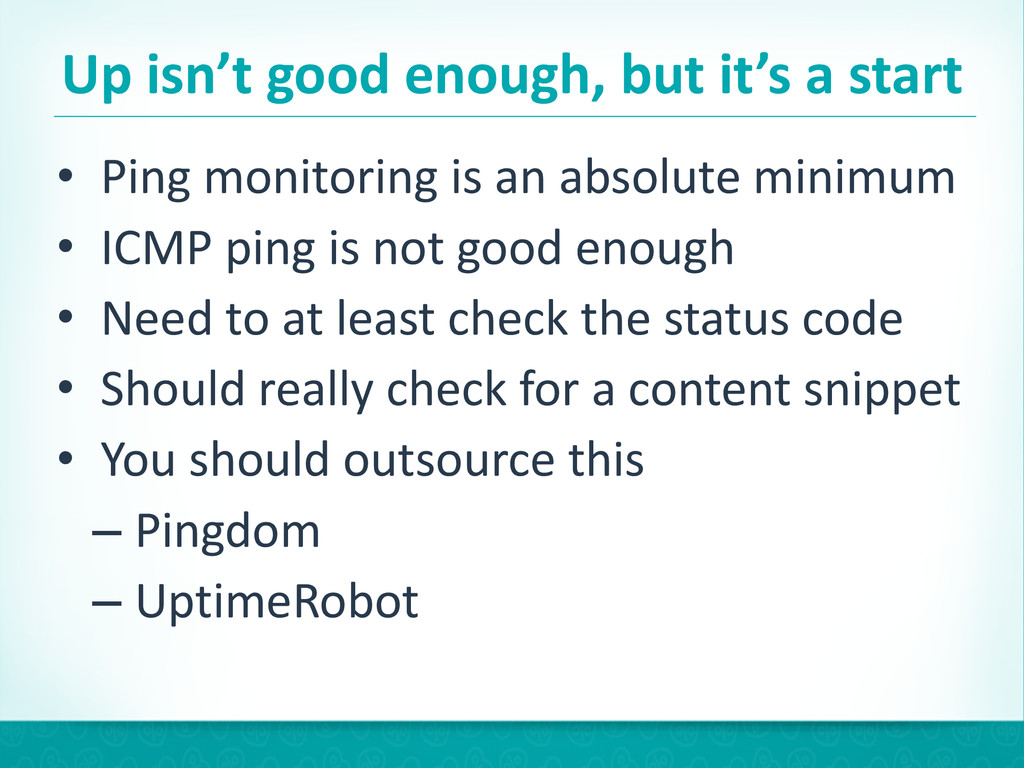
monitoring  is  an  absolute  minimum  
    • ICMP  ping  is  not  good  enough  
    • Need  to  at  least  check  the  status  code  
    • Should  really  check  for  a  content  snippet  
    • You  should  outsource  this  
    – Pingdom  
    – UptimeRobot
    7

    View Slide

  8. Error  Rate
    • Number  of  requests  that  generate  an  
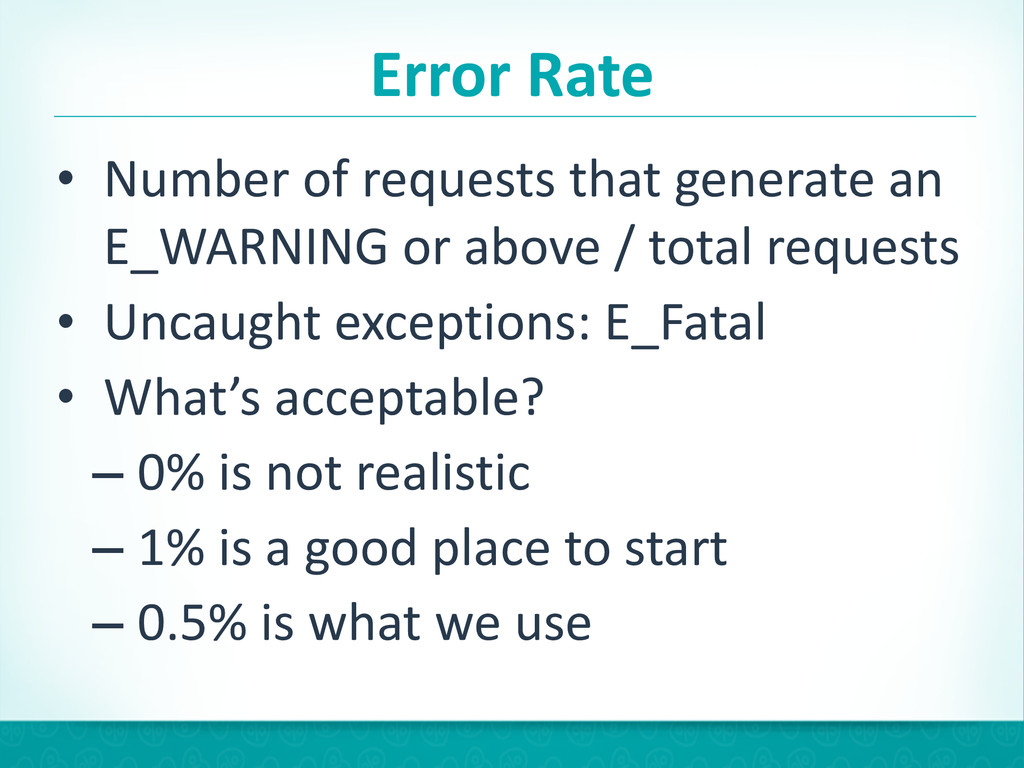
    E_WARNING  or  above  /  total  requests  
    • Uncaught  exceptions:  E_Fatal  
    • What’s  acceptable?  
    – 0%  is  not  realistic  
    – 1%  is  a  good  place  to  start  
    – 0.5%  is  what  we  use
    8

    View Slide

  9. Why  Error  Rate  is  Hard
    • PHP  error  handlers  are  terrible  
    • You  really  need  an  extension  
    • There  are  a  few  third  party  tools  
    that  do  this,  but  they  aren’t  cheap
    9

    View Slide

  10. Silent  Killers
    • Does  a  caught  exception  count  as  
    towards  your  error  rate?  
    • How  many  times  do  you  drop  the  
    exception?  
    • Would  you  even  know  if  your  password  
    reset  page  was  throwing  a  500  error?  
    • Even  the  best  testing  can’t  fix  stupid  
    users
    10

    View Slide

  11. APPLICATION  LOGS
    11

    View Slide

  12. Application  Logs
    • Logs  are  your  best  source  for  
    debugging  production  errors  
    • Log  facts  
    • Speak  to  your  future  self  
    • Use  a  service  or  tool  to  aggregate  
    logs
    12

    View Slide

  13. Log  Highlights
    • Be  wordy,  but  avoid  pointless  
    words  
    • Take  advantage  of  log  levels  
    • Take  advantage  of  different  
    application  environments  
    • Keep  your  logs  to  “one-­‐liners”
    13

    View Slide

  14. Log  Levels
    • DEBUG    
    • INFO  
    • NOTICE  
    • WARNING  
    • ERROR  
    • CRITICAL  
    • ALERT  
    • EMERGENCY
    14

    View Slide

  15. DEBUG
    • Most  detailed  and  verbose  level  
    • Database  queries  
    • “per-­‐item”  information  in  a  loop  
    • Probably  turn  this  off  in  production
    15

    View Slide

  16. INFO
    • This  is  the  “default”  for  most  things  
    • General  events  
    – user  logins  
    – application  state  changes  
    – material  domain  object  
    modifications
    16

    View Slide

  17. NOTICE
    • Like  INFO  but  slightly  more  
    important  
    • You  might  actually  care  about  these  
    • Transactions  with  values  that  are  
    normal  but  higher  or  lower  than  
    expected  
    • Might  review  these  weekly
    17

    View Slide

  18. WARN
    • Undesired  behavior  that  isn’t  
    necessarily  wrong  
    • Calling  deprecated  APIS  
    • Unexpected  null  result  sets
    18

    View Slide

  19. ERROR
    • Runtime  logic  errors  
    • Unexpected  invalid  arguments  
    • Caught  exceptions  
    • Doesn’t  require  immediate  
    attention  
    • Look  at  these  daily
    19

    View Slide

  20. CRITICAL
    • First  level  where  you  should  
    consider  real-­‐time  notifications  
    • Unable  to  connect  to  a  3rd  party  
    service  
    • Connection  timeouts  
    • High  latency
    20

    View Slide

  21. ALERT
    • Application  is  partially  down  or  
    non-­‐functional  
    • Failed  to  connect  to  a  critical  
    internal  resource  
    • This  should  send  SMS  messages,  
    wake  people  up  
    • Recommend  a  time  threshold
    21

    View Slide

  22. EMERGENCY
    • Everything  has  gone  to  hell  
    • Hardware  failures  
    • Wake  everyone  up,  keep  calling  
    until  someone  acknowledges  
    • Rare  to  see  this,  because  logging  
    has  probably  also  failed
    22

    View Slide

  23. PHP  Logging  Software
    • Monolog    
    • Pretty  much  everyone  uses  this  
    one  
    • Log4PHP  
    • Pretty  much  no  one  uses  this  one  
    • The  one  that  comes  with  your  
    favorite  framework
    23

    View Slide

  24. Basic  Monolog  Setup
    24
    $loggerName = 'myapp';
    $logger = new \Monolog\Logger($loggerName);

    View Slide

  25. Useful  Monolog  Setup
    25
    $loggerName = 'myapp';
    $logger = new \Monolog\Logger($loggerName);
    $file = __DIR__ . '/app.log';
    touch($file);
    chmod($file, 0666);
    $logger->pushHandler(new Monolog\Handler\StreamHandler($file));

    View Slide

  26. SAPI-­‐aware  Monolog
    26
    $sapi = php_sapi_name();
    $loggerName = php_sapi_name() == 'cli' ? "myapp-cli" : "myapp-web";
    $logger = new \Monolog\Logger($loggerName);
    if ($sapi == 'cli') {
    $logger->pushHandler(new \Monolog\Handler\StreamHandler("php://
    stdout"));
    } else {
    // file setup here, touch, chmod, etc
    $logger->pushHandler(new Monolog\Handler\StreamHandler($file));
    }

    View Slide

  27. Add  extra  info  to  your  logs
    27
    $logger->pushProcessor(function($record) {
    $record["extra"] = array(gethostname());
    return $record;
    });

    View Slide

  28. Logging  to  a  Service
    28
    $handler = new Monolog\Handler\SyslogUdpHandler('data.logentries.com',
    12345);
    $handler->setFormatter(new \Monolog\Formatter\LineFormatter());
    $logger->pushHandler($handler);

    View Slide

  29. Environment-­‐Aware  Log  Levels
    29
    if (APPLICATION_ENV == 'production') {
    $udpHandler = new Monolog\Handler
    \SyslogUdpHandler('data.logentries.com', 12345, \Monolog\Logger::INFO);
    $udpHandler->setFormatter(new \Monolog\Formatter\LineFormatter());
    $emailHandler = new Monolog\Handler\SwiftMailerHandler($swiftMailer,
    \Monolog\Logger::ALERT);
    $logger->pushHandler($udpHandler);
    $logger->pushHandler($emailHandler);
    }

    View Slide

  30. Sample  Log  File
    30
    [2015-03-27 14:49:21] orca-web.DEBUG: {“type”:”view”,”data":{"buoy":
    1496827310190429296,"path":"\/sears\/"
    [2015-03-29 22:30:05] orca-web.INFO: orca.pages.all.render_time:
    0.12709784507751|ms|@1.000 [] [“vagrant-ubuntu

    [2015-03-29 22:30:05] orca-web.INFO: orca.pages.all.views.anonymous:1|
    c|@1.000 [] [“vagrant-ubuntu-trusty-64"]

    [2015-03-30 15:40:26] orca-web.INFO: Captcha failed for 10.0.2.2;
    Requested [] [“vagrant-ubuntu-trusty-64"]

    [2015-03-30 15:52:59] orca-web.INFO: Captcha Passed: 10.0.2.2;
    Requested [] [“vagrant-ubuntu-trusty-64"]

    [2015-03-30 15:53:00] orca-web.ALERT: ELASTICSEARCH ERROR With Path: /
    error: {"error":"IndexMissingException[[o

    View Slide

  31. STATS
    31

    View Slide

  32. Metrics  Collection
    • Everyone  likes  graphs  
    • Data  visualizations  help  you  spot  
    outliers  in  real-­‐time  
    • Create  a  dashboard  that  displays  
    them
    32

    View Slide

  33. Example  Baseline  metrics
    • PHP  execution  time  
    • PHP  memory  usage  
    • Number  of  database  queries  per  
    request  
    • Job  queue  length  
    • Time  to  process  jobs  
    • Emails  sent
    33

    View Slide

  34. Application  Metrics
    • User  logins  /  failed  logins  
    • Password  resets  
    • Page  views  for  key  pages  
    • Deployments  
    • Caught  exceptions  
    • Overall  page  views
    34

    View Slide

  35. Statsd  /  Graphite
    • Statsd  is  a  node.js  app  that  collects  
    stats  from  your  application  
    • Graphite  is  a  visualization  tool  that  
    lets  you  access  information  from  
    Statsd  in  graph  form
    35

    View Slide

  36. Graphite  UI
    36

    View Slide

  37. Graphite  Example
    37

    View Slide

  38. Types  of  Statsd  Metrics
    • Counters  
    • Timers  
    • Gauges  
    • Sets
    38

    View Slide

  39. Examples  of  Counters
    • Count  every  request  
    • Count  every  transactional  email  
    sent  
    • Count  every  job  from  your  job  
    queue  by  type  
    • Count  every  caught  exception
    39

    View Slide

  40. Examples  of  Timers
    • Time  your  index.php  at  the  top  and  
    bottom  
    • Time  your  crontabs,  especially  
    overnight  ones  
    • You  can  even  submit  timers  for  
    multi-­‐page  events  (conversion  
    funnels,  etc)
    40

    View Slide

  41. Metric  Naming
    • .  delimited  names  
    • Think  of  it  like  namespaces  
    • Plan  ahead  
    • Use  a  top-­‐level  namespace  per-­‐app  
    (client-­‐side)
    41

    View Slide

  42. Send  PHP  data  to  Statsd
    42
    $connection = new Domnikl\Statsd\Connection\UdpSocket('localhost');
    $client = new Domnikl\Statsd\Client($connection, 'myapp');

    View Slide

  43. Time  your  “Page  Render”
    43
    $connection = new Domnikl\Statsd\Connection\UdpSocket('localhost');
    $client = new Domnikl\Statsd\Client($connection, ‘orca');
    $client->startTiming(‘render_time');
    $application = new Application();
    $response = $application->dispatch();
    echo $response;
    $client->endTiming('render_time');

    View Slide

  44. Page  Render  Example
    44

    View Slide

  45. Count  Your  Pageviews
    45
    $connection = new Domnikl\Statsd\Connection\UdpSocket('localhost');
    $client = new Domnikl\Statsd\Client($connection, 'orca');
    $client->startTiming('render_time');
    $application = new Application();
    $response = $application->dispatch();
    echo $response;
    $client->increment('pageviews');
    $client->endTiming('render_time');

    View Slide

  46. Pageview  Count  Example
    46

    View Slide

  47. Job  Queue  Example
    47
    class Worker
    {
    protected $statsd;
    public function run($job)
    {
    try {
    $this->processJob($job);
    $this->statsd->increment("worker.success");
    } catch (\Exception $e) {
    $this->buryJob($job);
    $this->statsd->increment("worker.buried");
    }
    }
    }

    View Slide

  48. Job  Queue  Example
    48

    View Slide

  49. Logs  vs  Stats
    • Why  not  both?  
    • Logs  are  searchable  
    • Stats  are  graph-­‐able,  visual  
    • Make  sure  you  can  correlate  logs  
    and  stats
    49

    View Slide

  50. Make  it  Actionable
    • You  have  to  actually  look  at  
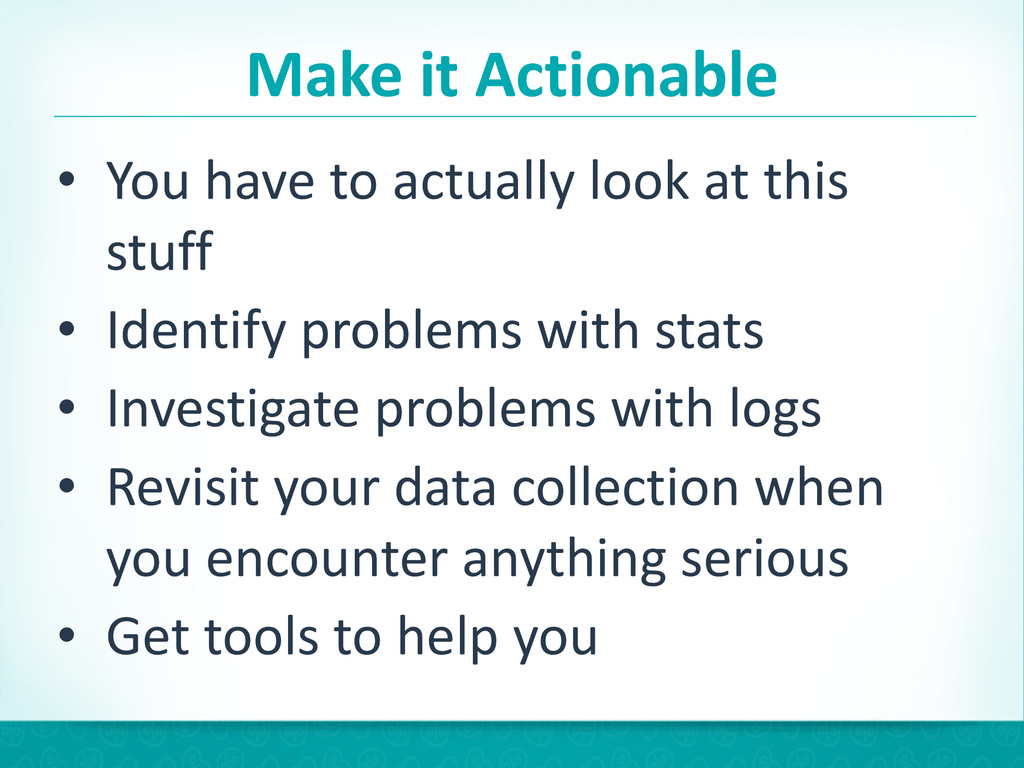
this  
    stuff  
    • Identify  problems  with  stats  
    • Investigate  problems  with  logs  
    • Revisit  your  data  collection  when  
    you  encounter  anything  serious  
    • Get  tools  to  help  you
    50

    View Slide

  51. Got  Budget?
    51

    View Slide

  52. QUESTIONS
    Anyone  have
    52

    View Slide

  53. JOIND.IN/13548
    I’d  love  your  feedback:
    53

    View Slide