Upgrade to Pro — share decks privately, control downloads, hide ads and more …

Towards Explainable Software Defect Prediction Models to Support SQA Planning

Towards Explainable Software Defect Prediction Models to Support SQA Planning

Presenter:
Jirayus Jiarpakdee ([email protected])

Description:
A final review presentation for the degree of Doctor of Philosophy at the Faculty of Information and Technology, Monash University.

Note to those who wish to adopt the structure of this presentation, the storyline is as follows:
1) General introduction (i.e., Intro to software defects, SQA, defect prediction models)
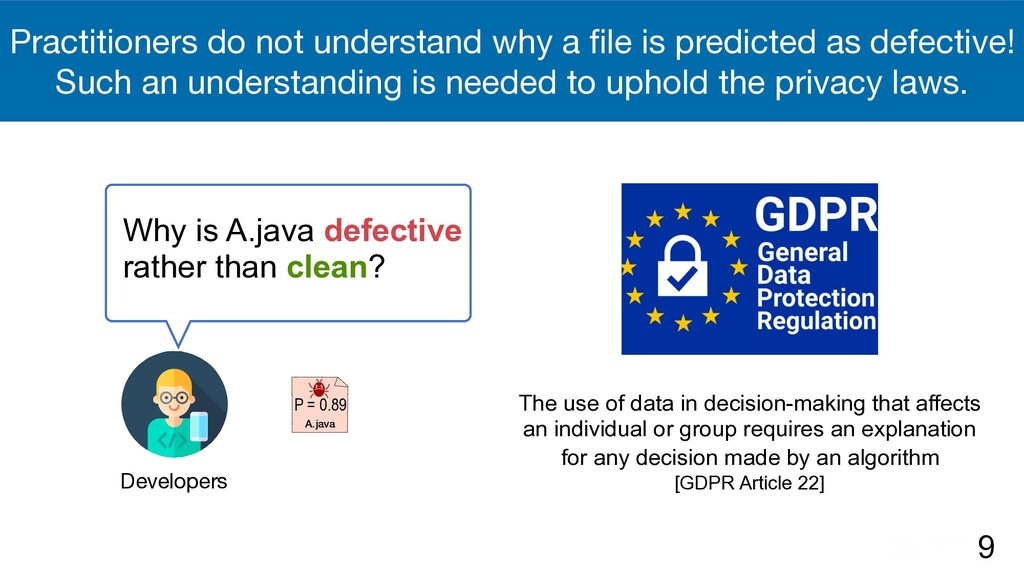
2) Problem motivation (i.e., Practitioners do not understand the why question and such an understanding is needed to uphold the privacy laws)
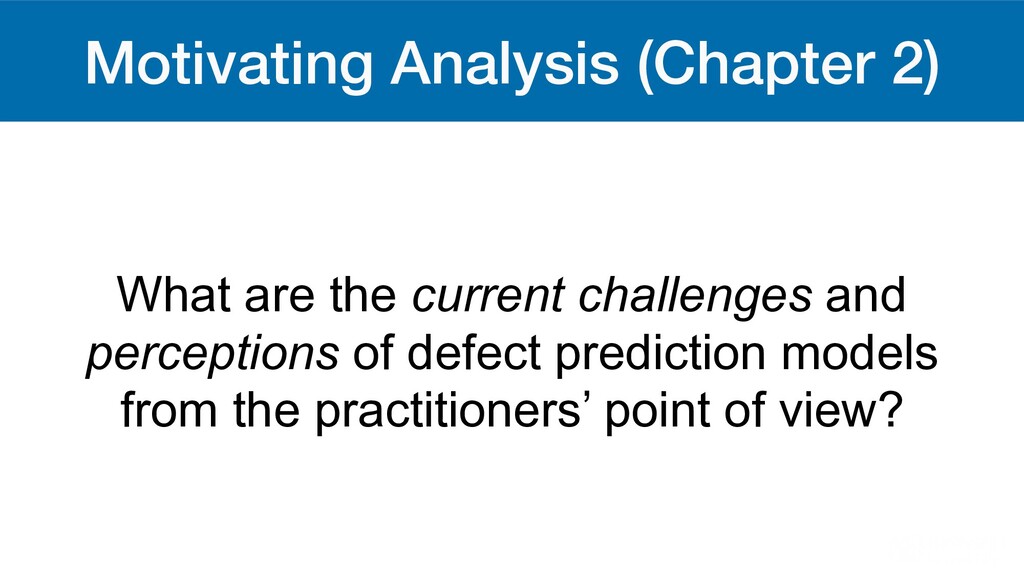
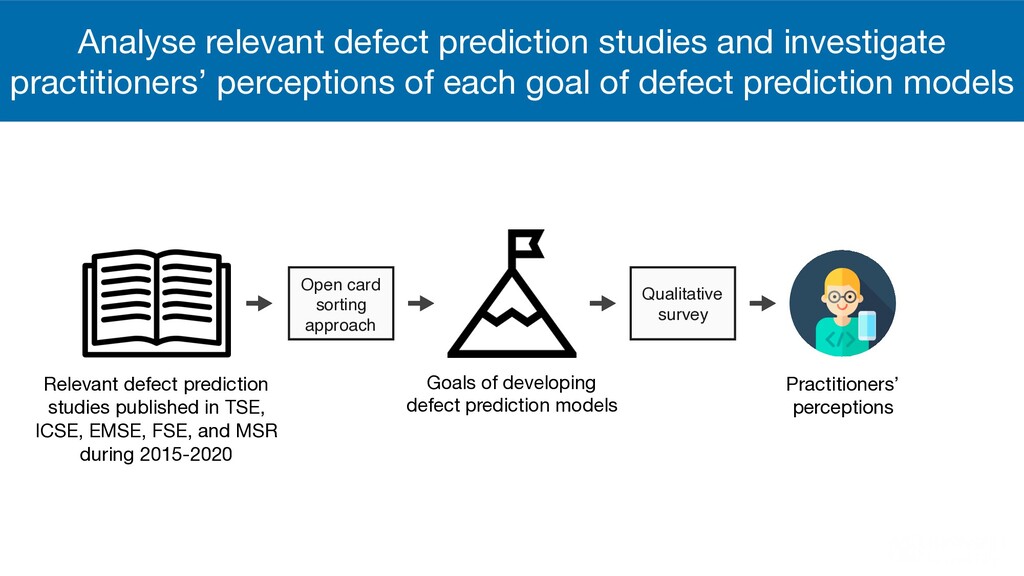
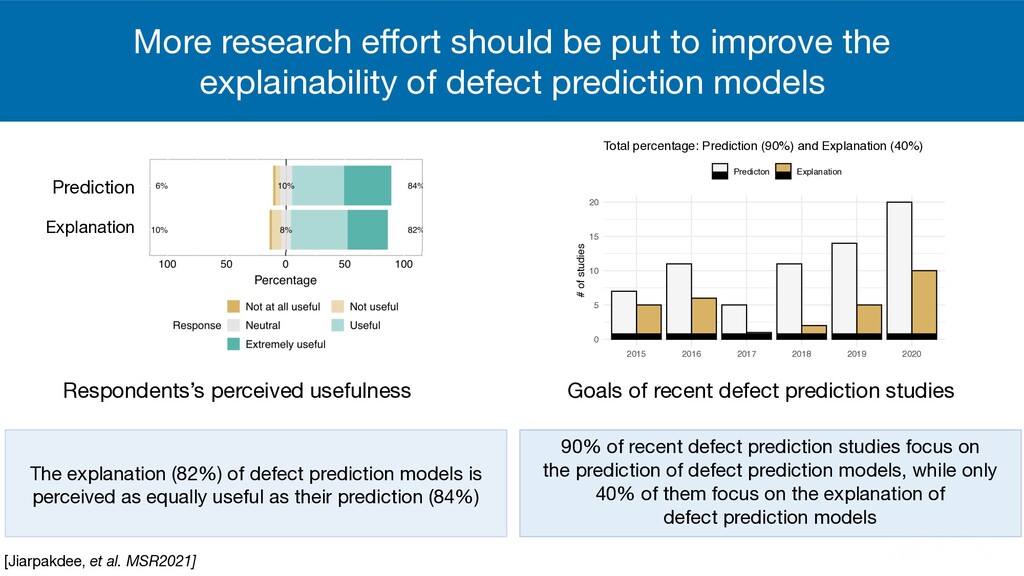
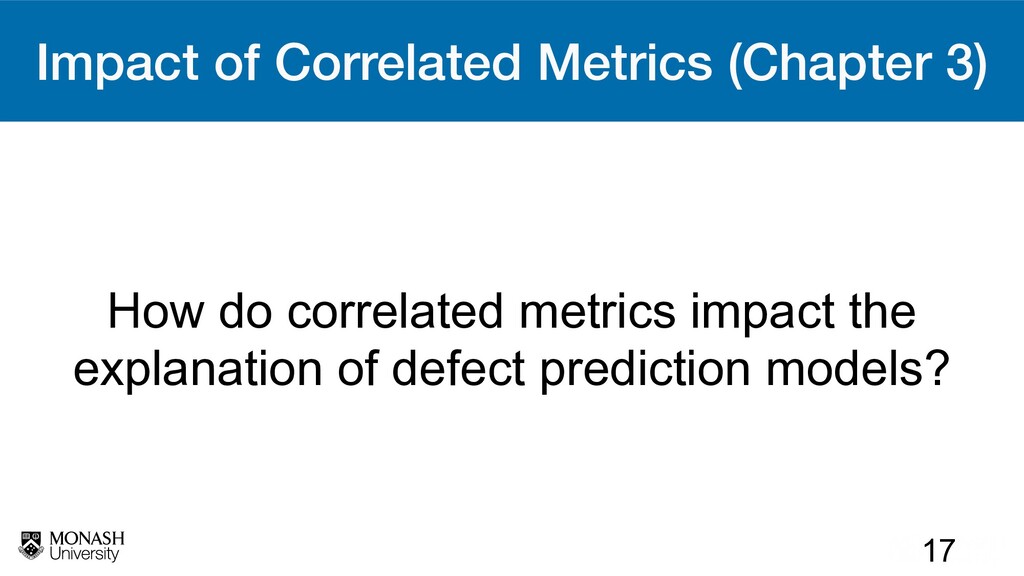
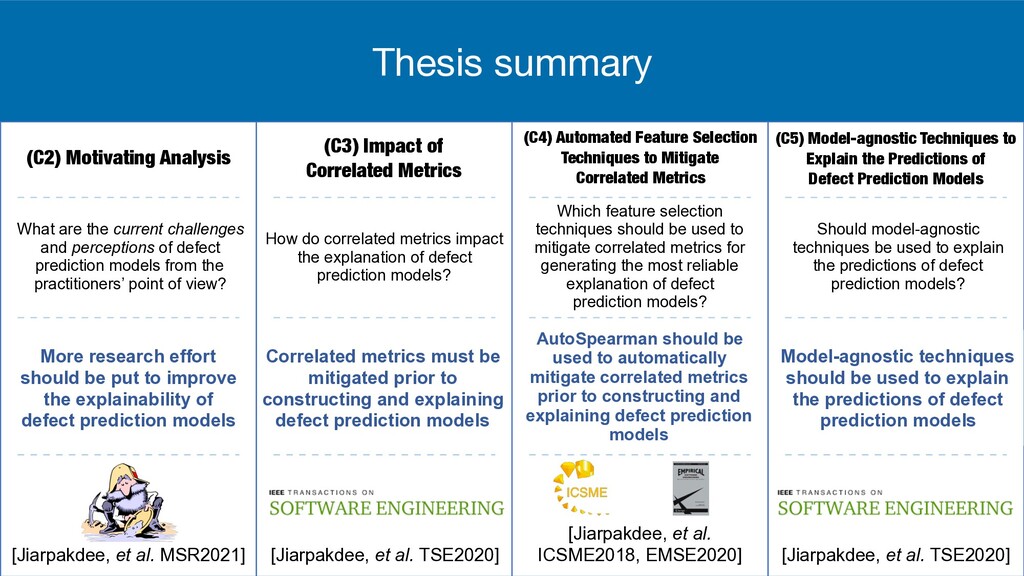
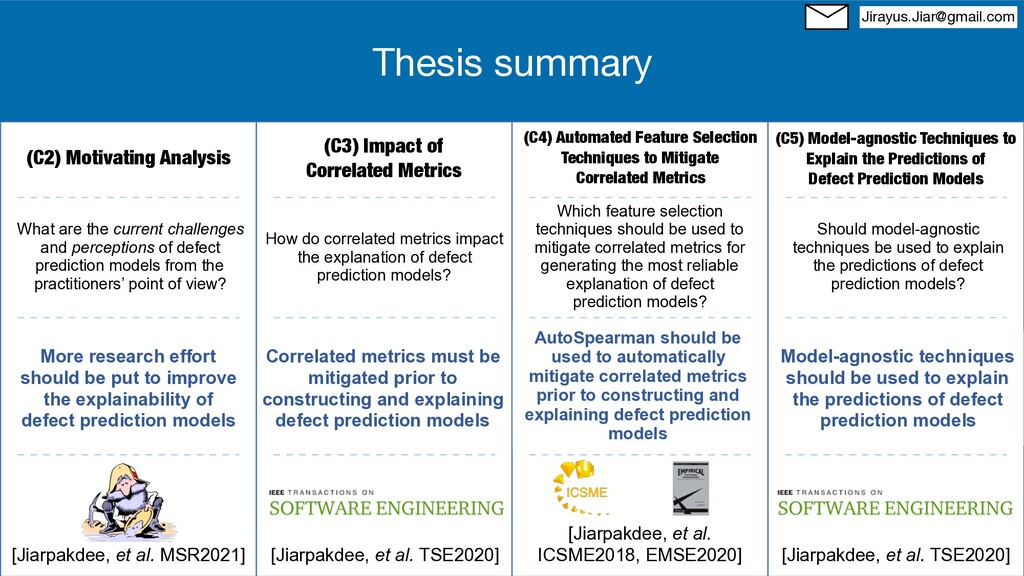
3) Chapter 2 - Motivating analysis
> Design
> Results & Implication
4) Thesis goal and statement
5) From this point, the structure is as follows:
> for i in 3:5,
>> Problem motivation of Chapter i
>> Introduction of Chapter i
>> Design of Chapter i
>> Results & Implication of Chapter i
>> A link between Chapters i and i+1
6) Thesis summary
7) Conclude with a thesis statement
8) End with a Thesis summary page

Hope this help.

JirayusJiar

March 23, 2021
Tweet

Other Decks in Research

Transcript

  1. Jirayus Jiarpakdee Towards Explainable Software Defect Prediction Models to Support

    SQA Planning Chakkrit Tantithamthavorn (Supervisor) John Grundy (Co-supervisor) 20210323 - PhD Final Review Milestone
  2. Software defects are expensive, but hard to detect and prevent

    2 TODO - software defects are expensive figure TODO - stats of software defects that slip through Ariane 5, Flight 501 More than US$370 million Software defects are often disguised throughout software systems Syntax Arithmetic Logical
  3. Software Quality Assurance (SQA) is an activity that checks software

    systems to ensure the highest quality of software systems by detection and prevention 3 Code Review Software Testing
  4. 4 Project Timeline “Release version 1.0” A.java B.java C.java Version

    1.0 A.java Developers “New features” A.java “Enhancement” B.java A user “Report subscript out of bounds errors” “Fix subscript out of bounds errors” Another user “Report parallel processing errors” A.java C.java “Fix parallel processing errors” Next version release The rapid release cycles and limited QA resources pose a critical challenge to ensuring high quality of software systems!
  5. Defect prediction models are constructed from historical data to identify

    files that are likely to be defective Historical data (Training Data) Defect prediction models Predictions Unseen Data A.java A.java A predicted probability of 89%
  6. 6 Defect prediction models are constructed using software metrics that

    capture several dimensions, e.g., code, process, and human Code metrics, e.g., code complexity, code size, and object-oriented properties Process metrics, e.g., # of commits, # of active developers, and # of distinct developers Human metrics, e.g., # of minor authors and # of major authors Code
  7. 7 Any files that are fixed after a release will

    be labeled as defective, otherwise clean Project Timeline “Release version 1.0” A.java B.java C.java A.java Developers “New features” A.java “Enhancement” B.java A user “Report subscript out of bounds errors” Another user “Report parallel processing errors” A.java C.java “Fix parallel processing errors” Version 1.0 Next version release “Fix subscript out of bounds errors” File Defect-label A.java Defect B.java Clean C.java Defect
  8. 8 Defect prediction models help developers prioritise their limited QA

    resources on the most risky files Project Timeline “Release version 1.0” A.java Developers “New features” A.java “Enhancement” B.java A user “Report subscript out of bounds errors” Version 1.0 Defect prediction models B.java C.java C.java B.java P = 0.76 P = 0.27 A.java P = 0.89
  9. 9 Practitioners do not understand why a file is predicted

    as defective! Such an understanding is needed to uphold the privacy laws. Developers A.java P = 0.89 Why is A.java defective rather than clean? The use of data in decision-making that affects an individual or group requires an explanation for any decision made by an algorithm [GDPR Article 22]
  10. Motivating Analysis (Chapter 2) What are the current challenges and

    perceptions of defect prediction models from the practitioners’ point of view?
  11. Analyse relevant defect prediction studies and investigate practitioners’ perceptions of

    each goal of defect prediction models Relevant defect prediction studies published in TSE, ICSE, EMSE, FSE, and MSR during 2015-2020 Goals of developing defect prediction models Practitioners’ perceptions Open card sorting approach Qualitative survey
  12. More research effort should be put to improve the explainability

    of defect prediction models Respondents’s perceived usefulness Prediction Explanation [Jiarpakdee, et al. MSR2021] 0 5 10 15 20 2015 2016 2017 2018 2019 2020 # of studies Predicton Explanation Total percentage: Prediction (90%) and Explanation (40%) Goals of recent defect prediction studies The explanation (82%) of defect prediction models is perceived as equally useful as their prediction (84%) 90% of recent defect prediction studies focus on the prediction of defect prediction models, while only 40% of them focus on the explanation of defect prediction models
  13. 13 Practitioners are reluctant to adopt defect prediction models! Developers

    A.java P = 0.89 Why is A.java defective rather than clean? The use of data in decision-making that affects an individual or group requires an explanation for any decision made by an algorithm [GDPR Article 22] How can we increase the explainability of defect prediction models to support SQA planning?
  14. 14 How can we increase the explainability of defect prediction

    models to support SQA planning? Explainable defect prediction models are needed to support SQA planning. Empirical studies are the way forward to identify the best explainable defect prediction framework to generate the most reliable explanations.
  15. Current practice of defect prediction framework Generate global explanation Historical

    Data (Training Data) Defect prediction models Global explanation (Variable Importance) 15 Prediction Unseen Data A.java A.java A predicted probability of 89%
  16. Current practice of defect prediction framework Generate global explanation Historical

    Data (Training Data) Defect prediction models Global explanation (Variable Importance) SQA plan SQA plans 15 Prediction Unseen Data A.java A.java A predicted probability of 89%
  17. Correlated metrics that are prevalent in defect datasets may lead

    to unreliable SQA plans Generate global explanation Historical data that contains correlated metrics Unreliable SQA plans 16 Prediction Unseen Data A.java A.java A predicted probability of 89% Defect prediction models constructed with correlated metrics Unreliable global explanation SQA plan
  18. 17 Impact of Correlated Metrics (Chapter 3) How do correlated

    metrics impact the explanation of defect prediction models?
  19. Investigate the percentage of differences in ranks and consistency of

    the top-ranked metrics between mitigated and non-mitigated models Non-mitigated Dataset Mitigate correlated metrics Mitigated Dataset Construct defect prediction models Construct defect prediction models Non-mitigated Defect Prediction Models Mitigated Defect Prediction Models M Analyse the explanation of defect prediction models Defect Dataset M
  20. Correlated metrics impact the explanation of defect prediction models and

    must be mitigated prior to constructing and explaining models Percentage (%) 0 25 50 75 100 Different Not different 37 63 Percentage of differences in ranks of the top-ranked metrics [Jiarpakdee, et al. TSE2020] 37% of the top-ranked metrics does not appear as the top-ranked metrics after correlated metrics are removed Removing correlated metrics improves the consistency of the top-ranked metrics among model explanation techniques by 46% Percentage (%) 0 25 50 75 100 Non-mitigatedMitigated 23 69 Consistency of the top-ranked metrics
  21. Correlated metrics that are prevalent in defect datasets impact the

    explanation of defect prediction models and lead to unreliable SQA plans Generate global explanation Historical data that contains correlated metrics Unreliable SQA plans 20 Prediction Unseen Data A.java A.java A predicted probability of 89% Defect models constructed with correlated metrics Unreliable global explanation SQA plan
  22. 21 Automated Feature Selection Techniques to Mitigate Correlated Metrics (Chapter

    4) Which feature selection techniques should be used to mitigate correlated metrics for generating the most reliable explanation of defect prediction models?
  23. Prior studies use feature selection techniques to find a subset

    of metrics that are relevant to defect-proneness 22 The best subset of metrics Filter-based family (e.g., Information Gain) Software metrics Search for the best subset of metrics regardless of model construction The best subset of metrics Wrapper-based family (e.g., Stepwise Regression) Construct models to search for the best subset of metrics Software metrics
  24. Little is known about whether feature selection techniques mitigate correlated

    metrics Software metrics (i.e., Lines of code, code complexity, and development activity) Information Gain feature selection Correlation-based feature selection Stepwise Regression Recursive Feature Elimination Lines of code, code complexity Lines of code, development activity Lines of code, coding experience Lines of code, code complexity
  25. Commonly-used correlation analysis techniques involve manual selection 0.92 0.9 0.85

    0.56 0.33 0.55 0.35 0.92 0.89 0.95 0.69 0.35 0.58 0.38 0.9 0.89 0.86 0.53 0.29 0.51 0.36 0.85 0.95 0.86 0.77 0.34 0.58 0.37 0.56 0.69 0.53 0.77 0.05 0.5 0.29 0.33 0.35 0.29 0.34 0.05 0.25 0.14 0.55 0.58 0.51 0.58 0.5 0.25 0.24 0.35 0.38 0.36 0.37 0.29 0.14 0.24 CC_max MLOC_sum NBD_max NBD_sum NOM_max NSM_avg PAR_max pre C C _m ax M LO C _sum N BD _m ax N BD _sum N O M _m ax N SM _avg PAR _m ax pre Non−correlated metrics Correlated metrics An example of correlation analysis using a Spearman rank correlation test on the Eclipse Platform 2 dataset provided by [Zimmermann et al. PROMISE2007] A spearman correlation threshold of 0.7 as suggested by [Kraemer et al. JAACAP2003]
  26. Commonly-used correlation analysis techniques involve manual selection 0.92 0.9 0.85

    0.56 0.33 0.55 0.35 0.92 0.89 0.95 0.69 0.35 0.58 0.38 0.9 0.89 0.86 0.53 0.29 0.51 0.36 0.85 0.95 0.86 0.77 0.34 0.58 0.37 0.56 0.69 0.53 0.77 0.05 0.5 0.29 0.33 0.35 0.29 0.34 0.05 0.25 0.14 0.55 0.58 0.51 0.58 0.5 0.25 0.24 0.35 0.38 0.36 0.37 0.29 0.14 0.24 CC_max MLOC_sum NBD_max NBD_sum NOM_max NSM_avg PAR_max pre C C _m ax M LO C _sum N BD _m ax N BD _sum N O M _m ax N SM _avg PAR _m ax pre Non−correlated metrics Correlated metrics An example of correlation analysis using a Spearman rank correlation test on the Eclipse Platform 2 dataset provided by [Zimmermann et al. PROMISE2007] A spearman correlation threshold of 0.7 as suggested by [Kraemer et al. JAACAP2003]
  27. AutoSpearman, an automated metric selection approach based on correlation analysis

    techniques *A spearman correlation threshold of 0.7 as suggested by [Kraemer et al. JAACAP2003] Object-oriented Lines of code Code complexity # of developers 0 1 Strong correlation 0.7* Select the metric that shares the least correlation with other metrics Spearman correlation
  28. Historical data (Training Data) Investigate the consistency and correlation of

    the 10 commonly-used and our proposed feature selection techniques Apply feature selection techniques Subset of metrics produced by FS1 . . . Subset of metrics produced by AutoSpearman Analyse the consistency and correlation of the studied feature selection techniques
  29. AutoSpearman should be used to automatically mitigate correlated metrics prior

    to constructing and explaining defect prediction models [Jiarpakdee, et al. ICSME2018, EMSE2020] AutoSpearman yields the highest consistency of subsets of metrics when comparing to other studied techniques AutoSpearman is the only studied technique that mitigates correlated metrics Consistency of the produced subset of metrics (%) Percentage of subsets with correlated metrics (%)
  30. 28 Generate global explanation Historical data (Training Data) Defect prediction

    models Prediction Unseen Data A.java A.java A predicted probability of 89% Global explanation (Variable Importance) AutoSpearman should be used to automatically mitigate correlated metrics prior to constructing and explaining defect prediction models Apply AutoSpearman to mitigate correlated metrics SQA plan Subset of metrics produced by AutoSpearman
  31. 29 Generate global explanation Historical data (Training Data) Defect prediction

    models Prediction Unseen Data A.java A.java A predicted probability of 89% Global explanation (Variable Importance) Global explanations are too generic and not specific to explain each individual prediction of defect prediction models Apply AutoSpearman to mitigate correlated metrics SQA plan Subset of metrics produced by AutoSpearman
  32. 30 Generate global explanation Historical data (Training Data) Defect models

    Prediction Unseen Data A.java A.java A predicted probability of 89% Global explanation (Variable Importance) Recent work applies model-agnostic techniques to generate instance explanations for each individual prediction Apply AutoSpearman to mitigate correlated metrics SQA plan Subset of metrics produced by AutoSpearman Generate instance explanation 0.268 0.332 0.169 0.036 0.02 0.007 0.832 + MAJOR_LINE = 2 + ADEV = 12 + CountDeclMethodPrivate = 6 + CountDeclMethodPublic = 44 + CountClassCoupled = 16 remaining 21 variables final_prognosis 0.00 0.25 0.50 0.75 1.00 1.25 0.268 0.332 0.169 0.036 0.02 0.007 0.832 + MAJOR_LINE = 2 + ADEV = 12 + CountDeclMethodPrivate = 6 + CountDeclMethodPublic = 44 + CountClassCoupled = 16 remaining 21 variables final_prognosis 0.00 0.25 0.50 0.75 1.00 1.25 0.268 0.332 0.169 0.036 0.02 0.007 0.832 + MAJOR_LINE = 2 + ADEV = 12 + CountDeclMethodPrivate = 6 + CountDeclMethodPublic = 44 + CountClassCoupled = 16 remaining 21 variables final_prognosis 0.00 0.25 0.50 0.75 1.00 1.25 Instance explanation
  33. 31 Model-agnostic Techniques to Explain the Predictions of Defect Prediction

    Models (Chapter 5) Should model-agnostic techniques be used to explain the predictions of defect prediction models?
  34. Model-agnostic techniques can explain the predictions of any prediction models

    (e.g., Why is A.java likely to be defective?) A support score of a condition of #ClassCoupled > 5 yields the highest weight towards the likelihood of being defective for A.java A.java is likely to be defective (P = 0.832) A.java #ClassCoupled > 5 #LineComment > 24 #DeclareMethodPublic > 5
  35. Investigate the variation and stability of generated explanations, and practitioners’

    perceptions of model-agnostic techniques Historical data (Training Data) Defect models Prediction Unseen Data A.java A.java A predicted probability of 89% Apply AutoSpearman to mitigate correlated metrics Subset of metrics produced by AutoSpearman Generate instance explanation 0.268 0.332 0.169 0.036 0.02 0.007 0.832 + MAJOR_LINE = 2 + ADEV = 12 + CountDeclMethodPrivate = 6 + CountDeclMethodPublic = 44 + CountClassCoupled = 16 remaining 21 variables final_prognosis 0.00 0.25 0.50 0.75 1.00 1.25 0.268 0.332 0.169 0.036 0.02 0.007 0.832 + MAJOR_LINE = 2 + ADEV = 12 + CountDeclMethodPrivate = 6 + CountDeclMethodPublic = 44 + CountClassCoupled = 16 remaining 21 variables final_prognosis 0.00 0.25 0.50 0.75 1.00 1.25 0.268 0.332 0.169 0.036 0.02 0.007 0.832 + MAJOR_LINE = 2 + ADEV = 12 + CountDeclMethodPrivate = 6 + CountDeclMethodPublic = 44 + CountClassCoupled = 16 remaining 21 variables final_prognosis 0.00 0.25 0.50 0.75 1.00 1.25 Instance explanation Investigate practitioners’ perceptions of model-agnostic techniques with a qualitative survey Analyse the variation and stability of generated explanations
  36. Model-agnostic techniques should be used to explain the predictions of

    defect prediction models [Jiarpakdee, et al. TSE2020] Instance explanations vary across different predictions Rank differences of each metric across instance explanations LIME-HPO and BreakDown consistently generate the same instance explanation for the same instance Rank differences of each metric when re-generating instance explanations Can be used to answer the why-questions? 65% 65% 70% Can build appropriate trusts of the predictions of defect prediction models? Are instance explanations perceived as useful? More than half of the respondents (65%-75%) perceive that instance explanations can be used to answer the why-questions, build appropriate trusts of the predictions, and are useful
  37. Model-agnostic techniques should be used to explain the predictions of

    defect prediction models Generate global explanation Historical data (Training Data) Defect models Prediction Unseen Data A.java A.java A predicted probability of 89% Global explanation (Variable Importance) Apply AutoSpearman to mitigate correlated metrics SQA plan Subset of metrics produced by AutoSpearman 0.268 0.332 0.169 0.036 0.02 0.007 0.832 + MAJOR_LINE = 2 + ADEV = 12 + CountDeclMethodPrivate = 6 + CountDeclMethodPublic = 44 + CountClassCoupled = 16 remaining 21 variables final_prognosis 0.00 0.25 0.50 0.75 1.00 1.25 0.268 0.332 0.169 0.036 0.02 0.007 0.832 + MAJOR_LINE = 2 + ADEV = 12 + CountDeclMethodPrivate = 6 + CountDeclMethodPublic = 44 + CountClassCoupled = 16 remaining 21 variables final_prognosis 0.00 0.25 0.50 0.75 1.00 1.25 0.268 0.332 0.169 0.036 0.02 0.007 0.832 + MAJOR_LINE = 2 + ADEV = 12 + CountDeclMethodPrivate = 6 + CountDeclMethodPublic = 44 + CountClassCoupled = 16 remaining 21 variables final_prognosis 0.00 0.25 0.50 0.75 1.00 1.25 Instance explanation Generate instance explanation using model-agnostic techniques
  38. Model-agnostic techniques generate instance explanations that are needed and perceived

    as useful by practitioners Model-agnostic techniques should be used to explain the predictions of defect prediction models Thesis summary (C2) Motivating Analysis What are the current challenges and perceptions of defect prediction models from the practitioners’ point of view? Despite receiving little attention from research community, the explanation of defect prediction models is perceived as equally useful as their prediction [Jiarpakdee, et al. MSR2021] (C3) Impact of Correlated Metrics How do correlated metrics impact the explanation of defect prediction models? Correlated metrics impact the ranking and consistency of the top-ranked metrics [Jiarpakdee, et al. TSE2020] (C4) Automated Feature Selection Techniques to Mitigate Correlated Metrics Which feature selection techniques should be used to mitigate correlated metrics for generating the most reliable explanation of defect prediction models? AutoSpearman yields the highest consistency of metrics and can automatically mitigate correlated metrics [Jiarpakdee, et al. ICSME2018, EMSE2020] (C5) Model-agnostic Techniques to Explain the Predictions of Defect Prediction Models Should model-agnostic techniques be used to explain the predictions of defect prediction models? [Jiarpakdee, et al. TSE2020] More research effort should be put to improve the explainability of defect prediction models Correlated metrics must be mitigated prior to constructing and explaining defect prediction models AutoSpearman should be used to automatically mitigate correlated metrics prior to constructing and explaining defect prediction models
  39. 38 How can we increase the explainability of defect prediction

    models to support SQA planning? Explainable defect prediction models are needed to support SQA planning. Empirical studies are the way forward to identify the best explainable defect prediction framework to generate the most reliable explanations.
  40. Thesis summary (C2) Motivating Analysis What are the current challenges

    and perceptions of defect prediction models from the practitioners’ point of view? Despite receiving little attention from research community, the explanation of defect prediction models is perceived as equally useful as their prediction [Jiarpakdee, et al. MSR2021] (C3) Impact of Correlated Metrics How do correlated metrics impact the explanation of defect prediction models? Correlated metrics impact the ranking and consistency of the top-ranked metrics [Jiarpakdee, et al. TSE2020] (C4) Automated Feature Selection Techniques to Mitigate Correlated Metrics Which feature selection techniques should be used to mitigate correlated metrics for generating the most reliable explanation of defect prediction models? AutoSpearman yields the highest consistency of metrics and can automatically mitigate correlated metrics [Jiarpakdee, et al. ICSME2018, EMSE2020] (C5) Model-agnostic Techniques to Explain the Predictions of Defect Prediction Models Should model-agnostic techniques be used to explain the predictions of defect prediction models? Model-agnostic techniques generate reliable instance explanations that are perceived as needed and useful by practitioners [Jiarpakdee, et al. TSE2020] More research effort should be put to improve the explainability of defect prediction models Correlated metrics must be mitigated prior to constructing and explaining defect prediction models AutoSpearman should be used to automatically mitigate correlated metrics prior to constructing and explaining defect prediction models Model-agnostic techniques should be used to explain the predictions of defect prediction models [email protected]