Upgrade to Pro — share decks privately, control downloads, hide ads and more …

Tracing and Profiling Java (and Native) Applications in Production

Tracing and Profiling Java (and Native) Applications in Production

Talk given at OSCON 2014: http://www.oscon.com/oscon2014/public/schedule/detail/34094

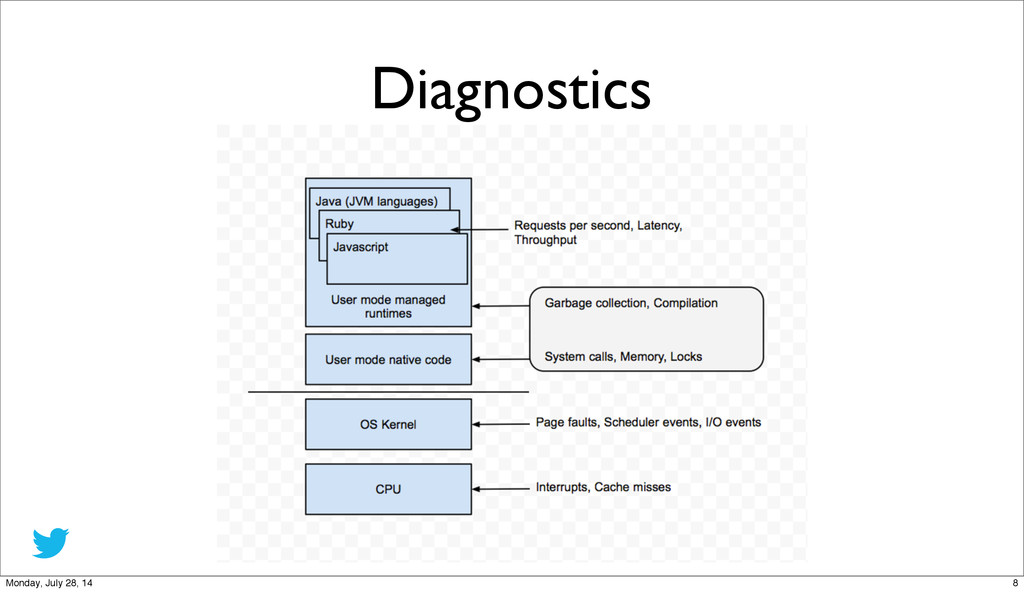
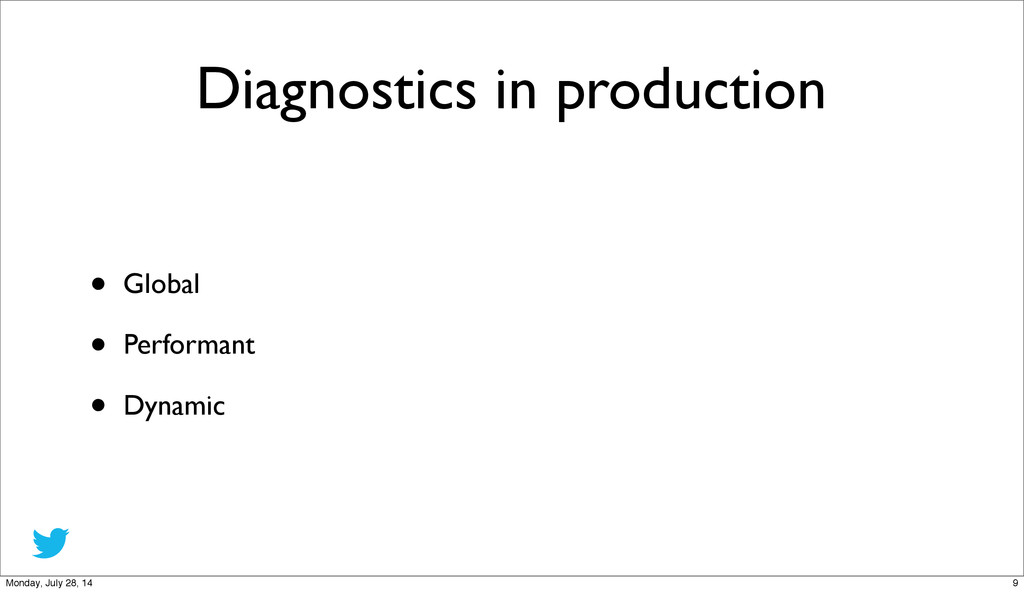
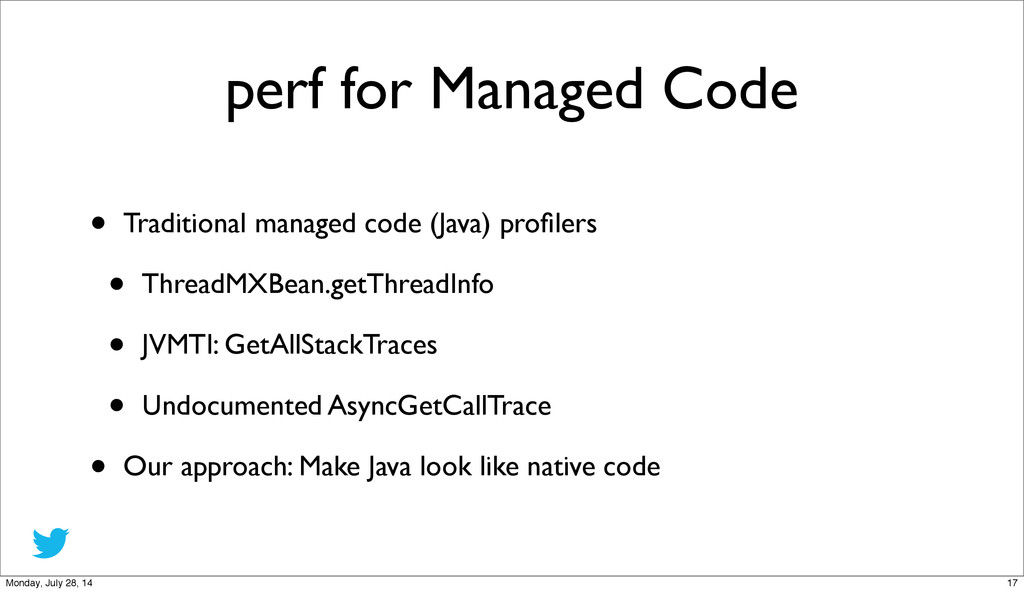
The ability to understand the behavior of a software system so as to be able to answer questions about its health, while important has always been a challenge for software developers. System tools or language debuggers and profilers tend to be myopic in their scope and cumbersome to understand, setup and use; More so when applied to a distributed system. Specifically, requiring recompilation of software with additional instrumentation, adding a non-trivial performance overhead, and, equally importantly, requiring an elaborate setup renders tools unfit to be used in production.

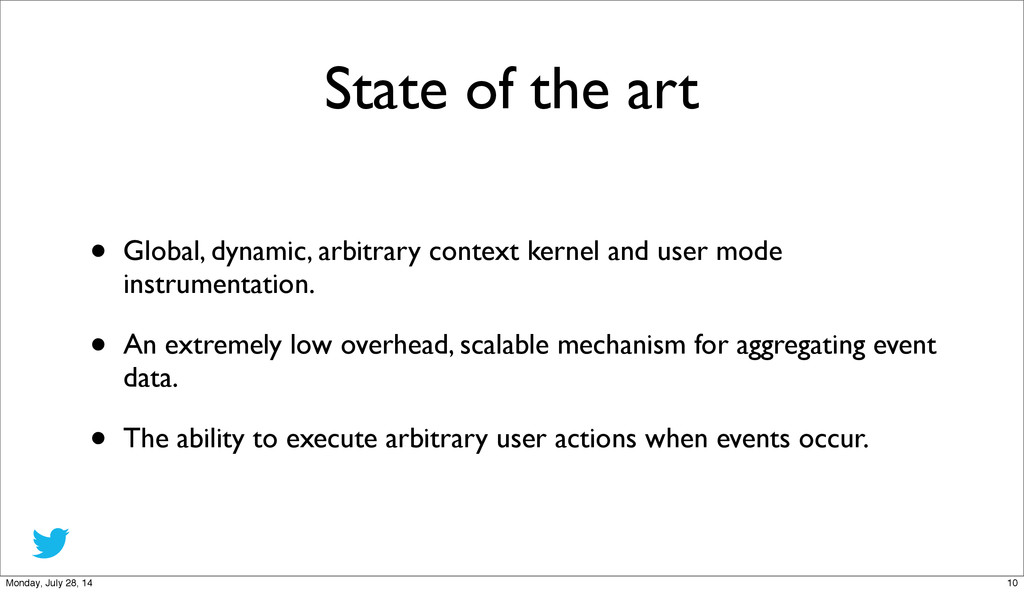
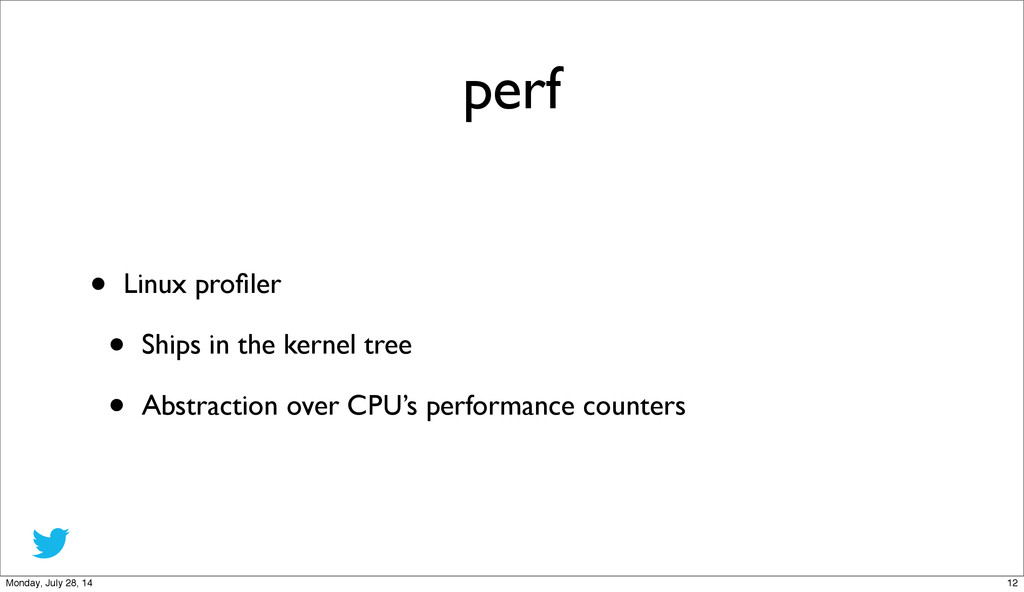
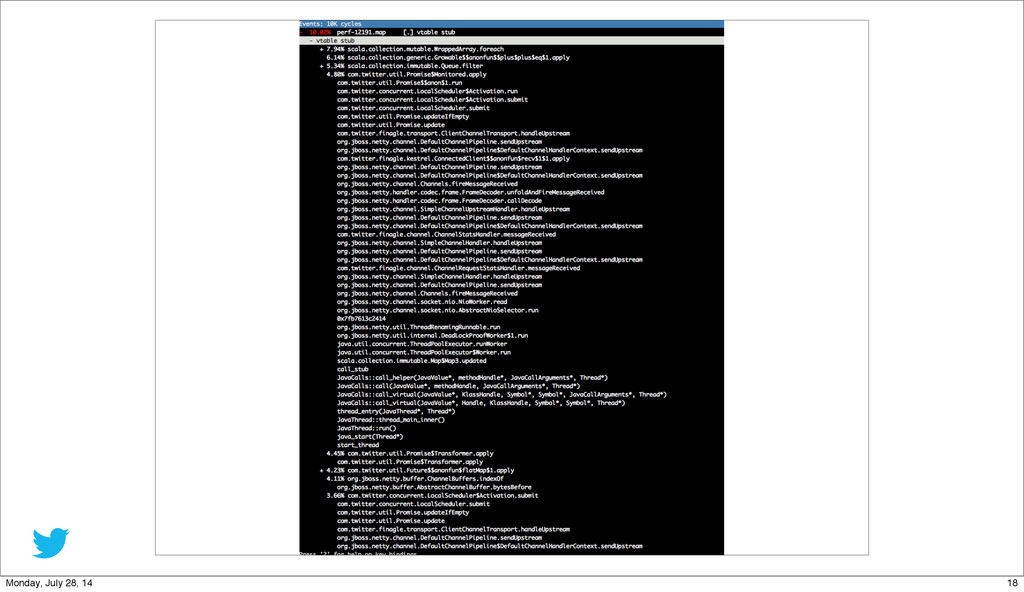
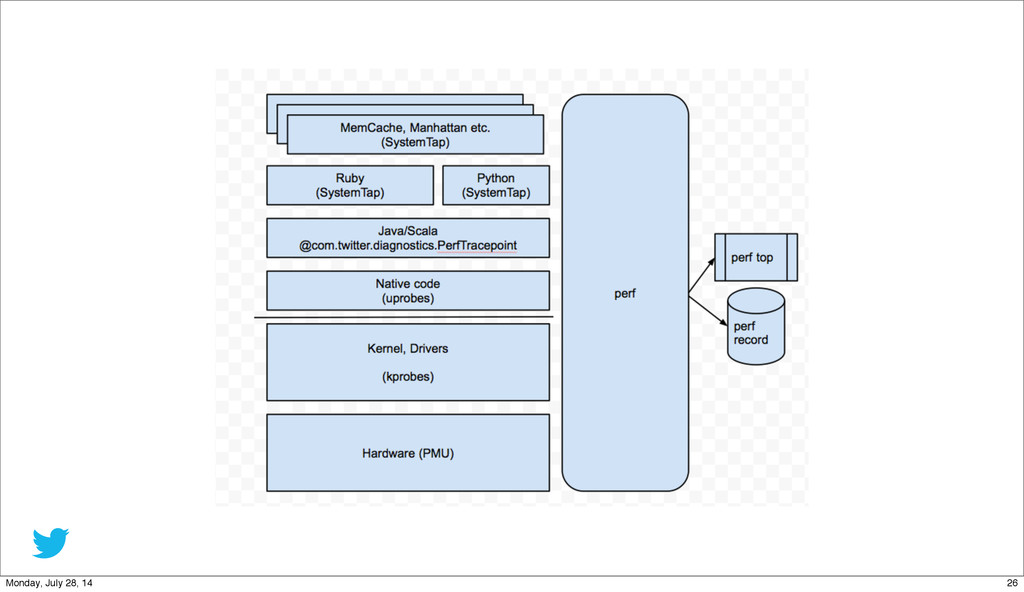
This talk describes a new, low overhead, full stack tool (based on the Linux perf profiler and infrastructure built into the Hotspot JVM) we’ve built at Twitter to help solve this problem of dynamically profiling and tracing the behavior of the kernel and applications (including managed runtimes like the JVM) in production.

Kaushik Srenevasan

July 22, 2014
Tweet

Other Decks in Programming

Transcript

  1. Who am I? • Current (at Twitter) • VM and

    Diagnostics: Ruby (Kiji), Hotspot JVM, Scala • Past (at Microsoft) • Authored the 64 bit optimizing compiler in the Chakra JavaScript runtime • Common Language Runtime (CLR) performance 2 Monday, July 28, 14
  2. Twitter.com from ten thousand feet • Service Oriented Architecture •

    Platform • CentOS Linux • OpenJDK JVM • Languages • Java/Scala, C/C++, Ruby (Kiji) and Python 3 Monday, July 28, 14
  3. JVM @ Twitter • Customized OpenJDK distribution • Dedicated team

    to support and maintain releases • Regular internal release cycle • Ship JDK 7(u) (now) and 8 (future) • Bundle useful tools / JVMTI agents • Twitter University talk: Twitter scale computing with the OpenJDK 5 Monday, July 28, 14
  4. JVM @ Twitter • Why we exist? • Low latency

    garbage collection on dedicated hardware and Mesos • Scala-specific optimizations • Tools • Contrail • The Twitter Diagnostics Runtime 6 Monday, July 28, 14
  5. State of the art • Global, dynamic, arbitrary context kernel

    and user mode instrumentation. • An extremely low overhead, scalable mechanism for aggregating event data. • The ability to execute arbitrary user actions when events occur. 10 Monday, July 28, 14
  6. Guiding principles • Twitter owns the entire stack • Integrate

    well with standard platform tools • Do not reinvent the wheel! 11 Monday, July 28, 14
  7. perf • Linux profiler • Ships in the kernel tree

    • Abstraction over CPU’s performance counters 12 Monday, July 28, 14
  8. Why perf? Benchmark (baseline) Bytecode instrumentation (Heapster) Tracing Yourkit, JVM

    SystemTap Sampling (perf) Sampling (perf, Yourkit) 15 Monday, July 28, 14
  9. Why perf? • Powerful • Mixed mode stacks. • CPU,

    Performance counters (cache, branch etc.), Scheduler latencies ... • Spawn, Attach and “top” modes. 16 Monday, July 28, 14
  10. perf for Managed Code • Traditional managed code (Java) profilers

    • ThreadMXBean.getThreadInfo • JVMTI: GetAllStackTraces • Undocumented AsyncGetCallTrace • Our approach: Make Java look like native code 17 Monday, July 28, 14
  11. Tracing • Scope • System wide • Process specific •

    Application specific? • Export richer, context specific data • Unified event bus 20 Monday, July 28, 14
  12. Tracing in Linux • Function tracing • Tracepoint support •

    kprobes • uprobes • Covers NFS, RPC, Filesystem, Devices, Network, Power, Kernel, Virtualization etc. 21 Monday, July 28, 14
  13. UProbes • Extension of the KProbes infrastructure to support user

    mode tracepoints • Support for predicates • No support for arbitrary user actions (like DTrace) • No support for managed code 22 Monday, July 28, 14
  14. Tracing in native code • Use SystemTap probe format •

    Large number of pre-existing probes • Source level compatibility with DTrace probes • Add support in perf to understand SystemTap probe definitions 23 Monday, July 28, 14
  15. Tracing in managed code • VM level tracing • Existing

    support for DTrace probes • Very heavyweight (not sampled) • Java level tracing 24 Monday, July 28, 14
  16. Open sourcing ... • Understand user interest • Upstream vs

    Publish on Github • Please get in touch 27 Monday, July 28, 14