Upgrade to Pro — share decks privately, control downloads, hide ads and more …

Malhotra (2016) MR_Chapter06

k.projeto
March 24, 2021

Malhotra (2016) MR_Chapter06

Malhotra (2016) MR_Chapter06

k.projeto

March 24, 2021
Tweet

More Decks by k.projeto

Other Decks in Research

Transcript

  1. 6 6 176 Chapter “ ” Objectives [After reading this

    chapter, the student should be able to: ] 1. Discuss and classify survey methods and describe the various telephone, personal, mail, and electronic interviewing methods. 2. Identify the criteria for evaluating survey methods, compare the different methods, and evaluate which is best suited for a particular research project. 3. Explain and classify the different observation methods used by marketing researchers and describe personal observation, mechanical observation, audit, content analysis, and trace analysis. 4. Identify the criteria for evaluating observation methods, compare the different methods, and evaluate which, if any, is suited for a particular research project. 5. Describe the relative advantages and disadvantages of observational methods and compare them to survey methods. 6. Discuss the considerations involved in implementing surveys and observation methods in an international setting. 7. Understand the ethical issues involved in conducting survey and observation research. The key to good descriptive research is knowing exactly what you want to measure and selecting a survey method in which every respondent is willing to cooperate and capable of giving you complete and accurate information efficiently. Jeff Miller, Chief Operating Officer, Burke, Inc.
  2. Descriptive Research Design: Survey and Observation Overview 177 In previous

    chapters, we have explained that once the marketing research problem has been defined (step 1 of the marketing research process) and an appropriate approach developed (step 2), the researcher is in a position to formulate the research design (step 3). As was discussed in Chapter 3, the major types of research designs are exploratory and conclusive. Exploratory designs employ secondary data analysis (Chapter 4) and qualitative research (Chapter 5) as the major methodologies. Conclusive research designs may be classified as causal or descriptive. Causal designs will be explained in Chapter 7. In this chapter, we focus on the major methods employed in descriptive research designs: survey and observation. As was explained in Chapter 3, descriptive research has as its major objective the description of something—usually market characteristics or functions. Survey, or communication, methods may be classified by mode of administration as traditional telephone interviews, computer-assisted telephone interviews, personal in-home interviews, mall-intercept interviews, computer-assisted personal interviews, mail interviews, mail panels, e-mail, and Internet surveys. We describe each of these methods and present a comparative evaluation of all the survey methods. Next, we consider the major observational methods: personal observa- tion, mechanical observation, audit, content analysis, and trace analysis. The relative advantages and disadvantages of observation over survey methods are discussed. The considerations involved in conducting survey and observation research when researching international markets are discussed. Several ethical issues that arise in survey research and observation methods are identified. To begin our discussion, here are some examples of these methods. Real Research Who Will Be the Next President? Internet surveys are gaining in popularity, and the November 2000 U.S. elections provided market researchers with a unique opportunity to test online survey methods, their accuracy, and also their ability to predict elections. Harris Interactive (www.harrisinteractive.com) took the initiative to conduct online Internet polls accurately predicted Barack Obama as the winner in the 2008 presidential election.
  3. 178 PART II • RESEARCH DESIGN FORMULATION research in 73

    different political races, including nationwide votes for president, statewide votes in 38 states, and several senatorial and gubernatorial elections. Interactive online interviews were conducted between October 31 and November 6, 2000, with a total of 240,666 adults who were characterized as likely voters. The results turned out to be almost identical to those found in the nationwide Harris Interactive telephone poll, which happened to be the only other poll to have Bush and Gore tied in its final prediction, with the following results: Real Research Marketing Research: The Japanese Way Japanese companies rely heavily on personal observation as a means of obtaining information. When Canon Cameras (www.canon.com) was losing market share in the United States to Minolta, Canon decided that its distributor, Bell & Howell, was not giving adequate support. However, Canon did not use data from a broad survey of consumers or retailers to make this decision. Instead, it relied on personal observation and sent three managers to the United States to look into the problem. Canon’s head of the team, Tatehiro Tsuruta, spent almost six weeks in America. On entering a camera store, he would act just like a customer. He would note how the cameras were displayed and how the clerks served customers. He observed that the dealers were not enthusiastic about Canon. He also observed that it would not be advantageous for Canon to use drugstores and other discount outlets. This led Canon to open its own sales subsidiary, resulting in increased sales and market share. Its own sales subsidiary was also a major asset in expanding the sales of its digital cameras in the early 2000s. As of 2009, Canon sold its prod- ucts in more than 115 countries worldwide through direct sales and resellers with about 75 percent of its sales generated outside Japan.2 ▪ 2000 Presidential Elections: The Nationwide Vote ERRORS Gore % Bush % Nader % Bush/Gore Spread % Nader % Election Results 48 48 3 — — Harris Interactive (Online) 47 47 4 0 1 Harris Interactive (Phone) 47 47 5 0 2 CBS 45 44 4 1 1 Gallup/CNN/USA Today 46 48 4 2 1 Pew Research 47 49 4 2 1 IBD/CSM/TIPP 46 48 4 2 1 Zogby 48 46 5 2 2 ICR/Politics Now 44 46 7 2 4 NBC/WSJ 44 47 3 3 0 ABC/WashPost 45 48 3 3 0 Battleground 45 50 4 5 1 Rasmussen (Automated Telephone) 49 40 4 9 1 Notes: 1. Undecided and others omitted. 2. The National Council on Published Polls (NCPP) has calculated the error on the spread as being half the difference between the actual spread (i.e., the result) and the spread in the poll. We show it here as the difference (i.e., our estimates of error are twice those shown by NCPP). Source: Courtesy of National Council on Published Polls. The accuracy of the other 72 races turned out to be quite high as well. The accuracy of these online polls in predicting the results of 73 races proved that well-designed Internet surveys can reliably predict elections. Likewise, Internet polls were also accurate in predicting the votes and George W. Bush as the winner in the 2004 presidential election and in predicting Obama as the winner of the 2008 presidential election. Therefore, the popularity of Internet surveys for election polling and other uses is expected to continue to grow.1 ▪
  4. CHAPTER 6 • DESCRIPTIVE RESEARCH DESIGN: SURVEY AND OBSERVATION 179

    survey method A structured questionnaire given to a sample of a population and designed to elicit specific information from respondents. structured data collection Use of a formal questionnaire that presents questions in a prearranged order. fixed-alternative questions Questions that require respondents to choose from a set of predetermined answers. Telephone and Internet interviews, as well as other survey methods, are becoming increasingly popular for predicting election results and have many other applications. Observation methods are employed less frequently, but they too have important uses in marketing research, as indi- cated by the Canon example. Survey Methods The survey method of obtaining information is based on the questioning of respondents. Respondents are asked a variety of questions regarding their behavior, intentions, attitudes, awareness, motivations, and demographic and lifestyle characteristics. These questions may be asked verbally, in writing, or via computer, and the responses may be obtained in any of these forms. Typically, the questioning is structured. Structured here refers to the degree of standardization imposed on the data collection process. In structured data collection, a formal questionnaire is prepared and the questions are asked in a prearranged order; thus the process is also direct. Whether research is classified as direct or indirect is based on whether the true purpose is known to the respondents. As explained in Chapter 5, a direct approach is nondisguised in that the purpose of the project is disclosed to the respondents or is otherwise obvious to them from the questions asked. The structured-direct survey, the most popular data collection method, involves administering a questionnaire. In a typical questionnaire, most questions are fixed-alternative questions that require the respondent to select from a predetermined set of responses. Consider, for example, the following question designed to measure attitude toward department stores: Disagree Agree Shopping in department stores is fun. 1 2 3 4 5 The survey method has several advantages. First, the questionnaire is simple to administer. Second, the data obtained are reliable because the responses are limited to the alternatives stated. The use of fixed-response questions reduces the variability in the results that may be caused by differences in interviewers. Finally, coding, analysis, and interpretation of data are relatively simple.3 Disadvantages are that respondents may be unable or unwilling to provide the desired infor- mation. For example, consider questions about motivational factors. Respondents may not be consciously aware of their motives for choosing specific brands or shopping at specific depart- ment stores. Therefore, they may be unable to provide accurate answers to questions about their motives. Respondents may be unwilling to respond if the information requested is sensitive or personal. Also, structured questions and fixed-response alternatives may result in loss of validity for certain types of data such as beliefs and feelings. Finally, wording questions properly is not easy (see Chapter 10 on questionnaire design). Yet, despite these disadvantages, the survey approach is by far the most common method of primary data collection in marketing research, as illustrated by the political polling example in the “Overview” section and the example of Ariba. Real Research Survey Supports Customer Support Ariba (www.ariba.com), a B2B software provider, utilizes both the Internet and sophisticated computer applications to collect survey data. Ariba has integrated its Vantive Enterprise Customer Relationship Management platform (a proprietary software system) with the Web Survey System from CustomerSat.com. With this setup, Ariba has the ability to gain real-time feedback, track trends, and obtain immediate notification of unsatisfied customers. Other advantages that Ariba receives from this system are the ability to distribute positive data figures to build company morale and to implement best practices procedures as a result of the data. The system works by administering an online survey to each customer (respondent) who asks for customer support. This survey not only gathers specifics about the problem the customer is expe- riencing but also data that can be used to make executive decisions down the road (e.g., current product needs, what customers like/dislike). The system then analyzes the responses and routes the respondent to an appropriate specialist. Customers can rate and comment on their customer support experience within 24 hours of the case being closed. Ariba can use this survey data not only to improve its customer
  5. 180 PART II • RESEARCH DESIGN FORMULATION Survey Methods Personal

    Interviewing Mall Intercept Mail Mail Panel In-Home Computer- Assisted Computer- Assisted E-Mail Internet Traditional Mail Interviewing Electronic Interviewing Telephone Interviewing FIGURE 6.1 A Classification of Survey Methods support system but also to utilize the non-problem-related data to make executive decisions about the direction and offerings of the company. As a result of implementing this system, Ariba’s growth has been phenomenal.4 ▪ Survey methods can be classified based on the mode used to administer the questionnaire. These classification schemes help distinguish among survey methods. Survey Methods Classified by Mode of Administration Survey questionnaires may be administered in four major modes: (1) telephone interviews, (2) personal interviews, (3) mail interviews, and (4) electronic interviews (see Figure 6.1). Telephone interviews may be further classified as traditional telephone interviews or computer-assisted telephone interviews (CATI). Personal interviews may be conducted in the home, as mall-intercept interviews, or as computer-assisted personal interviews (CAPI). The third major method, mail interviewing, takes the form of ordinary mail surveys or surveys conducted using mail panels. Finally, electronic interviews can be conducted via e-mail or administered on the Internet. Of these methods, telephone interviews are the most popular, followed by personal interviews and mail surveys. The use of electronic methods, especially Internet surveys, is growing at a fast pace. We now describe each of these methods. Telephone Methods As stated earlier, telephone interviews can be typed as traditional and computer assisted. Traditional Telephone Interviews Traditional telephone interviews involve phoning a sample of respondents and asking them a series of questions. The interviewer uses a paper questionnaire and records the responses with a pencil. Advances in telecommunications and technology have made nationwide telephone inter- viewing from a central location practical. Consequently, the use of local telephone interviewing has decreased in recent years.5 Computer-Assisted Telephone Interviewing Computer-assisted telephone interviewing from a central location is far more popular than the traditional telephone method. Computer-assisted telephone interviewing (CATI) uses a computer- ized questionnaire administered to respondents over the telephone. A computerized questionnaire may be generated using a mainframe computer, a minicomputer, or a personal computer. The interviewer sits in front of a computer terminal and wears a mini-headset. The computer replaces a paper and pencil questionnaire, and the mini-headset substitutes for a telephone. Upon command, the computer dials the telephone number to be called. When contact is made, the inter- viewer reads questions posed on the computer screen and records the respondent’s answers directly into the computer’s memory bank.
  6. CHAPTER 6 • DESCRIPTIVE RESEARCH DESIGN: SURVEY AND OBSERVATION 181

    In computer-assisted telephone interviewing, the computer systematically guides the interviewer. The computer systematically guides the interviewer. Only one question at a time appears on the screen. The computer checks the responses for appropriateness and consistency. It uses the responses as they are obtained to personalize the questionnaire. The data collection flows natu- rally and smoothly. Interviewing time is reduced, data quality is enhanced, and the laborious steps in the data-collection process, coding questionnaires and entering the data into the com- puter, are eliminated. Because the responses are entered directly into the computer, interim and update reports on data collection or results can be provided almost instantaneously. The Harris Interactive phone survey in the polling example in the “Overview” section made use of CATI, as does the following example. Real Research Telephone Surveys: The Hallmark of Hallmark Because females control more than half of the purchasing decisions in their homes, Hallmark Inc. (www.hallmark.com) did some research on this target market—women. Qualitative research revealed the importance of girlfriends in the life of women. A national telephone survey was conducted asking women ages 18–39 how they first became acquainted with their girlfriends, and how often they kept in touch with their girlfriends. Respondents were asked to rate how likely (or unlikely) they were to share secrets, surprises, disagreements with spouses, and personal (pregnancy) information with their girlfriends. The results showed that 45 percent of women felt that there was an occasion on which they would rather share the information with a female friend than a male friend. It was also found that 81 percent of women “calmly discuss topics when they have a difference in opinion with their girlfriends.” Both of these percentages illustrate a higher probability for females to share information and engage in correspondence. Forty-two percent of the women in the study stated that they have one woman they consider their “best friend.” Thirty-three percent of women live within 10 miles of their best friend, and 28 percent live more than 100 miles away from their best friends. Based on this information, Hallmark launched its new line of cards, “Hallmark Fresh Ink,” that enable women to keep in touch with their girlfriends. Knowing that females were their target market and how much they kept in touch with one another enabled the company to launch a successful new line. Telephone surveys have become the hallmark of Hallmark’s marketing research, enabling the company to formulate successful marketing strategies. As of 2009, Hallmark held more than 50 percent of the market share in the United States for greeting cards sales, and their cards were sold in over 43,000 retail outlets. They also published products in more than 30 languages that were sold in over 100 countries.6 ▪ Several software packages, such as Ci3 by Sawtooth Software (www.sawtoothsoftware.com), are available for conducting CATI. Computer-automated telephone surveys (CATS) systems are capa- ble of dialing and interviewing respondents without any human intervention, other than the digital recording of questions to be asked during the phone survey.
  7. 182 PART II • RESEARCH DESIGN FORMULATION ACTIVE RESEARCH Delta

    Air Lines: Surveying Airline Preferences Visit www.delta.com and search the Internet using a search engine as well as your library’s online databases to obtain information on consumers’ preferences for selecting an airline for domestic travel. As the marketing manager for Delta Air Lines, how would you use information on consumers’ airline preferences for domestic travel to formulate marketing strategies that would increase your market share? What are the advantages and disadvantages of telephone interviewing in conducting a survey to obtain information on consumers’ airline preferences for domestic travel? Would you recommend this method for administering a survey for Delta Air Lines? Personal Methods Personal interviewing methods may be categorized as in-home, mall-intercept, or computer- assisted. Personal In-Home Interviews In personal in-home interviews, respondents are interviewed face-to-face in their homes. The interviewer’s task is to contact the respondents, ask the questions, and record the responses. In recent years, the use of personal in-home interviews has declined due to its high cost. Nevertheless, they are still used, particularly by syndicated firms (see Chapter 4), such as Mediamark Research, Inc. (MRI). Real Research Mediamark: Benchmarking U.S. Households Mediamark (www.mediamark.com) conducts an ongoing, comprehensive study of the adult population of the United States called the National Study. This study, conducted continuously since 1979, surveys the demographics, product usage, and media exposure of all persons age 18 and over in the contiguous 48 states. Respondents are selected on a strict area probability basis. A computer list of more than 90 million households is merged with other sources necessary to construct a properly stratified sample. The sample is composed of three sections: a sample of metropolitan areas; nonmetropolitan counties; and each of 10 major U.S. markets: New York, Los Angeles, Chicago, Philadelphia, San Francisco, Boston, Detroit, Washington, D.C., Cleveland, and Dallas/Ft. Worth. These markets are more heavily sampled to allow MRI to prepare reliable media and marketing estimates on a local market basis. Fieldwork is done in two waves per year, each lasting six months and consisting of approximately 13,000 interviews. Two different methods are used to question the respondent: 1. First, an in-home interview is used to collect demographics and data related to media exposure (including magazines, newspapers, radio, television, cable, Internet, and outdoor). 2. At the end of the interview, the fieldworker leaves behind a self-completing questionnaire booklet covering personal and household usage of some 500 product categories and services and 6,000 brands. Fieldwork is conducted by LHK Partners Inc., Newtown Square, Pennsylvania (www.partnersinc.com). Each fieldworker is thoroughly trained in interviewing techniques as well as in methods of gaining access to respondents and establishing rapport. A wide range of techniques is used to elicit the full cooperation of respondents. Listed households are informed by mail ahead of time that they will be contacted by an interviewer. Up to six separate attempts are made to contact difficult-to-reach respondents. Households presenting language barriers are reassigned to specifically qualified interviewers, as are refusals and other unusual cases. The personal interview takes, on average, 60–65 minutes to complete. At its conclusion, the questionnaire booklet is presented and a $20 payment is offered as an incentive for its completion. The interviewer then makes an appointment to return at a later date to pick it up. Over the years, the National Study has become a source of valuable information on consumers for firms in a variety of industries.7 ▪
  8. CHAPTER 6 • DESCRIPTIVE RESEARCH DESIGN: SURVEY AND OBSERVATION 183

    A mall-intercept interview in progress. Despite their many applications, the use of personal in-home interviews is declining, while mall intercepts are becoming more frequent. Mall-Intercept Personal Interviews In mall-intercept personal interviews, respondents are intercepted while they are shopping in malls and brought to test facilities in the malls. The interviewer then administers a question- naire as in the in-home personal survey. The advantage of mall-intercept interviews is that it is more efficient for the respondent to come to the interviewer than for the interviewer to go to the respondent.8 This method has become increasingly popular and there are several hundred permanent mall research facilities. As the following example shows, mall intercepts are espe- cially appropriate when the respondents need to see, handle, or consume the product before they can provide meaningful information. Real Research Same Name, New Number Stepping into the new millennium, AT&T (www.att.com) had moved from just providing long-distance phone service to offering cable, wireless cellular service, and Internet services. However, most people still viewed the firm purely as an old-fashioned, boring telephone company. Therefore, the company wanted to create a new image of being fun and trendy. Their ad agency, Young & Rubicam (www.yr.com), had the idea of using the logo of AT&T, the blue and white globe, and animate it to be the “spokesperson” in the ads. In order to deter- mine if the logo was recognizable enough, AT&T hired SE Surveys, a New York research firm. The researchers conducted 500 mall-intercept personal interviews in 15 markets to address AT&T’s problem. Mall-intercept interviewing was selected over other survey methods so that the respondents could be shown a picture of the AT&T logo before responding. The consumers were asked if they recognized the logo, which was pictured without the company name. The survey results showed that 75 percent of the entire sample recognized the logo as being representative of AT&T without any help, whereas 77 percent of the 18–24-year-olds and 80 percent of the “high-value, active networkers” recognized the logo. High-value, active networkers are those who spend $75 or more on wireless services or long-distance. Given these positive results, commercials were made that showed the animated logo bouncing about the screen, demonstrating how AT&T’s various services can help an individual or a business. Since then, awareness and perceptions of AT&T’s services have continued to remain high. On March 5, 2006, it was announced that AT&T would acquire BellSouth for $67 billion. Significant synergies were expected to generate earnings per share growth in 2010.9 ▪ A handheld computer can replace paper questionnaires used in in-home and mall-intercept interviewing. Using pen-based computing technology, this system uses the display memory as a software keypad.
  9. 184 PART II • RESEARCH DESIGN FORMULATION Computer-assisted personal interviewing

    (CAPI), such as that using touch screens, is becoming more popular around the world. Computer-Assisted Personal Interviewing (CAPI) In computer-assisted personal interviewing (CAPI), the third form of personal interviewing, the respondent sits in front of a computer terminal and answers a questionnaire on the computer screen by using the keyboard or a mouse. There are several user-friendly electronic packages that design questions that are easy for the respondent to understand. Help screens and courteous error messages are also provided. The colorful screens and on- and off-screen stimuli add to the respondent’s interest and involvement in the task. This method has been classified as a personal interview technique since an interviewer is usually present to serve as a host or hostess and to guide the respondent as needed. CAPI has been used to collect data at shopping malls, product clinics, conferences, and trade shows. One popular way in which CAPI is administered is through the use of kiosks. Real Research TouchScreen: Surveys with the Touch of a Screen TouchScreen Research (www.touchscreenresearch.com.au) is Australia’s leading supplier of touch screen survey software and associated hardware. They have helped a number of clients, including ANZ Bank and Eli Lilly, in collecting market research data. TouchScreen kiosks have also proven extremely popular in Australia because of their sleek and practical design as well as their effectiveness in collecting pertinent data. One of the satisfied clients is Exhibitions and Trade Fairs (ETF), who organized Melbourne and Sydney 2005 Money Expos. ETF introduced visitors in these expos to the Touch Screen Survey Kiosks. ETF, as organizer of this event, was able to identify the benefits of conducting surveys at each of the expos. The data extracted from the surveys provided ETF with specific information such as type and demographics of the visitors who attended the expo, how visitors became aware of the event, and what interest factors attracted visitors to attend. For example, the survey revealed to ETF that the media exposure through PBL Media Group, ACP’s Money magazine, and Channel 9 were very effective from a publicity standpoint. Also, the “one stop shop” approach, bringing mortgage and investment loans, retirement planning, and superannuation/managed funds all under the same roof, was another feature of the expo that attracted visitors. What was more remarkable was the turnaround time. Within 72 hours of the expo closing its doors, TouchScreen Research was able to provide ETF with a PDF file that contained an easy-to-read, well-collated, and comprehensive survey findings. ETF was able to utilize these findings for the purpose of providing valuable selling points when speaking with potential exhibitors and sponsors as well as for planning and strategizing its marketing activities and planning its visitor campaign. It was also able to identify specific target areas for future exhibitions based on this data.10 ▪
  10. CHAPTER 6 • DESCRIPTIVE RESEARCH DESIGN: SURVEY AND OBSERVATION 185

    TABLE 6.1 Some Decisions Related to the Mail Interview Package Outgoing Envelope Outgoing envelope: size, color, return address Postage Method of addressing Cover Letter Sponsorship Signature Personalization Postscript Type of appeal Questionnaire Length Layout Content Color Size Format Reproduction Respondent anonymity Return Envelope Type of envelope Postage Incentives Monetary versus nonmonetary Prepaid versus promised amount Mail Methods Mail interviews, the third major form of survey administration, can be conducted via ordinary mail or the mail panel. Mail Interviews In the traditional mail interview, questionnaires are mailed to preselected potential respondents. A typical mail interview package consists of the outgoing envelope, cover letter, questionnaire, return envelope, and possibly an incentive. The respondents complete and return the question- naires. There is no verbal interaction between the researcher and the respondent.11 However, before data collection can begin, the respondents need to be at least broadly identified. Therefore, an initial task is to obtain a valid mailing list. Mailing lists can be compiled from telephone directories, customer rosters, or association membership rolls, or purchased from publication subscription lists or commercial mailing list companies.12 Regardless of its source, a mailing list should be current and closely related to the population of interest. The researcher must also make decisions about the various elements of the mail interview package (see Table 6.1). Mail surveys are used for a variety of purposes, including measurement of consumer preferences, as illustrated by the following example. Real Research Mint to Be Together The Mint Museum of Art (www.mintmuseum.org) is located in Charlotte, North Carolina, and has a repu- tation as one of the Southeast’s leading cultural institutions. Due to recent changes in the area’s population, the Mint began to wonder if its diverse and vast collection was the best way to present art to the public, and just who this public was. Additionally, the Mint wanted to create a Mint Museum of Craft ϩ Design, but they were not sure if this is what the public would want, or if they would understand the concept. So they hired InterActive Research of Atlanta. InterActive Research created a two-phase study to discover the information desired by the Mint. The goal of the research was to measure awareness, usage, and attitudes toward the existing museum, as well as the plan for the new Museum of Craft + Design. The first phase of the study was qualitative and consisted
  11. 186 PART II • RESEARCH DESIGN FORMULATION mail panels A

    large and nationally representative sample of households who have agreed to periodically participate in mail questionnaires, product tests, and telephone surveys. of 15 focus groups, followed by a quantitative phase that was composed of a detailed questionnaire mailed to approximately 10,000 Charlotte-area residents; 1,300 responses were returned. The results showed that the Mint was perceived as elitist. Respondents also felt that the current collection was too diverse and did not present a coherent theme. People supported the Craft + Design idea of the new museum, but they felt a large educational initiative was needed to inform the public about what exactly this entailed. Pricing and parking were seen as two barriers that currently prevented people from attending, so it was decided this needed to be kept in mind when developing the new building. Entrance fees of $5 to $7 were found to be acceptable, but people didn’t think they would pay to go to the new museum if it cost more than that. The research also implied that the museum should consider offer- ing a joint membership in both of its museums to encourage attendance. Many of these research findings were implemented as of 2008. Based on the research results provided, the Mint decided to consolidate its current collection into a more focused theme—Art in the Americas—and organize it in chronological order. It will occasionally have a European piece, but most of the art will have originated in either North or South America. The maximum admission price was $6 per person and tickets purchased were good for admission to both the Mint Museum of Art and the Mint Museum of Craft + Design as long as they were used on the same day.13 ▪ ACTIVE RESEARCH Restaurant Dining: A Casual Affair? Visit www.outback.com and search the Internet using a search engine as well as your library’s online databases to obtain information on consumers’ preferences for casual restaurants. As the marketing manager for Outback, how would you use information on consumers’ preferences for casual restaurants to formulate marketing strategies that would increase your sales and market share? What are the advantages and disadvantages of mail/mail panel/fax in conducting a survey to obtain information on consumers’ preferences for casual restaurants? Which, if any, of these methods would you recommend for conducting a survey for Outback? Mail Panels Mail panels were introduced in Chapters 3 and 4. A mail panel consists of a large, nationally representative sample of households that have agreed to participate in periodic mail question- naires and product tests. The households are compensated with various incentives. Data on the panel members are updated every year. Because of the panel members’ commitment, the response rates can approach 80 percent. The Consumer Opinion Panel maintained by Synovate (www.synovate.com) consists of a representative sample of more than 600,000 households in the United States and 60,000 in Canada. Several marketing research companies are moving from mail panels to online panels. The NFO World Group (www.nfow.com) claims that one out of every 200 households is a member of their online consumer panel. Mail panels can be used to obtain information from the same respondents repeatedly. Thus, they can be used to implement a longitudinal design. Electronic Methods As mentioned earlier, electronic surveys can be conducted by e-mail or administered on the Internet or the Web. E-Mail Interviews To conduct an e-mail survey, a list of e-mail addresses is obtained. The survey is written within the body of the e-mail message. The e-mails are sent out over the Internet. E-mail surveys use pure text (ASCII) to represent questionnaires and can be received and responded to by anyone with an e-mail address, whether or not they have access to the Web. Respondents type the answers to either closed-ended or open-ended questions at designated places, and click on “reply.” Responses are data entered and tabulated. Note that data entry is typically required.
  12. CHAPTER 6 • DESCRIPTIVE RESEARCH DESIGN: SURVEY AND OBSERVATION 187

    hypertext markup language Hypertext markup language (HTML) is the language of the Web. E-mail surveys have several limitations. Given the technical limitations of most e-mail systems, questionnaires cannot utilize programmed skip patterns, logic checks, or randomiza- tion. The limited intelligence of ASCII text cannot keep a respondent from, say, choosing both “yes” and “no” to a question where only one response is meaningful. Skipping instructions (e.g., “If the answer to question 5 is yes, go to question 9”) must appear explicitly, just as on paper. These factors can reduce the quality of data from an e-mail survey and can require post- survey data cleaning. Another limitation is that some e-mail software products limit the length of the body of an e-mail message. Internet Interviews In contrast to e-mail surveys, Internet or Web surveys use hypertext markup language (HTML), the language of the Web, and are posted on a Web site. Respondents may be recruited over the Internet, from potential respondent databases maintained by the marketing research firm, from an Internet panel, or they can be recruited by conventional methods (mail, telephone). Respondents are asked to go to a particular Web location to complete the survey. Many times, respondents are not recruited; they happen to be visiting the Web site where the survey is posted (or other popular Web sites) and they are invited to participate in the survey. Either all or every ith Web site visitor is allowed to participate. Web surveys offer several advantages as compared to e-mail surveys. It is possible in HTML, but not in ASCII text, to construct buttons, check boxes, and data entry fields that prevent respondents from selecting more than one response where only one is intended, or from otherwise typing where no response is required. Skip patterns can be programmed and performed automatically as in CATI or CAPI. It is possible to validate responses as they are entered. Finally, additional survey stimuli such as graphs, images, animations, and links to other Web pages may be integrated into or around the survey. The responses are collected in an adjoining database. The data require some processing before they can be tabulated or used in a statistical package. All these factors contribute to higher quality data. The Harris Interactive Online survey in the polling example in the “Overview” section was an example of an Internet survey. As indicated by the Harris Interactive Online survey example, other studies have also shown that the results obtained from Internet surveys can be very close to those obtained by using the traditional methods. Internet panels are gaining in popularity and can be an efficient source of obtaining Internet samples (as discussed in more detail in Chapter 11). In fact, many marketing research suppliers and syndicated firms have replaced their traditional mail panels with Internet panels. Internet panels take less time and cost less to build and maintain as compared to mail panels. Several companies offer Internet panels that may be used by other researchers to draw Internet samples by paying the appropriate fee. Such firms include Harris Interactive (www.harrisinteractive.com), Survey Sampling International (www.surveysampling.com), and Greenfield Online (www.greenfieldonline.com). Limitations of e-mail surveys include the need for possible cleanup from the messages; limited forms that must be strictly adhered to by the user to ensure no cleanup is required; and e-mail system compatibility issues. Another drawback is spam. About half of all e-mail traffic is spam that is annoying. The Can Spam Act that became effective January 2, 2004, has been largely ineffective in curbing Spam. For Internet or Web surveys that recruit respondents who are browsing or by placing banner ads, there is inherent self-selection bias. This can be alleviated by using a validated sample, where individ- uals are preselected from a set of e-mail addresses and sent an invitation to the Web site. Web surveys do offer an advantage over e-mail surveys because they can have graphics and sound, can be sent over a secured server, and provide instantaneous feedback. Web surveys can also employ alert systems that can trigger when certain thresholds are met. For instance, if a hotel site reaches its trigger limit for subpar performance, a manager can be immediately notified and can act quickly. Problems, of course, with any Web survey include the fact that bias may be introduced if the respondents answer more than once, and, also for nonvalidated samples, statistical representativeness may be an issue. Basically, Internet research can be just as representative and effective as other traditional methods, especially as the Internet population continues to grow. Problems of conducting research over the Internet must be effectively addressed and resolved, just as the problems with traditional research have been and continue to be.14
  13. 188 PART II • RESEARCH DESIGN FORMULATION Real Research Sony:

    Internet Surveys Capture Music Download Market Shares No company involved with the music industry can ignore the online music market. It is a growing and highly dynamic industry segment. Sony (www.sony.com) is conscious of this fact and has developed an innovative means to determine the views of the lead users of the Internet to capture the pulses of this market. “It just happens that I’m a member of Sony’s PS3 [Playstation Web site] Voice of the Elite,” says Joseph Laszlo, a diehard netizen and gamer. Voice of the elite (VOTE) is a Web-based survey run by Sony on the Playstation Web site. The access to the survey is restricted to select members of the PS Web site who are also serious gamers. Aside from making the respondent feel a bit important, Sony’s surveys are often very interesting. They share some of their results with the respondents, which often provides new insights. Sony regularly shares a result from an earlier survey as part of a current one; this is a good practice for this kind of ongoing loyalty/market research program since everyone wants to know how his or her opinion matches that of the panel. One of the recent surveys was directed toward understanding the online music industry from the user’s point of view. Sony asked its pool of loyal PS3 gamers, “Where do you go online to download music?” Results were as follows: iTunes: 18.8 percent; Napster: 8.6 percent; MusicMatch: 7.8 percent; Rhapsody: 2.9 percent; Buymusic: 2.2 percent; eMusic: 1.7 percent; Other [presumably including the illegal services]: 31.4 percent; and None: 26.6 percent. Sony receives considerable revenues in the form of royalties from legal music downloads. Naturally, Sony’s strategy is to promote legal online music downloading and reduce illegal downloading. To this end, Sony provides access to online music stores through its official Web site (www.sonymusic.com). The survey results presented here gave some interesting insights used to design this service. It suggests that among the very savvy Internet users (assuming gamers are very savvy), iTunes has a large lead, but not as large as you might expect, and that the Napster brand has indeed helped a relative latecomer carve out a number two position among the legal services, at least with this segment of the online population. The options for downloading provided in the Sony site were in good part decided by the results of the survey. Even the positioning of the sites in the list reflects the survey results, with iTunes and Napster finding their way to the top of the list.15 ▪ Several Web-based services are available for fielding online surveys. CreateSurvey (www. createsurvey.com) and Zoomerang (www.zoomerang.com) let you create and administer online sur- veys at their sites. The Survey System (www.surveysystem.com) is a software package available for working with telephone, online, and printed questionnaires. It handles all phases of survey projects, from creating questionnaires through data entry, interviewing, e-mail, or Web page Internet surveys, to producing tables, graphics, and text reports. EFM Feedback (www.vovici.com), Web Online Surveys (web-online-surveys.com), and SurveyPro (www.apian.com) are other popular software for creating Web-based and other surveys. Experiential Experiencing Survey Research Research 1. Use CreateSurvey (www.createsurvey.com) and Zoomerang (www.zoomerang.com) to create a survey questionnaire to measure students’ satisfaction with the campus newspaper. Compare the two sites in terms of (1) ease of creating a survey, (2) flexibility of asking different type of questions, and (3) overall satisfaction. 2. Visit the Web sites of any two of the following survey software companies: EFM Feedback (www.vovici.com), Web Online Surveys (web-online-surveys.com), and SurveyPro (www.apian.com). If you had to recommend the purchase of survey software, which one of the two would you recommend and why? 3. To experience how a sponsor of an Internet survey can monitor results during the field portion of the project, go to http://us.lightspeedpanel.com, read the Lightspeed Mini-poll question, and select “View Results.” 4. Visit Greenfield Online (www.greenfieldonline.com) and take an online survey. Note that you will first have to become a member of the panel to take a survey. Write a brief report about your experience. 5. Visit comScore SurveySite (www.comscore.com) and write a report on SurveySite’s methodology for e-mail surveys, pop-up surveys, and domain departure surveys. ▪
  14. Remember, however, that not all survey methods are appropriate in

    a given situation. Therefore, the researcher should conduct a comparative evaluation to determine which methods are appropriate. A Comparative Evaluation of Survey Methods Table 6.2 compares the different survey methods across a variety of factors. For any particular research project, the relative importance attached to these factors will vary. These factors may be broadly classified as task, situational, and respondent factors. Task factors relate to tasks that have to be performed to collect the data and to the topic of the survey. These factors consist of diversity of questions and flexibility, use of physical stimuli, sample control, quantity of data, and response rate. The situational factors comprise control of the data-collection environment, control of field force, potential for interviewer bias, speed, and cost. The respondent factors pertain to survey respondents and include perceived anonymity, social desirability, obtaining sensitive information, low incidence rate, and respondent control. We discuss in detail the evalu- ation of the different survey methods on each of these factors. Task Factors The demand that the task to be performed places on the respondents and the data collection process influences the survey method that should be used. The nature of the task involved has an impact on the diversity of questions and flexibility, use of physical stimuli, sample control, quan- tity of data, and response rate. DIVERSITY OF QUESTIONS AND FLEXIBILITY The diversity of questions that can be asked in a survey and the flexibility of data collection depend upon the degree of interaction the respondent has with the interviewer and the questionnaire, as well as the ability to actually see the questions. A wide variety of questions can be asked in a personal interview because the respondents can see the questionnaire and an interviewer is present to clarify ambiguities. Because the respondent and the interviewer meet face to face, the interviewer can administer complex questionnaires, explain and clarify difficult questions, and even utilize unstructured techniques. Thus, in-home, mall-intercept, and CAPI allow for high diversity. Flexibility is also high, especially in the case of in-home and mall-intercept interviews but is decreased somewhat in CAPI due to limited interaction with the interviewer. In Internet surveys, multimedia capabilities can be utilized and so the ability to ask a diversity of questions is moderate to high, despite the absence of an interviewer. Moreover, a certain amount of interactivity can be built into the questionnaire enhancing the flexibility. In mail surveys, mail panels, and e-mail surveys, less diversity and flexibility are possible, as the survey is essentially self-administered by the respondent and there is no interviewer present to offer any clarifications. However, the lack of interaction with the interviewer is moderated by the ability to see the questionnaire. Therefore, these methods receive a moderate rating. In traditional telephone interviews and CATI, the respondent cannot see the questions while answering and this limits the diversity of questions. For example, in a telephone interview or CATI, one could not ask respondents to rank 15 brands of automobiles in terms of preference. However, in CATI, as in the case of CAPI and Internet surveys, the researcher can personalize the questionnaire and handle complex skip patterns (directions for skipping questions in the questionnaire based on the subject’s responses), thereby providing some flexibility and resulting in a low to moderate rating. An often-overlooked benefit of Internet survey research is the ease with which an Internet survey can be quickly modified. For example, early data returns may suggest additional ques- tions that should be asked. Changing or adding questions on the fly would be nearly impossible with a mail questionnaire and difficult with personal or telephone questionnaires, but can be achieved in a matter of minutes with some Internet survey systems. USE OF PHYSICAL STIMULI Often it is helpful or necessary to use physical stimuli such as the product, a product prototype, commercials, or promotional displays during the interview. For the most basic example, a taste test involves tasting the product. In other cases, photographs, maps, or other audiovisual cues are helpful. In these cases, personal interviews conducted at central CHAPTER 6 • DESCRIPTIVE RESEARCH DESIGN: SURVEY AND OBSERVATION 189
  15. 190 TABLE 6.2 A Comparative Evaluation of Survey Methods Criteria

    Telephone CATI In-Home Interviews Mall-Intercept Interviews CAPI Mail Surveys Mail Panels E-Mail Internet Task Factors Diversity of questions and flexibility Low to moderate High High Moderate to high Moderate Moderate Moderate Moderate to high Use of physical stimuli Low Moderate to high High High Moderate Moderate Low Moderate Sample control Moderate to high Potentially high Moderate Moderate Low Moderate to high Low Low to moderate Quantity of data Low High Moderate Moderate Moderate High Moderate Moderate Response rate Moderate High High High Low High Low Very low Situational Factors Control of data collection environment Moderate Moderate to high High High Low Low Low Low Control of field force Moderate Low Moderate Moderate High High High High Potential for interviewer bias Moderate High High Low None None None None Speed High Moderate Moderate to high Moderate to high Low Low to moderate High Very high Cost Moderate High Moderate to high Moderate to high Low Low to moderate Low Low Respondent Factors Perceived anonymity of the respondent Moderate Low Low Low High High Moderate High Social desirability Moderate High High Moderate to high Low Low Moderate Low Obtaining sensitive information High Low Low Low to moderate High Moderate to high Moderate High Low incidence rate High Low Low Low Moderate Moderate Moderate High Respondent control Low to moderate Low Low Low High High High Moderate to high
  16. CHAPTER 6 • DESCRIPTIVE RESEARCH DESIGN: SURVEY AND OBSERVATION 191

    sampling frame A representation of the elements of the target population. It consists of a list or set of directions for identifying the target population. random digit dialing (RDD) A technique used to overcome the bias of unpublished and recent telephone numbers by selecting all telephone number digits at random. locations (mall-intercept and CAPI) score high and are preferable to in-home interviews. Mail surveys and mail panels are moderate on this dimension, because sometimes it is possible to mail the facilitating aids or even product samples. Internet surveys are also moderately suitable. Because they are Web-based, the questionnaires can include multimedia elements such as prototype Web pages and advertisements. The use of physical stimuli is limited in traditional telephone interviews, CATI, and also in e-mail surveys. SAMPLE CONTROL Sample control is the ability of the survey mode to reach the units specified in the sample effectively and efficiently.16 At least in principle, in-home personal interviews offer the best sample control. It is possible to control which sampling units are interviewed, who is interviewed, the degree of participation of other members of the household, and many other aspects of data collection. In practice, to achieve a high degree of control the researcher has to overcome several problems. It is difficult to find respondents at home during the day because most people work outside the home. Also, for safety reasons, interviewers are reluctant to venture into certain neighborhoods, and people have become cautious of responding to strangers at their doors. Mall-intercept and CAPI allow only a moderate degree of sample control. Although the interviewer has control over which respondents to intercept, the choice is limited to mall shoppers, and frequent shoppers have a greater probability of being included. Also, potential respondents can intentionally avoid or initiate contact with the interviewer. Compared to mall-intercept, CAPI offers slightly better control, because sampling quotas can be set and respondents randomized automatically. Moderate to high sampling control can be achieved with traditional telephone interviews and CATI. Telephones offer access to geographically dispersed respondents and hard-to-reach areas. These procedures depend upon a sampling frame—a list of population units with their telephone numbers.17 The sampling frames normally used are telephone directories, but tele- phone directories are limited in that (1) not everyone has a phone, (2) some people have unlisted phones, and (3) directories do not reflect new phones in service or recently disconnected phones. While the telephone has achieved an almost total penetration of households in the United States, there are some variations by region and within regions. The percentage of house- holds with unlisted numbers is about 31 percent and varies considerably by geographical region. In large metropolitan areas, it may be as high as 60 percent. The total of unpublished numbers and new phones in service since the directory was published can account for as much as 40 percent of total telephone households in some metropolitan areas.18 The random digit dialing (RDD) technique is used to overcome the bias of unpublished and recent numbers. RDD consists of selecting all 10 (area code, prefix or exchange, suffix) telephone number digits at random. This approach gives all households with telephones an approximately equal chance of being included in the sample, but it suffers from limitations. It is costly and time-consuming to implement, since not all possible telephone numbers are in ser- vice: Although there are 10 billion possible telephone numbers, there are only about 100 million actual household telephone numbers. Also, RDD does not distinguish between telephone numbers that are of interest and those that are not (in a consumer survey, for example, business and government numbers are not of interest). There are several variations of RDD that reduce wasted effort. One variation randomly selects a working exchange and adds a block of four-digit random numbers. In random digit directory designs a sample of numbers is drawn from the directory. These numbers are modified to allow unpublished numbers a chance of being included in the sample. The popular approaches for modification of numbers include (1) adding a constant to the last digit, (2) randomizing the last r digits, and (3) a two-stage procedure. These proce- dures are described and illustrated in Figure 6.2. Of these three methods, adding a constant to the last digit, particularly plus-one sampling, results in high contact rates and representative samples.19 Mail surveys require a list of addresses of individuals or households eligible for inclusion in the sample. Mail surveys can reach geographically dispersed respondents in hard-to-reach areas.20 However, mailing lists are sometimes unavailable, outdated, or incomplete. Typically, telephone and street directories are used for a listing of the general population. Problems with these types of lists have been discussed already. Catalogs of mailing lists contain thousands of lists that can be purchased. Another factor outside the researcher’s control is whether the questionnaire is sample control The ability of the survey mode to reach the units specified in the sample effectively and efficiently. random digit directory designs A research design for telephone surveys in which a sample of numbers is drawn from the telephone directory and modified to allow unpublished numbers a chance of being included in the sample.
  17. 192 PART II • RESEARCH DESIGN FORMULATION answered and who

    answers it. Some subjects refuse to respond because of lack of interest or motivation; others cannot respond because they are illiterate. For these reasons, the degree of sample control in mail surveys is low.21 Mail panels, on the other hand, provide moderate to high control over the sample. They provide samples matched to U.S. Bureau of the Census statistics on key demographic variables. It is also possible to identify specific user groups within a panel and to direct the survey to households with specific characteristics. Specific members of households in the panel can be questioned. Finally, low-incidence groups, groups that occur infrequently in the population, can be reached with panels, but there is a question of the extent to which a panel can be considered to be representative of the entire population. Not all populations are candidates for Internet survey research. The general consumer population is often a poor fit, because many U.S. households do not regularly use Internet services. Although the respondents can be screened to meet qualifying criteria and quotas imposed, the ability to meet quotas is limited by the number and characteristics of respon- dents who visit the Web site. However, there are some exceptions to this broad statement. For example, computer products purchasers and users of Internet services are both ideal populations. Business and professional users of Internet services are also an excellent popu- lation to reach with Internet surveys. Over 90 percent of businesses are currently estimated to have Internet connections. It can be difficult to prevent respondents from completing the Internet survey multiple times. Thus, sample control is low to moderate for Internet surveys targeted at the general population. E-mail surveys suffer from many of the limitations of mail surveys and thus offer low sample control. QUANTITY OF DATA In-home personal interviews allow the researcher to collect large amounts of data. The social relationship between the interviewer and the respondent, as well as the home environment, motivates the respondent to spend more time in the interview. Less effort is required of the respondent in a personal interview than in a telephone or mail interview. The interviewer records answers to open-ended questions and provides visual aids to help with lengthy and complex scales. Some personal interviews last for as long as 75 minutes. In contrast to in-home interviews, mall intercept and CAPI provide only moderate amounts of data. Because these interviews are conducted in shopping malls and other central locations, the respondents’ time is more limited. Typically, the interview time is 30 minutes or less. Addition of a Constant to the Last Digit An integer between 1 and 9 is added to the telephone number selected from the directory. In plus-one sampling the number added to the last digit is 1. Number selected from directory: 404–953–3004 (area code-exchange-block). Add 1 to the last digit to form 404–953–3005. This is the number to be included in the sample. Randomization on the r Last Digits Replace the r (r ϭ 2, 3, or 4) last digits with an equal number of randomly selected digits. Number selected from directory: 212–881–1124. Replace the last four digits of block with randomly selected numbers 5, 2, 8, and 6 to form 212–881–5286. Two-Stage Procedure The first stage consists of selecting an exchange and telephone number from the direc- tory. In the second stage, the last three digits of the selected number are replaced with a three-digit random number between 000 and 999. Cluster 1 Selected exchange: 202–636 Selected number: 202–636–3230 Replace the last three digits (230) with randomly selected 389 to form 202–636–3389. Repeat this process until the desired number of telephone numbers from this cluster is obtained. FIGURE 6.2 Random Digit Directory Designs
  18. CHAPTER 6 • DESCRIPTIVE RESEARCH DESIGN: SURVEY AND OBSERVATION 193

    response rate The percentage of the total attempted interviews that are completed. nonresponse bias When actual respondents differ from those who refuse to participate. critical request The target behavior that is being researched. For example, in recent mall-intercept interviews conducted by General Foods, the interview time was limited to 25 minutes.22 Mail surveys also yield moderate amounts of data. Fairly long questionnaires can be used, since short questionnaires have not been shown to generate higher response rates than long ones, up to a certain limit. The same is true for e-mail and Internet surveys, although the Internet is a better medium in this respect. Mail panels, on the other hand, can generate large amounts of data because of the special relationship between the panel members and the sponsoring organization. For example, the author has used the Synovate (www.synovate.com) panel to administer a ques- tionnaire that took more than an hour to complete. Traditional telephone interviews and CATI result in the most limited quantities of data. They tend to be shorter than other surveys, because respondents can easily terminate the telephone conversation at their own discretion. These interviews commonly last about 15 minutes, although longer interviews may be conducted when the subject matter is of interest to the respondents. Studies indicate that respondents tend to underestimate the length of telephone interviews by as much as 50 percent. This suggests that telephone interviews may be conducted for a longer duration than is currently the practice. RESPONSE RATE Survey response rate is broadly defined as the percentage of the total attempted interviews that are completed. Personal, in-home, mall-intercept and computer- assisted interviews yield the highest response rate (typically between 60 to 80 percent). Problems caused by not-at-homes can often be resolved by calling back at different times. Telephone interviews, traditional and CATI, yield moderate response rates between 40 and 60 percent. These modes also suffer from not-at-homes or no-answers. Higher response rates are obtained by callbacks. Many telephone surveys attempt to call back at least three times. Mail surveys have poor response rates. In a cold mail survey of randomly selected respon- dents, without any pre- or post-mailing contact, the response rate is typically less than 15 percent if there is no incentive. Such low response rate can lead to serious bias (nonresponse bias) because whether a person responds to a mail survey is related to his or her interest in the topic. The magnitude of nonresponse bias increases as the response rate decreases.23 However, use of appropriate response-inducement procedures can increase the response rate in mail surveys to about 80 percent. Response rates in mail panels are high, typically in the 60–80 percent range, because of assured respondent cooperation. Internet surveys have the poorest response rates, even lower than e-mail surveys. This is due to the fact that some respondents may have access to e-mail but not to the Web, and accessing the Web requires more effort and skill. Furthermore, respondents generally need to be connected to the Internet while completing a Web survey; they may not be offline, as with e-mail surveys. If the respondents are prerecruited, they have to log onto a Web site. Many are unwilling to undertake this effort. A comprehensive, though dated, review of the literature covering 497 response rates in 93 journal articles found weighted average response rates of 81.7, 72.3, and 47.3 percent for, respectively, personal, telephone, and mail surveys.24 However, response rates have decreased in recent times. The same review also found that response rates increase with: ᭹ either prepaid or promised monetary incentives ᭹ increase in the amount of monetary incentive ᭹ nonmonetary premiums and rewards (pens, pencils, books) ᭹ preliminary notification ᭹ foot-in-the door techniques These are multiple request strategies. The first request is relatively small, and all or most people agree to comply. The small request is followed by a larger request, called the critical request, which is actually the target behavior. ᭹ personalization (sending letters addressed to specific individuals) ᭹ follow-up letters A further discussion of improving response rates is found in Chapter 12.
  19. 194 PART II • RESEARCH DESIGN FORMULATION field force The

    field force is made up of both the actual interviewers and the supervisors involved in data collection. Situational Factors In any practical situation, the researcher has to balance the need to collect accurate and high- quality data with the budget and time constraints. The situational factors that are important include control of the data collection environment, control of field force, potential for inter- viewer bias, speed, and cost. The first three factors have an impact on the accuracy and quality of data while the latter two dictate constraints that have to be met. CONTROL OF THE DATA COLLECTION ENVIRONMENT The degree of control a researcher has over the environment in which the respondent answers the questionnaire is another factor that differentiates the various survey modes. Personal interviews conducted at central locations (mall intercept and CAPI) offer the greatest degree of environmental control. For example, the researcher can set up a special facility for demonstrating the product. In-home personal interviews offer moderate to high control because the interviewer is present. Traditional telephone and CATI offer moderate control. The interviewer cannot see the environment in which the interview is being conducted, but he or she can sense the background conditions and encourage the respondent to be attentive and involved. In mail surveys and panels, e-mail, and Internet surveys, the researcher has little control over the environment, as the interview is self-administered by the respondents in an environment they choose. CONTROL OF FIELD FORCE The field force consists of interviewers and supervisors involved in data collection. Because they require no such personnel, mail surveys, mail panels, e-mail, and Internet surveys eliminate field force problems. Traditional telephone interviews, CATI, mall intercept, and CAPI all offer moderate degrees of control because the interviews are conducted at a central location, making supervision relatively simple. In-home personal interviews are problematic in this respect. Since many interviewers work in many different locations, continual supervision is impractical.25 POTENTIAL FOR INTERVIEWER BIAS An interviewer can bias the results of a survey by the manner in which he or she (1) selects respondents (interviewing somebody else when required to interview the male head of household), (2) asks research questions (omitting questions), and (3) records answers (recording an answer incorrectly or incompletely). The extent of the interviewer’s role determines the potential for bias.26 In-home and mall-intercept personal interviews are highly susceptible to interviewer bias given the face-to-face interaction between the interviewer and the respondent. Traditional telephone interviews and CATI are less susceptible, although the potential is still there; there is interaction but it is not face-to-face. For example, with inflection and tone of voice, interviewers can convey their own attitudes and thereby suggest answers. Computer-assisted personal interviews have a low potential for bias. Mail surveys, mail panels, e-mail, and Internet surveys are free of it. SPEED The Internet is by far the fastest method of obtaining data from a large number of respondents. First, there is the speed with which a questionnaire can be created, distributed to respondents, and the data returned. Since printing, mailing, and data keying delays are eliminated, the researcher can have data in hand within hours of writing an Internet questionnaire. Data are obtained in electronic form, so statistical analysis software can be programmed to process standard questionnaires and return statistical summaries and charts automatically. The e-mail survey is also fast, although slower than the Internet since greater time is needed to compile an e-mail list and data entry is also required. Traditional telephone interviews and CATI are also fast ways of obtaining information. When a central telephone facility is used, several hundred telephone interviews can be done per day. Data for even large national surveys can be collected in two weeks or less. Next in speed, with moderate to high rating, are mall-intercept and computer-assisted interviews that reach potential respondents in central locations. In-home personal interviews, with a moderate rating, are slower, because there is dead time between interviews while the inter- viewer travels to the next respondent. To expedite data collection, interviews can be conducted in different markets or regions simultaneously. Mail surveys are typically the slowest. It usually takes several weeks to receive completed questionnaires; follow-up mail- ings take even longer. In a recent study comparing two survey methods, the mean number of days respondents took for the e-mail surveys was a mere 4.3, compared with 18.3 for the mail
  20. CHAPTER 6 • DESCRIPTIVE RESEARCH DESIGN: SURVEY AND OBSERVATION 195

    perceived anonymity The respondent’s perceptions that their identities will not be discerned by the interviewer or the researcher. social desirability The tendency of the respondents to give answers that may not be accurate but that may be desirable from a social standpoint. incidence rate Incidence rate refers to the rate of occurrence or the percentage of persons eligible to participate in the study. survey. Mail panels are faster than mail surveys, with a low to moderate rating, because little follow-up is required.27 COST For large samples, the cost of Internet surveys is the lowest. Printing, mailing, keying, and interviewer costs are eliminated, and the incremental costs of each respondent are typically low, so studies with large numbers of respondents can be done at substantial savings compared to mail, telephone, or personal surveys. However, when the sample size is small, the programming costs can be substantial and other low-cost methods such as mail and e-mail surveys should also be considered. Personal interviews tend to be the most expensive mode of data collection per completed response. In general, Internet, e-mail, mail surveys, mail panel, traditional telephone, CATI, CAPI, mall-intercept, and personal in-home interviews require progressively larger field staff and greater supervision and control. Hence, the cost increases in this order. However, relative costs depend on the subject of inquiry and the procedures adopted.28 Respondent Factors Since surveys are generally targeted at specific respondent groups, the respondent characteris- tics should also be considered while selecting a survey method. These factors include perceived anonymity, social desirability, obtaining sensitive information, low incidence rate, and respon- dent control. PERCEIVED ANONYMITY Perceived anonymity refers to the respondents’ perceptions that the interviewer or the researcher will not discern their identities. Perceived anonymity of the respondent is high in mail surveys, mail panels, and Internet surveys because there is no contact with an interviewer while responding. It is low in personal interviews (in-home, mall intercept, and computer-assisted) due to face-to-face contact with the interviewer. Traditional telephone interviews and CATI fall in the middle as the contact with the interviewer is not face-to-face. It is also moderate with e-mail. Although there is no contact with the interviewer, respondents know that their names can be located on the return e-mail. SOCIAL DESIRABILITY/SENSITIVE INFORMATION Social desirability is the tendency of the respondents to give answers that are socially acceptable, whether or not they are true. Because mail surveys, mail panels, and Internet surveys do not involve any social interaction between the interviewer and the respondent, they are least susceptible to social desirability. Evidence suggests that such methods are good for obtaining sensitive information such as that related to financial or personal behavior. Traditional telephone interviews and CATI are moderately good at avoiding socially desirable responses. They are good for obtaining sensitive information, because the respondents have the perception that they are not committing to anything in writing over the telephone.29 E-mail is only moderately good for controlling social desirability and obtaining sensitive information, given the respondents’ awareness that their names can be located on the return e-mail. Personal interviews, whether in-home, mall intercept, or computer-assisted, are limited in this respect, although the problem is somewhat mitigated in the case of computer-assisted interviews due to limited interaction with the interviewer.30 As can be seen, perceived anonymity, social desirability, and obtaining sensitive information are interrelated criterion. With some exceptions, social desirability is the mirror image of perceived anonymity. When perceived anonymity is high, social desirability is low and vice versa. With some exceptions, obtaining sensitive information is directly related to perceptions of anonymity. Respondents are more willing to give sensitive information when they perceive that their responses will be anonymous. LOW INCIDENCE RATE Incidence rate refers to the rate of occurrence or the percentage of persons eligible to participate in the study. As will be discussed in more detail in Chapter 12, incidence rate determines how many contacts need to be screened for a given sample size requirement. There are times when the researcher is faced with a situation where the incidence rate of the survey respondents is low. This is generally the case when the population represents a niche or a highly targeted market, rather than the general population. Suppose a study of cosmetics for Avon calls for a sample of females age 18 to 27 who have used a cosmetic foundation at least twice in the past week. Estimates show that such people
  21. 196 PART II • RESEARCH DESIGN FORMULATION TABLE 6.3 Additional

    Survey Methods Method Advantages/Disadvantages Comment Completely automated telephone surveys (CATS) Same as CATI Useful for short, in-bound surveys initiated by respondent. Wireless phone interview (voice-based format) Same as CATI Useful for point-of-purchase survey if respondent cooperation is obtained. Wireless phone interview (text-based format) Same as e-mail Useful for point-of-purchase survey if respondent cooperation is obtained. In-office interview Same as in-home interview Useful for interviewing busy managers. Central location interview Same as mall-intercept interview Examples include trade shows, conferences, exhibitions, purchase-intercepts. Kiosk-based computer interview Same as CAPI See www.intouchsurvey.com for more information. Fax interview Same as mail survey, except higher response rate Useful in some business surveys. . Drop-off survey Same as mail survey, except higher cost and higher response rate Useful for local-market surveys. who would qualify to participate in the study represent only 5 percent of the population. Thus, only 1 in every 20 people in the general population would qualify, resulting in a lot of wasted effort if the general population is sampled. In such cases, a survey method should be selected that can locate the qualified respondents efficiently and minimize waste. The telephone interview can be very effective (high rating) as a method of screening potential respondents to determine eligibility. All it takes is a phone call. The three personal methods (in-home, mall intercept, and CAPI) are all inefficient because the interviewer has to make personal contact with potential respondents. Three of the self-administered methods (mail, mail panel, and e-mail) are moderate in terms of efficiency as all three are relatively low cost and can be used to contact a large number of potential respondents so the desired sample size of qualified respondents is obtained. The Internet, however, is very good in this respect (high rating). In an Internet survey, screening questions can be used to weed out ineligible respondents quickly and efficiently. RESPONDENT CONTROL Methods that allow respondent control over the interviewing process will solicit greater cooperation and are therefore desirable. Two aspects of control are particularly important to the respondents. The first is control over when to answer the survey, and the flexibility to even answer it in parts at different times, especially if the survey is long. The second aspect of control pertains to the ability of the respondent to regulate the rate at which she answers the survey, i.e., the flexibility to answer the survey at her own pace. Three of the self-administered methods, namely mail, mail panel, and e-mail, are the best (high rating) in terms of imparting this control to respondents. Some control is lost in Internet surveys, because in random pop-up surveys the respondents do not have the flexibility of answering at a later time. However, Internet surveys can be designed to allow respondents to come back and complete them, resulting in moderate to high rating. Telephone surveys are low to moderate as the pace is regulated by the interviewer, and although the telephone call can be rescheduled, the respondent must commit to a specific time. All the three personal methods, namely in-home, mall intercept, and CAPI, are low on this factor as the pace is regulated by the interviewer, and generally the interview cannot be rescheduled. Some Other Survey Methods We have covered the basic survey methods. Other survey methods are also used, which are variations of these basic methods. The more popular of these other methods are described in Table 6.3.
  22. CHAPTER 6 • DESCRIPTIVE RESEARCH DESIGN: SURVEY AND OBSERVATION 197

    Project Research Personal In-Home Interviews In the department store project, personal in-home interviews were utilized, for a number of reasons. Many diverse questions were asked. Some questions were complex and a relatively large amount of data had to be collected. The information obtained was not sensitive or threatening. Trained students were used as interviewers, thereby reducing the cost. Another critical consideration was that the personal interviews could be conducted without subcontracting the data collection to a field service organization. Telephone methods were not chosen due to the complexity of the questions and amount of data needed. Mall intercept and CAPI were not appropriate either, because so much data were needed. The use of a central location facility would have necessitated subcontracting with a field service organization. Mail surveys were ruled out due to low response rate and complexity of the information needed. Mail panels were inappro- priate given the complexity of information needed; a self-administered questionnaire was not considered to be appropriate. Electronic methods were not chosen because many people in the target market did not have access to e-mail or the Internet when the survey was conducted. ▪ Real Research P&G’s Tide: Getting the Buzz with Nielsen BuzzMetrics Nielsen BuzzMetrics’ (www.nielsenbuzzmetrics.com) BrandPulse suite of products—BrandPulse and BrandPulse Insight—measure consumer-generated media to help companies understand consumer needs, reactions, and issues. BrandPulse helps answer basic and fundamental questions about the volume, spread, and influence of word-of-mouth practices and consumer-to-consumer recommendations on a company or brand. BrandPulse Insight provides the latest information on hot consumer trends, up-to-the-minute data about growing consumer concerns, safety/quality issues, or sudden shifts in consumer opinions. It generates verifiable data about the online consumers who are best suited to influence and shape word-of-mouth behavior. Tide (www.tide.com), one of the most popular consumer brands in the world from P&G, wanted to boost its consumer image for a variety of reasons. Tide’s feedback system needed to spread information and brand data more quickly to receive complete data and identify niche markets. Tide chose BrandPulse suite to redesign its feedback system. Tide is now capturing and assimilating on one platform consumer feedback from all incoming sources, including word of mouth. Tide’s Web site has a whole new look and feel, with consumers receiving instant self-service answers to many of their queries about Tide products and issues. Those requiring follow-up are automatically routed to the appropriate consumer relations representative. Consumers with stain questions are linked to Tide’s “Stain Detective,” and when appro- priate, other consumers are offered surveys, study opportunities, coupons, or special promotions. All functions are powered by Nielsen BuzzMetrics’ tools but maintain the look and feel of Tide’s Web site. Such proactive gathering of information helps in the development of new products as well. This is Selection of Survey Methods As is evident from Table 6.2 and the preceding discussion, no survey method is superior in all situations. Depending upon such factors as information requirements, budgetary constraints (time and money), and respondent characteristics, none, one, two, or even all methods may be appropriate.31 Remember that the various data-collection modes are not mutually exclusive. Rather, they can be employed in a complementary fashion to build on each other’s strengths and compensate for each other’s weaknesses. The researcher can employ these methods in combina- tion and develop creative methods. To illustrate, in a classic project, interviewers distributed the product, self-administered questionnaires, and returned envelopes to respondents. Traditional telephone interviews were used for follow-up. Combining the data-collection modes resulted in telephone cooperation from 97 percent of the respondents. Furthermore, 82 percent of the ques- tionnaires were returned by mail.32 In the chapter introduction, we illustrated how election polling successfully used telephone and Internet interviewing. However, caution should be exercised when using different methods in the same domestic marketing research project (also called the use of mixed-mode surveys). The method used may affect the responses obtained and hence the responses obtained by different methods may not be comparable. The results of studies examining the effect of survey methods on respondents are not very consistent. The following department store project example illustrates the selection of a survey mode, whereas the P&G example illustrates the use of a combination of survey methods.
  23. 198 PART II • RESEARCH DESIGN FORMULATION unstructured observation Observation

    that involves a researcher monitoring all relevant phenomena without specifying the details in advance. natural observation Observing behavior as it takes place in the environment. contrived observation The behavior is observed in an artificial environment. reflected in the number of product improvements Tide has made. P&G had modified this product 22 times in its 21 years of existence. It also makes modifications to cater to market segments such as geogra- phies. For example, a Tide bar was introduced in the Indian market after considering the opinion of its Indian users.33 ▪ Observation Methods Observation methods are the second type of methodology used in descriptive research. Observation involves recording the behavioral patterns of people, objects, and events in a systematic manner to obtain information about the phenomenon of interest. The observer does not question or communicate with the people being observed. Information may be recorded as the events occur or from records of past events. Observational methods may be structured or unstructured, direct or indirect. Furthermore, observation may be conducted in a natural or contrived environment.34 Structured Versus Unstructured Observation In structured observation, the researcher specifies in detail what is to be observed and how the measurements are to be recorded. An example would be an auditor performing inventory analysis in a store. This reduces the potential for observer bias and enhances the reliability of the data. Structured observation is appropriate when the marketing research problem has been clearly defined and the information needed has been specified. In these circumstances, the details of the phenomenon to be observed can be clearly identified. Structured observation is suitable for use in conclusive research. In unstructured observation, the observer monitors all aspects of the phenomenon that seem relevant to the problem at hand, for example, observing children playing with new toys. This form of observation is appropriate when the problem has yet to be formulated precisely and flexibility is needed in observation to identify key components of the problem and to develop hypotheses. In unstructured observation, potential for observer bias is high. For this reason, the observation findings should be treated as hypotheses to be tested, rather than as conclusive findings. Thus, unstructured observation is most appropriate for exploratory research. Disguised Versus Undisguised Observation In disguised observation, the respondents are unaware that they are being observed. Disguise enables respondents to behave naturally, since people tend to behave differently when they know they are being observed. Disguise may be accomplished by using one-way mirrors, hidden cameras, or inconspicuous mechanical devices. Observers may be disguised as shoppers or sales clerks or in other appropriate roles. In undisguised observation, the respondents are aware that they are under observation. For example, they may be aware of the presence of the observer. Researchers disagree on how much effect the presence of an observer has on behavior. One viewpoint is that the observer effect is minor and short-lived. The other position is that the observer can seriously bias the behavior patterns.35 Natural Versus Contrived Observation Natural observation involves observing behavior as it takes place in the environment. For example, one could observe the behavior of respondents eating fast food at Burger King. In contrived observation, respondents’ behavior is observed in an artificial environment, such as a test kitchen set up in a shopping mall. The advantage of natural observation is that the observed phenomenon will more accurately reflect the true phenomenon. The disadvantages are the cost of waiting for the phenomenon to occur and the difficulty of measuring the phenomenon in a natural setting. The Canon Cameras example in the “Overview” section presented an example of unstructured, disguised observation in a natural setting. Observation Methods Classified by Mode of Administration As shown in Figure 6.3, observation methods may be classified by mode of administration as personal observation, mechanical observation, audit, content analysis, and trace analysis. observation The recording of behavioral patterns of people, objects, and events in a systematic manner to obtain information about the phenomenon of interest. structured observation Observation techniques where the researcher clearly defines the behaviors to be observed and the methods by which they will be measured.
  24. CHAPTER 6 • DESCRIPTIVE RESEARCH DESIGN: SURVEY AND OBSERVATION 199

    personal observation An observational research strategy in which human observers record the phenomenon being observed as it occurs. Observation Methods Personal Observation Mechanical Observation Audit Content Analysis Trace Analysis FIGURE 6.3 A Classification of Observation Methods mechanical observation An observational research strategy in which mechanical devices rather than human observers record the phenomenon being observed. Project Research License Plate Personal Observation In the department store project, license plate observations could be used to establish the primary trading area of a shopping mall. These observations help marketers determine where their customers live. In a license plate study, observers record the license plate numbers of the automobiles in a parking lot. These numbers are fed into a computer and paired with automobile registration data. This results in a map of customers located by census tract or zip codes. Such a map, along with other demographic data, can help a department store chain determine new locations, decide on billboard space, and target direct marketing efforts. License plate observation studies cost less ($5,000 to $25,000) and are believed to be quicker and more reliable than direct communication methods such as interviews with shoppers. ▪ Mechanical Observation In mechanical observation, mechanical devices, rather than human observers, record the phenom- enon being observed. These devices may or may not require the respondents’ direct participation. They are used for continuously recording ongoing behavior for later analysis. Of the mechanical devices that do not require respondents’ direct participation, the Nielsen audimeter is best known. The audimeter is attached to a television set to continually record what channel the set is tuned to. Recently, people meters have been introduced. People meters attempt to measure not only the channels to which a set is tuned but also who is watching.37 Arbitron has developed the portable people meter, a device worn by people that measures their TV and radio programming during their waking hours. The PreTesting Company (www.pretesting.com) uses the People Reader that unobtrusively records reading material and reader’s eye movements to deter- mine the reader’s habits, the stopping power, and the brand recall associated with different size ads. Other common examples include turnstiles that record the number of people entering or leaving a building, and traffic counters placed across streets to determine the number of vehicles passing certain locations. On-site cameras (still, motion picture, or video) are increasingly used by retailers to assess package designs, counter space, floor displays, and traffic flow patterns. Technological advances such as the universal product code (UPC) have made a major impact on mechanical observation. The UPC system, together with optical scanners, allows for mechanized information collection regarding consumer purchases by product category, brand, store type, price, and quantity (see scanner data in Chapter 4). The Internet can be a very good source for observation and can provide valuable informa- tion. The observations can be made in a variety of ways. The primary observations can be made by the number of times the Web page is visited. The time spent on the page can also be measured by advanced techniques of starting the timer when the person visiting the page clicks on a certain Personal Observation In personal observation, a researcher observes actual behavior as it occurs, as in the Canon Cameras example in the “Overview” section. The observer does not attempt to control or manipulate the phenomenon being observed. The observer merely records what takes place. For example, a researcher might record traffic counts and observe traffic flows in a department store. This information could aid in designing store layout and determining location of indi- vidual departments, shelf locations, and merchandise displays. Companies like Microsoft also make use of personal observation in learning about the software needs of users.36 Another example is provided in the context of the department store project.
  25. 200 PART II • RESEARCH DESIGN FORMULATION psychogalvanometer An instrument

    that measures a respondent’s galvanic skin response. galvanic skin response Changes in the electrical resistance of the skin that relate to a respondent’s affective state. voice pitch analysis Measurement of emotional reactions through changes in the respondent’s voice. response latency The amount of time it takes to respond. icon and stopping the timer when the person clicks on the next button. Further, various other links can be provided by the researcher on the Web page, and it can be observed to see which links are accessed more often. This will provide the researcher with important information about the information needs of the individuals and also the interests of the target segment. The analysis of the links from where the company site is being approached by the individuals will provide the market researcher with important information regarding the consumers’ related interests, and an in-depth analysis of the link sites will provide information on advertising, competitors, consumers, and target market demographics and psychographics. Web-based tracking of Internet users is one exciting and controversial electronic observation technique. Web surfers are served cookies. The cookie is a group of letters and numbers stored in a Web surfer’s browser that identify the user. It is a sophisticated means by which a Web site can collect information on visitors. Often this process takes place without the Web surfer’s knowledge. Companies and individuals that host Web sites use cookies to collect marketing research informa- tion on visitors. Cookies follow the traveler through the Web site and record the pages accessed by the visitor and the number of minutes spent on each page. Your name, address, phone number, and access site can be collected by the cookie and saved into a database if the visitor enters any infor- mation. During a follow-up visit, the cookie accesses this information and has the ability to repeat it to the visitor. In essence, the cookie collects data on the user during every visit to the site. The online advertising company DoubleClick (www.doubleclick.com) uses the information obtained from cookies to target advertising. For example, if a user visits an airline site and then a hotel site, that individual will be targeted with Delta Air Lines and Marriott advertisements. Such practices are controversial because they raise privacy concerns amongst individuals and policy makers. In contrast to the Internet, many mechanical observation devices do require active respondent involvement. These mechanical devices may be classified into five groups: (1) eye-tracking monitors, (2) pupilometers, (3) psychogalvanometers, (4) voice pitch analyzers, and (5) devices measuring response latency. Eye-tracking equipment, such as oculometers, eye cameras, or eye view minuters, records the gaze movements of the eye. These devices can be used to determine how a respondent reads an advertisement or views a TV commercial and for how long the respon- dent looks at various parts of the stimulus. Such information is directly relevant to assessing advertising effectiveness. The pupilometer measures changes in the diameter of the pupils of the respondent’s eyes. Respondents are asked to look at a screen on which an advertisement or other stimulus is projected. Image brightness and distance from the respondents’ eyes are held constant. Changes in pupil size are interpreted as changes in cognitive (thinking) activity resulting from exposure to the stimulus. The underlying assumption is that increased pupil size reflects interest and positive attitudes toward the stimulus.38 The psychogalvanometer measures galvanic skin response (GSR) or changes in the electri- cal resistance of the skin.39 The respondent is fitted with small electrodes that monitor electrical resistance and is shown stimuli such as advertisements, packages, and slogans. The theory behind this device is that physiological changes such as increased perspiration accompany emotional reactions. Excitement leads to increased perspiration, which increases the electrical resistance of the skin. From the strength of the response, the researcher infers the respondent’s interest level and attitudes toward the stimuli. Voice pitch analysis measures emotional reactions through changes in the respondent’s voice. Changes in the relative vibration frequency of the human voice that accompany emotional reaction are measured with audio-adapted computer equipment.40 Response latency is the time a respondent takes before answering a question. It is used as a measure of the relative preference for various alternatives.41 Response time is thought to be directly related to uncertainty. Therefore, the longer a respondent takes to choose between two alternatives, the closer the alternatives are in terms of preference. On the other hand, if the respondent makes a quick decision, one alternative is clearly preferred. With the increased popu- larity of computer-assisted data collection, response latency can be recorded accurately and without the respondent’s awareness. Technological developments are giving rise to new ways of observation. Tools such as func- tional magnetic resonance imaging (fMRI) that were originally developed to see brain tumors are now being used to see how someone reacts to different stimulants. The use of these devices allows a researcher to place an item such as brand in front of a person and see exactly what part of the brain the product affects and how strongly. These tools help measure the emotional and thought
  26. CHAPTER 6 • DESCRIPTIVE RESEARCH DESIGN: SURVEY AND OBSERVATION 201

    pantry audit A type of audit where the researcher inventories the brands, quantities, and package sizes of products in a consumer’s home. content analysis The objective, systematic, and quantitative description of the manifest content of a communication. Real Research Mirro: “Nonsticking” Itself from a Sticky Situation In 2004, Global Home Products LLC purchased the Mirro, Regal, and WearEver brands and combined them to form The WearEver Company (www.wearever.com). Mirro manufactures inexpensive cookware and conducted exploratory research to try to increase market share by introducing a new product. The objective of the research was to determine what characteristics could be added to their kitchenware in order to be more beneficial to the user. The company hired Metaphase design group (www.metaphase.com) to conduct observational market research by using in-house personal meetings with female heads of households. The cities that Metaphase targeted were St. Louis, Boston, and San Francisco. All in-house observations were videotaped for later analysis. The results showed that the most problematic activities involving kitchenware were its pouring characteristics, its storage problems, and its difficulty to clean. More specifically, the company found, “Pouring was a problem, as was moving food in and out of the pan. And people didn’t know what to do with their lids while they were cooking. They complained about the mess that lids leave when you have to set them on the counter or on the stove top.” Metaphase also noted that most consumers were unhappy with the ability of “nonstick” pans to not stick. After analyzing the results, Mirro, along with Metaphase, designed a new pot, Allegro, that had a square top with a circular bottom. The square top allowed for easier storage, the ability to pour more carefully, and added volume. All three of these features were directly related to the exploratory research results that the company obtained. The results of the new product were explained by president Gerry Paul: “Allegro sales have topped expectations, and production has finally caught up with the overwhelming demand generated by the early infomercials. Consumer reaction is very good.”42 ▪ Audit In an audit, the researcher collects data by examining physical records or performing inventory analysis. Audits have two distinguishing features. First, data are collected personally by the researcher. Second, the data are based upon counts, usually of physical objects. Retail and wholesale audits conducted by marketing research suppliers were discussed in the context of secondary data (see Chapter 4). Here we focus on the role of audits in collecting primary data. In this respect, an important audit conducted at the consumer level, generally in conjunction with one of the survey methods, is the pantry audit. In a pantry audit, the researcher takes an inven- tory of brands, quantities, and package sizes in a consumer’s home, perhaps in the course of a personal interview. Pantry audits greatly reduce the problem of untruthfulness or other forms of response bias. However, obtaining permission to examine consumers’ pantries can be difficult, and the fieldwork is expensive. Furthermore, the brands in the pantry may not reflect the most preferred brands or the brands purchased most often. For these reasons, audits are most common at the retail and wholesale level, and these audits were discussed in Chapter 4. Content Analysis Content analysis is an appropriate method when the phenomenon to be observed is communica- tion, rather than behavior or physical objects. It is defined as the objective, systematic, and quantitative description of the manifest content of a communication.43 It includes observation as well as analysis. The unit of analysis may be words (different words or types of words in the message), characters (individuals or objects), themes (propositions), space and time measures (length or duration of the message), or topics (subject of the message). Analytical categories for classifying the units are developed and the communication is broken down according to prescribed rules. Marketing research applications involve observing and analyzing the content or message of advertisements, newspaper articles, television and radio programs, and the like. For example, the frequency of appearance of blacks, women, and members of other minority processes associated with decision making and highlight how the brain functions during a decision- making process. By discovering what elements trigger positive brain responses, marketers may be able to devise more appealing products or more effective advertising campaigns. Use of eye-tracking monitors, pupilometers, psychogalvanometers, and voice pitch analyzers assumes that physiological reactions are associated with specific cognitive and affective responses. This has yet to be clearly demonstrated. Furthermore, calibration of these devices to measure physiological arousal is difficult and they are expensive to use. Another limitation is that respondents are placed in an artificial environment and know that they are being observed.
  27. 202 PART II • RESEARCH DESIGN FORMULATION groups in mass

    media has been studied using content analysis. Suppose we wanted to examine how the portrayal of women in U.S. magazine advertising has changed, positively or negatively, over the 10-year period from 1998 to 2008. We could select a sample of 100 magazines that were in circulation in 1998 as well as in 2008. We could select 10 advertisements featuring women for each of these magazines, from different issues of each magazine, for 1998 as well as 2008. This will give us a sample of 1,000 advertisements for each year. We could then develop positive as well as negative categories for classifying the advertisements based on how they have portrayed the role of women. The number and percentage of advertisements falling in the positive and negative categories could then be compared. The analysis might look something like this: Real Research Cross-Cultural Content Makes Ad Agencies Content As of 2009, the United States accounts for half of the world’s advertising expenditures, followed by Japan, which accounts for 10 percent. Content analysis was used to compare the information content in American and Japanese magazine advertising. Six categories of magazines (general, women’s, men’s, professional, sports, and entertainment) were chosen from each country. Advertisements from these magazines were selected for analysis, resulting in a total of 1,440 advertisements: 832 from American magazines and 608 from Japanese magazines. Three judges independently noted whether each advertisement was informative or uninformative, which criteria for information content were satisfied by the advertisement, the size of the ad, and the product category being advertised. Japanese magazine advertising was found to be consis- tently more informative than U.S. magazine advertising. For example, more than 85 percent of the Japanese ads analyzed satisfied at least one criterion for information content and thus were perceived to be informative, compared to only 75 percent of the American ads. Likewise, Japanese ads had an average of 1.7 information cues per ad, compared to 1.3 cues per ad for the American ads. This information is useful for multinational companies and advertising agencies including Young & Rubicam, Saatchi & Saatchi Worldwide, McCann Erickson Worldwide, Ogilvy & Mather Worldwide, BBDO Worldwide, and others with global operations conducting cross-cultural advertising campaigns.44 ▪ Content analysis can involve tedious coding and analysis. However, microcomputers and main- frames can be used to facilitate coding and analysis. The manifest content of the object can be computer coded. The observed frequencies of category codes can be aggregated and compared on the criteria of interest using computers. Although content analysis has not been widely used in marketing research, the technique offers great potential. For example, it could be profitably employed in the analysis of open-ended questions. 1998 2008 Categories Number Percentage Number Percentage Positive Intelligent 100 10 150 15 Contributes to society 200 20 350 35 Positive role model 150 15 200 20 Total Positive 450 45 700 70 Negative Sex symbol 350 35 150 15 Looked down upon 200 20 150 15 Total Negative 550 55 300 30 Grand Total 1,000 100 1,000 100 This analysis indicates that the positive portrayal of women in U.S. magazine advertising has gone up dramatically, increasing from 45 percent in 1998 to 70 percent in 2008. The greatest increase is in the contribution to society category, which has increased from 20 percent in 1998 to 35 percent in 2008. On the other hand, the negative portrayal of women as sex symbols has markedly decreased from 35 percent in 1998 to 15 percent in 2008. In the department store patronage project, content analysis may be used to analyze magazine advertisements of the sponsoring and competing stores to compare their projected images. Content analysis has also been used in cross-cultural advertising research, as in the following example.
  28. CHAPTER 6 • DESCRIPTIVE RESEARCH DESIGN: SURVEY AND OBSERVATION 203

    trace analysis An approach in which data collection is based on physical traces, or evidence, of past behavior. Trace Analysis An observation method that can be inexpensive if used creatively is trace analysis. In trace analysis, data collection is based on physical traces, or evidence, of past behavior. These traces may be left intentionally or unintentionally by the respondents. To illustrate, in the context of the department store patronage project, store charge card slips are traces shoppers leave behind, which can be analyzed to examine their store credit usage behavior. Several other innovative applications of trace analysis have been made in marketing research. ᭹ The selective erosion of tiles in a museum indexed by the replacement rate was used to determine the relative popularity of exhibits. ᭹ The number of different fingerprints on a page was used to gauge the readership of various advertisements in a magazine. ᭹ The position of the radio dials in cars brought in for service was used to estimate share of listening audience of various radio stations. Advertisers used the estimates to decide on which stations to advertise. ᭹ The age and condition of cars in a parking lot were used to assess the affluence of customers. ᭹ The magazines people donated to charity were used to determine people’s favorite magazines. ᭹ Internet visitors leave traces that can be analyzed to examine browsing and usage behavior by using cookies. Real Research Have a Cookie! Many users do not realize it, but they have been served a cookie or two while on the Internet. A cookie is not a culinary delight in this case. It is a sophisticated means by which a Web site can collect information on visitors. Often this process takes place without the knowledge of the Web surfer. The cookie is a group of letters and numbers stored in a Web surfer’s browser that identify the user. Companies and individuals that host Web sites use cookies to collect marketing research information on visitors. Cookies follow the traveler through the Web site and record the pages accessed by the visitor and the number of minutes spent on each page. Your name, address, phone number, and access site can be collected by the cookie and saved into a database if you enter any information. During a follow-up visit, the cookie accesses this information and has the ability to repeat it to you. In essence, the cookie collects data on the user during every visit to the site. Expedia (www.expedia.com) uses cookies to collect information about site traffic. The information helps marketing personnel at the travel site to collect demographics on the reader. Also, the company can monitor “hits” on particular topics and gain valuable feedback on user interest. Data collection is based upon visitor behavior. This disguised technique enables Expedia to monitor use patterns and to eliminate socially acceptable response bias. Information collected in this manner has been used to modify editorial content and format to make the Web site more appealing and useful to visitors.45 ▪ Although trace analysis has been creatively applied, it has limitations. Current evidence indicates that it should be used only when no other approach is possible. Moreover, ethical issues, such as the use of cookies, should be duly addressed. ACTIVE RESEARCH Observing the Popularity of Theme Park Exhibits Visit www.disney.com and search the Internet using a search engine as well as your library’s online databases to obtain information on the criteria that consumers use for selecting theme parks. If Disney World wants to determine how many people visit its theme parks on a daily basis and which are the most popular exhibits, can the observation method be used? If yes, which observation method would you use? As the marketing manager for Disney World, how would you use information on criteria that consumers use for selecting theme parks to formulate marketing strategies that would increase your attendance and market share?
  29. 204 PART II • RESEARCH DESIGN FORMULATION TABLE 6.4 A

    Comparative Evaluation of Observation Methods Criteria Personal Observation Mechanical Observation Audit Content Analysis Trace Analysis Degree of structure Low Low to high High High Medium Degree of disguise Medium Low to high Low High High Ability to observe in natural setting High Low to high High Medium Low Observation bias High Low Low Medium Medium Analysis bias High Low to medium Low Low Medium General remarks Most flexible Can be intrusive Expensive Limited to communications Method of last resort A Comparative Evaluation of Observation Methods A comparative evaluation of the observation methods is given in Table 6.4. The different observation methods are evaluated in terms of the degree of structure, degree of disguise, ability to observe in a natural setting, observation bias, measurement and analysis bias, and additional general factors. Structure relates to the specification of what is to be observed and how the measurements are to be recorded. As can be seen from Table 6.4, personal observation is low, trace analysis is medium, and audit and content analysis are high on the degree of structure. Mechanical observation can vary widely from low to high depending upon on the methods used. Methods such as optical scanners are very structured in that the characteristics to be measured, for example, characteristics of items purchased scanned in supermarket checkouts, are precisely defined. Thus, these methods are high in the degree of structure. In contrast, mechanical methods such as use of hidden cameras to observe children at play with toys tend to be unstructured. The degree of disguise is low in the case of audits because it is difficult to conceal the identity of auditors. Personal observation offers a medium degree of disguise because there are limitations on the extent to which the observer can be disguised as a shopper, sales clerk, employee, and so forth. Trace analysis and content analysis offer a high degree of disguise as the data are collected “after the fact,” that is, after the phenomenon to be observed has taken place. Some mechanical observations, such as hidden cameras, offer excellent disguise whereas the use of others, such as the use of psychogalvanometers, is very difficult to disguise. The ability to observe in a natural setting is low in trace analysis because the observation takes place after the behavior has occurred. It is medium in the case of content analysis because the communication being analyzed is only a limited representation of the natural phenomenon. Personal observation and audits are excellent on this score as human observers can observe people or objects in a variety of natural settings. Mechanical observation methods vary from low (e.g., use of psychogalvanometers) to high (e.g., use of turnstiles). Observation bias is low in the case of mechanical observation because a human observer is not involved. It is also low for audits. Although the auditors are humans, the observation usually takes place on objects and the characteristics to be observed are well defined, leading to low observation bias. Observation bias is medium for trace analysis and content analysis. In both these methods, human observers are involved, and the characteristics to be observed are not that well defined. However, the observers typically do not interact with human respondents during the observation process, thus lessening the degree of bias. It is high for personal observation due to the use of human observers who interact with the phenomenon being observed. Data analysis bias is low for audits and content analysis because the variables are precisely defined, the data are quantitative, and statistical analysis is conducted. Trace analysis has a medium degree of bias because the definition of variables is not very precise. Mechanical observation methods can have a low (e.g., scanner data) to medium (e.g., hidden camera) degree of analysis bias depending on the method. Unlike personal observation, the bias in mechanical observation is limited to the medium level due to improved measurement and classification, because the phenomenon to be observed can be recorded continuously using mechanical devices.
  30. CHAPTER 6 • DESCRIPTIVE RESEARCH DESIGN: SURVEY AND OBSERVATION 205

    Project Research Project Activities 1. Do you think that the use of personal in-home interviews was the best method in the Sears project? Why or why not? 2. If the Sears survey were to be conducted today, which survey method should be used and why? 3. Discuss the use of personal and mechanical observation methods to determine consumer preferences for department stores. ▪ A Comparison of Survey and Observation Methods Only about 1 percent of the marketing research projects rely solely on observational methods to obtain primary data.46 This implies that observational methods have some major disadvantages as compared to survey methods. Yet these methods offer some advantages that make their use in conjunction with survey methods quite fruitful. Relative Advantages of Observation The greatest advantage of observational methods is that they permit measurement of actual behavior rather than reports of intended or preferred behavior. There is no reporting bias, and potential bias caused by the interviewer and the interviewing process is eliminated or reduced. Certain types of data can be collected only by observation. These include behavior patterns that the respondent is unaware of or unable to communicate. For example, information on babies’ toy preferences is best obtained by observing babies at play, because they are unable to express themselves adequately. Moreover, if the observed phenomenon occurs frequently or is of short duration, observational methods may be cheaper and faster than survey methods. Relative Disadvantages of Observation The most serious disadvantage of observation is that the reasons for the observed behavior may not be determined because little is known about the underlying motives, beliefs, attitudes, and prefer- ences. For example, people observed buying a brand of cereal may or may not like it themselves. They may be purchasing that brand for someone else in the household. Another limitation of obser- vation is that selective perception (bias in the researcher’s perception) can bias the data. In addition, observation is often time-consuming and expensive, and it is difficult to observe certain forms of behavior such as personal activities. Finally, in some cases the use of observational methods may be unethical, as in monitoring the behavior of people without their knowledge or consent. To sum up, observation has the potential to provide valuable information when properly used. From a practical standpoint, it is best to view observation methods as a complement to survey methods, rather than as being in competition with them. The following example illustrates this point. Real Research How Do You Like Your Beef? When people shop for meat at the grocery store, they tend to stick with what they know. This is what was found when marketing research was conducted for the National Cattlemen’s Beef Association (NCBA). The research was performed to help the NCBA (www.beef.org) figure out why the sales of certain cuts of beef had been dropping by 20 percent over a period of 4 years. The research used mechanical observation and customer interviews. The researchers stationed themselves at the meat cases of stores in order to record the buying behavior of consumers. The consumers were videotaped while shopping for beef. These observations showed that many consumers were not purchasing certain cuts of beef even when they looked good and were less In addition, personal observation is the most flexible. Human observers can observe a wide variety of phenomena in a wide variety of settings. Some mechanical observation methods such as use of psychogalvanometers can be very intrusive, leading to artificiality and bias. Audits using human auditors tend to be expensive. Content analysis is well suited for and limited to the observation of communications. As mentioned earlier, trace analysis is a method of last resort. The application of these criteria will lead to the identification of an appropriate method, if observation is at all suitable in the given situation.
  31. 206 PART II • RESEARCH DESIGN FORMULATION mystery shopping Trained

    observers pose as consumers and shop at company- or competitor-owned stores to collect data about customer–employee interaction and other marketing variables. fattening than the more popular sirloin or ground beef. When these consumers were asked why they didn’t buy certain cuts of beef, the overwhelming response was that they didn’t know how to cook them. The NCBA took several steps to address this situation. Appropriate cooking instructions for the cut of meat are now clearly printed on the package. Additionally, the NCBA worked with grocers to change the store layout to display beef according to the cooking method. There are labels above each section that state not only the nutritional facts, but also the ways in which a cut of beef may be prepared. Small recipe cards have also been placed alongside the beef cuts. The demand for beef and cattle held steady during the tough economic environment of 2008. In fact, the good news for the beef industry was that the demand for live cattle was up 1.5 percent for January–July 2008 compared to the same months of 2007.47 ▪ Ethnographic Research Ethnographic research is the study of human behavior in its natural context and involves observation of behavior and setting along with depth interviews. Sometimes audio and visual recordings are also obtained. Thus, both the questioning and observation methods are combined to understand the behavior of consumers. The following example illustrates this method. Real Research PortiCo Documents with Documentaries PortiCo Research (www.porticoresearch.com) specializes in observing individuals, questioning them in depth, recording them on videos, and selling these tapes for tens of thousands of dollars to its major clients, such as Honda, Delta, Lipton, and Procter & Gamble. They have fine-tuned the method of collecting ethno- graphic data and have made it into a very profitable business. PortiCo’s specialty is total immersion in the lives of consumers in an effort to document how they make purchasing decisions. Research teams of anthropologists, social psychologists, and ethnographers (profes- sionals who comparatively study people) go into the subjects’ homes with videographers. The teams tape the subjects in their homes and also go shopping with them to watch what they buy and ask questions on the reasons for their purchases. After filming, employees of PortiCo transcribe the findings of the videos and analyze them for their clients. The analysis is based on the research problem that the client has set out to solve or get more information about. For example, PortiCo did a large study for Lipton to find out people’s attitudes toward tea. With the results of the study, Lipton would find out whether or not to invest more in advertising, develop new flavors, or market more iced tea instead of hot tea. The findings showed that Americans don’t drink very much hot tea, especially because of the presence of caffeinated coffee in the marketplace. If and when they do drink hot tea, it is normally flavored, herbal tea. Most of Lipton’s hot tea is not in special flavors. However, they have recently begun to bring herbal teas to market. The study did find, however, that American consumers like iced tea. As a result of the findings, Lipton has done a lot of creative developments in the area of iced tea. They pushed the marketing of Brisk Iced Tea in the can, which is now the number one selling brand of ready-to-drink iced tea. Also, Lipton has created a Cold Brew Blend tea bag in both family size, to make a whole pitcher, and single-glass size, for one serving. This tea bag allows iced tea to be brewed with cold water instead of having to use boiling water. Therefore, consumers can enjoy their tea faster with much less hassle. These marketing efforts, guided by the findings of PortiCo Research, have resulted in increased sales and market share for Lipton.48 ▪ Other Methods In addition to ethnographic research, there are also a variety of other methods that combine the use of questioning and observation. One such method that is commonly used is mystery shopping. Trained observers pose as consumers and shop at company- or competitor-owned stores to collect data about customer–employee interaction and other marketing variables, such as prices, displays, layout, and so on. The mystery shoppers question the store employees, mentally take note of the answers, and observe the variables of interest. For more information on mystery shopping and firms that provide this service, visit www.mysteryshop.org. International Marketing Research Given the differences in the economic, structural, informational and technological, and sociocul- tural environments, the feasibility and popularity of the different interviewing methods vary widely. Table 6.5 provides an illustration of how cultural and environmental factors may have an impact on
  32. CHAPTER 6 • DESCRIPTIVE RESEARCH DESIGN: SURVEY AND OBSERVATION 207

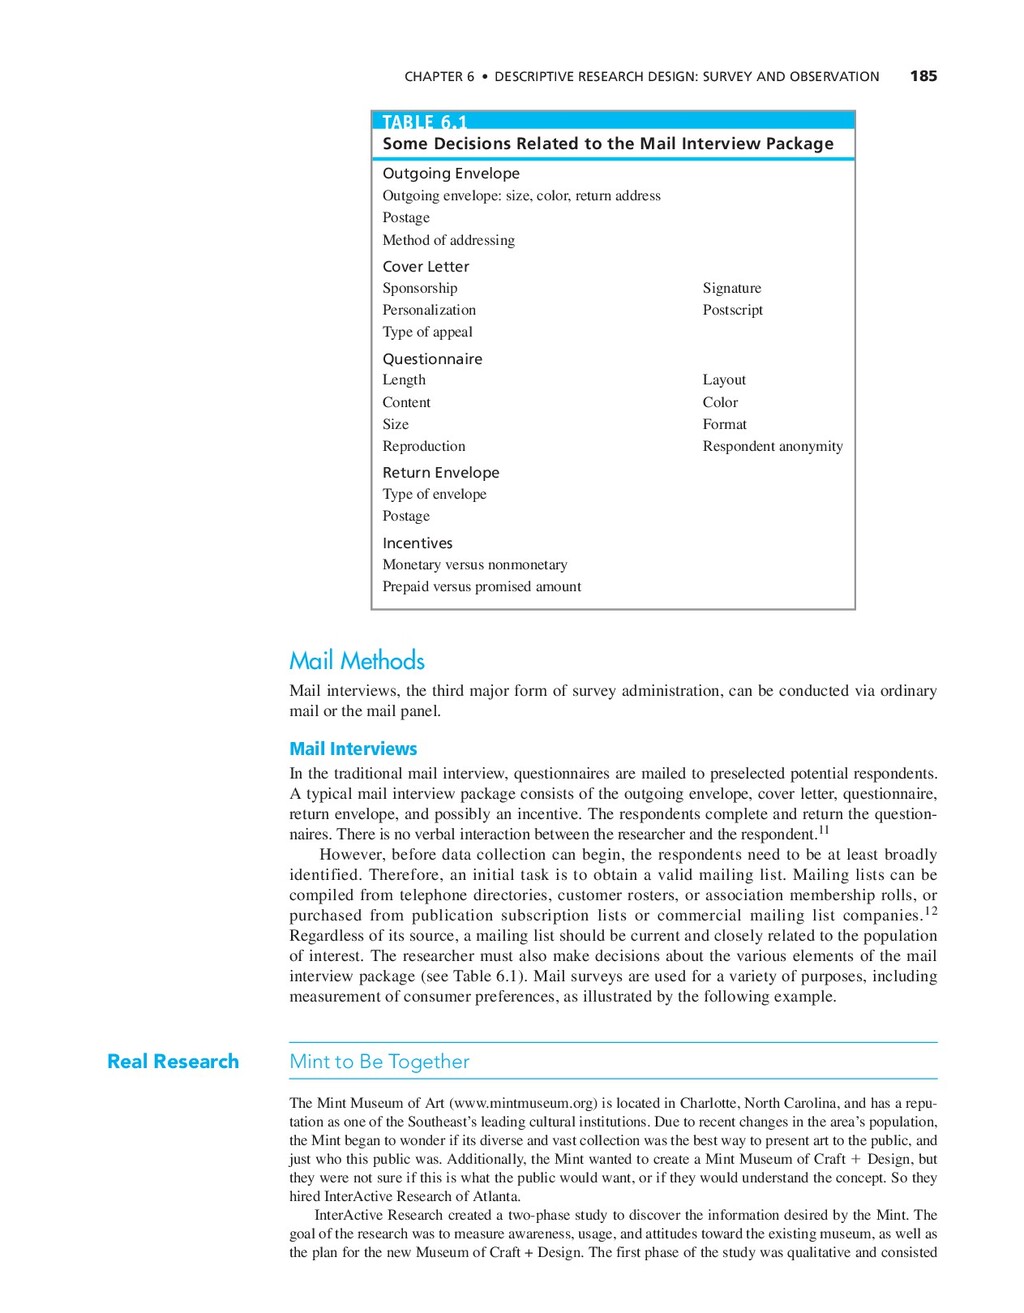
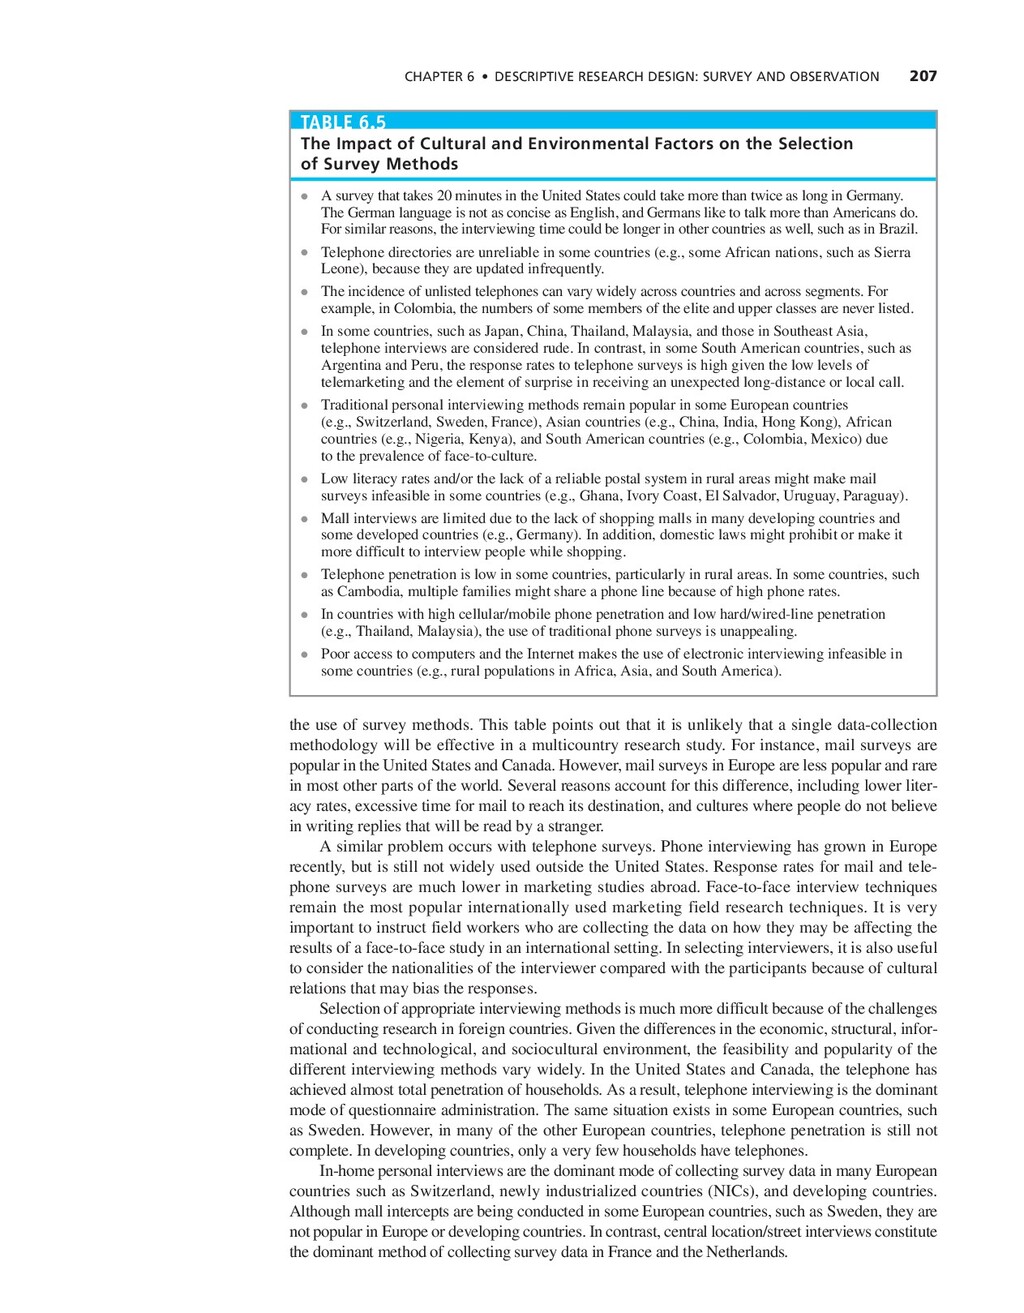
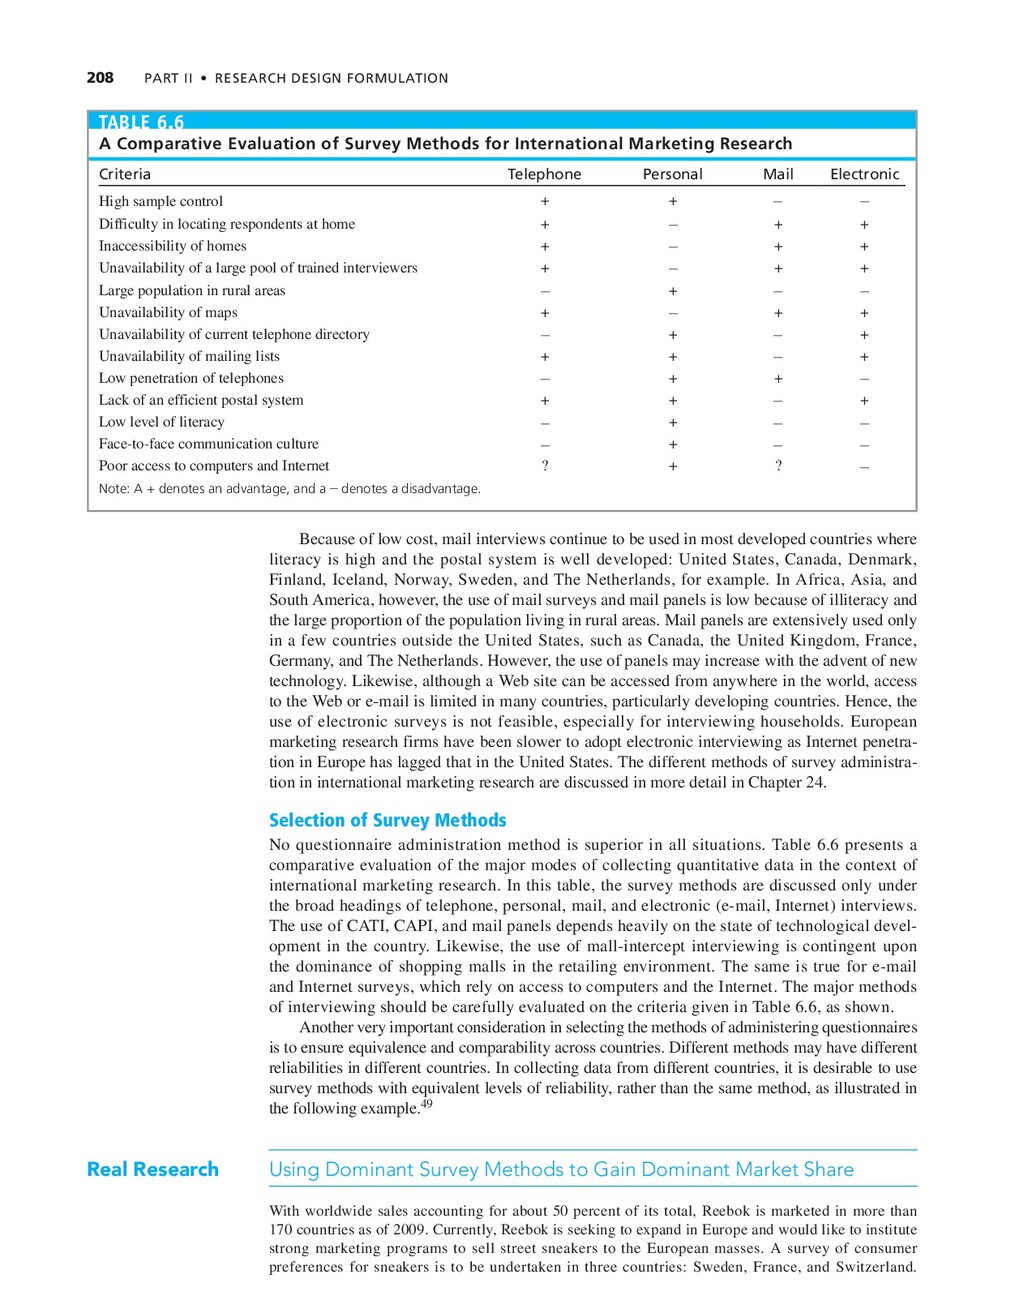
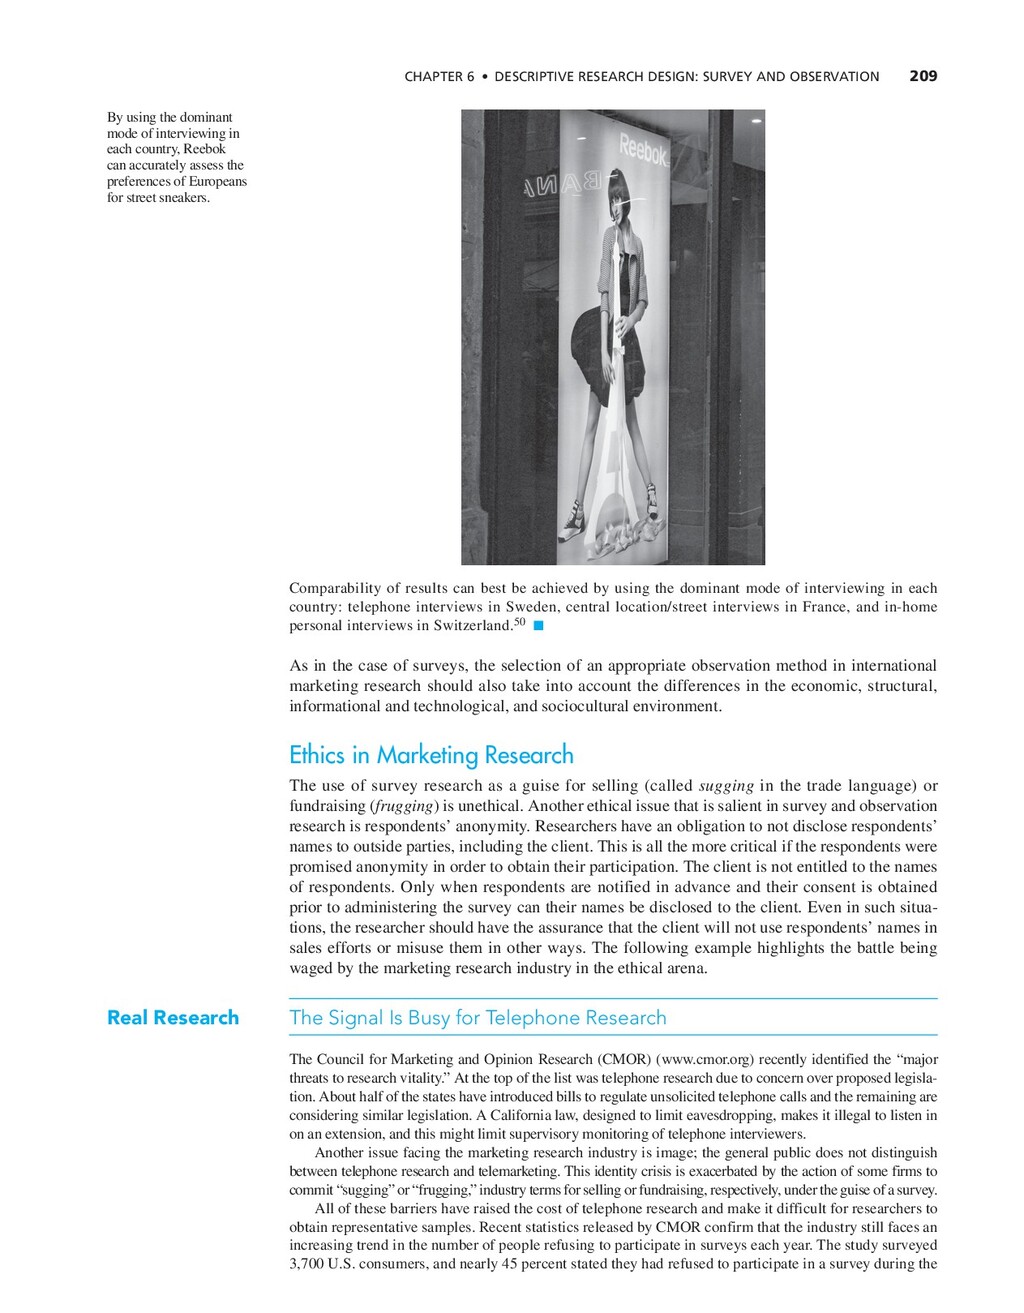
    TABLE 6.5 The Impact of Cultural and Environmental Factors on the Selection of Survey Methods ᭹ A survey that takes 20 minutes in the United States could take more than twice as long in Germany. The German language is not as concise as English, and Germans like to talk more than Americans do. For similar reasons, the interviewing time could be longer in other countries as well, such as in Brazil. ᭹ Telephone directories are unreliable in some countries (e.g., some African nations, such as Sierra Leone), because they are updated infrequently. ᭹ The incidence of unlisted telephones can vary widely across countries and across segments. For example, in Colombia, the numbers of some members of the elite and upper classes are never listed. ᭹ In some countries, such as Japan, China, Thailand, Malaysia, and those in Southeast Asia, telephone interviews are considered rude. In contrast, in some South American countries, such as Argentina and Peru, the response rates to telephone surveys is high given the low levels of telemarketing and the element of surprise in receiving an unexpected long-distance or local call. ᭹ Traditional personal interviewing methods remain popular in some European countries (e.g., Switzerland, Sweden, France), Asian countries (e.g., China, India, Hong Kong), African countries (e.g., Nigeria, Kenya), and South American countries (e.g., Colombia, Mexico) due to the prevalence of face-to-culture. ᭹ Low literacy rates and/or the lack of a reliable postal system in rural areas might make mail surveys infeasible in some countries (e.g., Ghana, Ivory Coast, El Salvador, Uruguay, Paraguay). ᭹ Mall interviews are limited due to the lack of shopping malls in many developing countries and some developed countries (e.g., Germany). In addition, domestic laws might prohibit or make it more difficult to interview people while shopping. ᭹ Telephone penetration is low in some countries, particularly in rural areas. In some countries, such as Cambodia, multiple families might share a phone line because of high phone rates. ᭹ In countries with high cellular/mobile phone penetration and low hard/wired-line penetration (e.g., Thailand, Malaysia), the use of traditional phone surveys is unappealing. ᭹ Poor access to computers and the Internet makes the use of electronic interviewing infeasible in some countries (e.g., rural populations in Africa, Asia, and South America). the use of survey methods. This table points out that it is unlikely that a single data-collection methodology will be effective in a multicountry research study. For instance, mail surveys are popular in the United States and Canada. However, mail surveys in Europe are less popular and rare in most other parts of the world. Several reasons account for this difference, including lower liter- acy rates, excessive time for mail to reach its destination, and cultures where people do not believe in writing replies that will be read by a stranger. A similar problem occurs with telephone surveys. Phone interviewing has grown in Europe recently, but is still not widely used outside the United States. Response rates for mail and tele- phone surveys are much lower in marketing studies abroad. Face-to-face interview techniques remain the most popular internationally used marketing field research techniques. It is very important to instruct field workers who are collecting the data on how they may be affecting the results of a face-to-face study in an international setting. In selecting interviewers, it is also useful to consider the nationalities of the interviewer compared with the participants because of cultural relations that may bias the responses. Selection of appropriate interviewing methods is much more difficult because of the challenges of conducting research in foreign countries. Given the differences in the economic, structural, infor- mational and technological, and sociocultural environment, the feasibility and popularity of the different interviewing methods vary widely. In the United States and Canada, the telephone has achieved almost total penetration of households. As a result, telephone interviewing is the dominant mode of questionnaire administration. The same situation exists in some European countries, such as Sweden. However, in many of the other European countries, telephone penetration is still not complete. In developing countries, only a very few households have telephones. In-home personal interviews are the dominant mode of collecting survey data in many European countries such as Switzerland, newly industrialized countries (NICs), and developing countries. Although mall intercepts are being conducted in some European countries, such as Sweden, they are not popular in Europe or developing countries. In contrast, central location/street interviews constitute the dominant method of collecting survey data in France and the Netherlands.
  33. 208 PART II • RESEARCH DESIGN FORMULATION TABLE 6.6 A

    Comparative Evaluation of Survey Methods for International Marketing Research Criteria Telephone Personal Mail Electronic High sample control + + - - Difficulty in locating respondents at home + - + + Inaccessibility of homes + - + + Unavailability of a large pool of trained interviewers + - + + Large population in rural areas - + - - Unavailability of maps + - + + Unavailability of current telephone directory - + - + Unavailability of mailing lists + + - + Low penetration of telephones - + + - Lack of an efficient postal system + + - + Low level of literacy - + - - Face-to-face communication culture - + - - Poor access to computers and Internet ? + ? - Note: A + denotes an advantage, and a - denotes a disadvantage. Because of low cost, mail interviews continue to be used in most developed countries where literacy is high and the postal system is well developed: United States, Canada, Denmark, Finland, Iceland, Norway, Sweden, and The Netherlands, for example. In Africa, Asia, and South America, however, the use of mail surveys and mail panels is low because of illiteracy and the large proportion of the population living in rural areas. Mail panels are extensively used only in a few countries outside the United States, such as Canada, the United Kingdom, France, Germany, and The Netherlands. However, the use of panels may increase with the advent of new technology. Likewise, although a Web site can be accessed from anywhere in the world, access to the Web or e-mail is limited in many countries, particularly developing countries. Hence, the use of electronic surveys is not feasible, especially for interviewing households. European marketing research firms have been slower to adopt electronic interviewing as Internet penetra- tion in Europe has lagged that in the United States. The different methods of survey administra- tion in international marketing research are discussed in more detail in Chapter 24. Selection of Survey Methods No questionnaire administration method is superior in all situations. Table 6.6 presents a comparative evaluation of the major modes of collecting quantitative data in the context of international marketing research. In this table, the survey methods are discussed only under the broad headings of telephone, personal, mail, and electronic (e-mail, Internet) interviews. The use of CATI, CAPI, and mail panels depends heavily on the state of technological devel- opment in the country. Likewise, the use of mall-intercept interviewing is contingent upon the dominance of shopping malls in the retailing environment. The same is true for e-mail and Internet surveys, which rely on access to computers and the Internet. The major methods of interviewing should be carefully evaluated on the criteria given in Table 6.6, as shown. Another very important consideration in selecting the methods of administering questionnaires is to ensure equivalence and comparability across countries. Different methods may have different reliabilities in different countries. In collecting data from different countries, it is desirable to use survey methods with equivalent levels of reliability, rather than the same method, as illustrated in the following example.49 Real Research Using Dominant Survey Methods to Gain Dominant Market Share With worldwide sales accounting for about 50 percent of its total, Reebok is marketed in more than 170 countries as of 2009. Currently, Reebok is seeking to expand in Europe and would like to institute strong marketing programs to sell street sneakers to the European masses. A survey of consumer preferences for sneakers is to be undertaken in three countries: Sweden, France, and Switzerland.
  34. CHAPTER 6 • DESCRIPTIVE RESEARCH DESIGN: SURVEY AND OBSERVATION 209

    By using the dominant mode of interviewing in each country, Reebok can accurately assess the preferences of Europeans for street sneakers. Real Research The Signal Is Busy for Telephone Research The Council for Marketing and Opinion Research (CMOR) (www.cmor.org) recently identified the “major threats to research vitality.” At the top of the list was telephone research due to concern over proposed legisla- tion. About half of the states have introduced bills to regulate unsolicited telephone calls and the remaining are considering similar legislation. A California law, designed to limit eavesdropping, makes it illegal to listen in on an extension, and this might limit supervisory monitoring of telephone interviewers. Another issue facing the marketing research industry is image; the general public does not distinguish between telephone research and telemarketing. This identity crisis is exacerbated by the action of some firms to commit “sugging” or “frugging,” industry terms for selling or fundraising, respectively, under the guise of a survey. All of these barriers have raised the cost of telephone research and make it difficult for researchers to obtain representative samples. Recent statistics released by CMOR confirm that the industry still faces an increasing trend in the number of people refusing to participate in surveys each year. The study surveyed 3,700 U.S. consumers, and nearly 45 percent stated they had refused to participate in a survey during the Comparability of results can best be achieved by using the dominant mode of interviewing in each country: telephone interviews in Sweden, central location/street interviews in France, and in-home personal interviews in Switzerland.50 ▪ As in the case of surveys, the selection of an appropriate observation method in international marketing research should also take into account the differences in the economic, structural, informational and technological, and sociocultural environment. Ethics in Marketing Research The use of survey research as a guise for selling (called sugging in the trade language) or fundraising (frugging) is unethical. Another ethical issue that is salient in survey and observation research is respondents’ anonymity. Researchers have an obligation to not disclose respondents’ names to outside parties, including the client. This is all the more critical if the respondents were promised anonymity in order to obtain their participation. The client is not entitled to the names of respondents. Only when respondents are notified in advance and their consent is obtained prior to administering the survey can their names be disclosed to the client. Even in such situa- tions, the researcher should have the assurance that the client will not use respondents’ names in sales efforts or misuse them in other ways. The following example highlights the battle being waged by the marketing research industry in the ethical arena.
  35. 210 PART II • RESEARCH DESIGN FORMULATION Decision Research Microsoft:

    Small Businesses Represent a Big Market The Situation Statistics from the U.S. Small Business Administration show that in 2009 small businesses generated about 50 percent of all U.S. sales and contributed 50 percent of private GDP. They also employed more than 50 percent of the U.S. workforce. Microsoft Corporation is impressed with these statistics because they indicate that small businesses may represent a big market for its products. It wonders whether the needs of small businesses are different from those of large businesses. Steve Ballmer, the CEO, would like to develop specialized prod- ucts for the small businesses. Some of these products could include a Web site just for small businesses; the Microsoft Small Business Council (which provides information to help small businesses use technology); the Microsoft Small Business Technology Partnership Board (an educational resource); the BackOffice Small Business Server; and a Small Business Edition of Microsoft Works. The Marketing Research Decision 1. If a survey is to be conducted to determine small businesses’ preferences for software products, which survey method would you recommend and why? 2. Discuss the role of the type of research you recommend in enabling Steve Ballmer to determine small businesses’ preferences for software products. The Marketing Management Decision 1. Steve Ballmer is wondering what Microsoft should do to effectively meet the needs of small businesses. What is your recommendation? 2. Discuss how the marketing management decision action that you recommend to Steve Ballmer is influenced by the type of survey that you suggested earlier and by the findings of that survey.54 ▪ Summary The two basic means of obtaining primary quantitative data in descriptive research are survey and observation. Survey involves the direct questioning of respondents; observation entails recording respondent behavior. Figure 6.4 gives a concept map for quantitative descriptive data. Surveys involve the administration of a questionnaire and may be classified, based on the method or mode of administration, as (1) traditional telephone interviews, (2) CATI, (3) in-home personal interviews, (4) mall-intercept interviews, (5) CAPI, (6) mail surveys, (7) mail panels, (8) e-mail surveys, and (9) Internet surveys. Of these methods, traditional telephone interviews and CATI are the most popular in USA. However, each method has some general advantages and disadvantages. The various methods may be last year. CMOR’s definition of a survey refusal does not include cases where consumers avoid phone calls by means of caller ID or answering machines. Such factors would actually push the true refusal rate much higher. Consumers’ concern about privacy is the number one reason survey refusal rate is so high. In addition, the widespread use of the Internet and publicized awareness of fraudulent use has made consumers more hesitant about participating in interviews. The study also reveals that only 30 percent of respondents “agree” or “strongly agree” that researchers can be trusted to protect consumers’ right to privacy. CMOR is fighting back and has hired the Washington law firm of Covington and Burling to lobby Congress and coordinate state-level lobbying. Another action under consideration is a “seal of approval” from the CMOR to raise the public’s perceptions of responsible research firms. The battle to save telephone research must be waged; all it takes is a phone call.51 ▪ Researchers should not place respondents in stressful situations. Disclaimers such as “there are no right or wrong answers; we are only interested in your opinion” can relieve much of the stress inherent in a survey. Often the behavior of people is observed without their knowledge because informing the respondents may alter their behavior.52 However, this can violate respondents’ privacy. One guide- line is that people should not be observed for research in situations where they would not expect to be observed by the public. However, observing people in public places like a mall or a grocery store is appropriate if certain procedures are followed. Notices should be posted in these areas stating that they are under observation for marketing research purposes. After the data have been collected, the researcher should obtain the necessary permission from the respondents. If any of the respon- dents refuse to grant permission, the observation records pertaining to them should be destroyed. These guidelines should also be applied when using cookies on the Internet.53
  36. CHAPTER 6 • DESCRIPTIVE RESEARCH DESIGN: SURVEY AND OBSERVATION 211

    Quantitative Descriptive Data Telephone Traditional Mail/Fax Mall Intercept In-Home Mail Panel E-Mail Internet Personal Surveys Mail Electronic Observations Personal Computer- Assisted Telephone Interviewing Computer- Assisted Personal Interviewing Mechanical Audit Content Analysis Trace Analysis obtained by major types are may be may be may be may be major types are FIGURE 6.4 A Concept Map for Quantitative Descriptive Data Key Terms and Concepts survey method, 179 structured data collection, 179 fixed-alternative questions, 179 mail panels, 186 hypertext markup language, 187 sample control, 191 sampling frame, 191 random digit dialing (RDD), 191 random digit directory designs, 191 response rate, 193 nonresponse bias, 193 critical request, 193 field force, 194 perceived anonymity, 195 social desirability, 195 incidence rate, 195 observation, 198 structured observation, 198 unstructured observation, 198 natural observation, 198 contrived observation, 198 personal observation, 199 mechanical observation, 199 psychogalvanometer, 200 galvanic skin response, 200 voice pitch analysis, 200 response latency, 200 pantry audit, 201 content analysis, 201 trace analysis, 203 mystery shopping, 206 compared in terms of task, situational, and respondent factors. Task factors relate to tasks that have to be performed to collect the data and to the topic of the survey. These fac- tors consist of diversity of questions and flexibility, use of physical stimuli, sample control, quantity of data, and response rate. The situational factors comprise control of the data-collection environment, control of field force, potential for interviewer bias, speed, and cost. The respondent factors pertain to survey respondents and include perceived anonymity, social desirability, obtaining sensitive informa- tion, low incidence rate, and respondent control. Although these data-collection methods are usually thought of as dis- tinct and competitive, they should not be considered mutu- ally exclusive. It is possible to employ them productively in combination. Observational methods may be classified as structured or unstructured, disguised or undisguised, and natural or contrived. The major methods are personal observation, mechanical obser- vation, audit, content analysis, and trace analysis. As compared to surveys, the relative advantages of observational methods are (1) they permit measurement of actual behavior, (2) there is no reporting bias, and (3) there is less potential for interviewer bias. Also, certain types of data can be obtained best, or only, by observation. The relative disadvantages of observation are (1) very little can be inferred about motives, beliefs, attitudes, and preferences; (2) there is the potential for observer bias; (3) most methods are time-consuming and expensive; (4) it is difficult to observe some forms of behavior; and (5) there is the potential for being unethical. Observation is rarely used as the sole method of obtaining primary data, but it can be usefully employed in conjunction with survey methodology. In collecting data from different countries, it is desirable to use survey methods with equivalent levels of reliability, rather than the same method. Respondents’ anonymity should be protected and their names should not be turned over to the clients. People should not be observed without their consent for research in situations where they would not expect to be observed by the public.
  37. 212 PART II • RESEARCH DESIGN FORMULATION Suggested Cases, Video

    Cases, and HBS Cases Running Case with Real Data 1.1 Dell Comprehensive Critical Thinking Cases 2.1 American Idol 2.2 Baskin-Robbins 2.3 Akron Children’s Hospital Comprehensive Cases with Real Data 4.1 JPMorgan Chase 4.2 Wendy’s Video Cases 6.1 Starbucks 8.1 P&G 10.1 Dunkin’ Donuts 11.1 Motorola 12.1 Subaru 13.1 Intel 23.1 Marriott 24.1 Nivea Live Research: Conducting a Marketing Research Project As a class, discuss the various survey methods and select one that is appropriate for the project. In addition to the criteria given in this chapter, certain practical constraints may have to be considered if the students have to collect data. Examples include the following: 1. There should be a budget for making long-distance calls if a telephone survey is to be done beyond the local calling area. 2. A CATI system may not be available, and so the telephone method may be limited to the traditional telephone. 3. Students will not be allowed to conduct mall-intercept inter- views unless permission is obtained from the mall management. Some malls have signed exclusive contracts with marketing research firms for data collection. 4. It may not be practical to do in-home personal interviews covering a large geographic area, even in the local region. 5. There may not be enough time for a mail survey and a mail panel may be prohibitively expensive. 6. E-mail addresses may not be available or may be very difficult to get. 7. Mechanical observation devices may be impractical to obtain and use. Acronyms The classification of survey methods by mode of administration may be described by the acronym Methods: M ail panels E lectronic methods: e-mail and Internet surveys T elephone interviews H ome (in-home personal) interviewing O n-site mall interviews D irect mail interviews S oftware for CATI and CAPI In using observational methods, you must WATCH the respondents’ behavior. These methods may be described by the acronym Watch: W alkie-talkie: mechanical observation A udit T race analysis C ontent analysis H uman (personal) observation Exercises Questions 1. Explain briefly how the topics covered in this chapter fit into the framework of the marketing research process. 2. What are the advantages and disadvantages of the structured- direct survey method? 3. Name the major modes for obtaining information via a survey. 4. What are the relevant factors for evaluating which survey method is best suited to a particular research project? 5. What would be the most appropriate survey method for a project in which control of field force and cost are critical factors? Comprehensive Harvard Business School Cases Case 5.1: The Harvard Graduate Student Housing Survey (9-505-059) Case 5.2: BizRate.Com (9-501-024) Case 5.3: Cola Wars Continue: Coke and Pepsi in the Twenty-First Century (9-702-442) Case 5.4: TiVo in 2002 (9-502-062) Case 5.5: Compaq Computer: Intel Inside? (9-599-061) Case 5.6: The New Beetle (9-501-023)
  38. CHAPTER 6 • DESCRIPTIVE RESEARCH DESIGN: SURVEY AND OBSERVATION 213

    Internet and Computer Exercises 1. Ask your instructor or other faculty members if you could serve as a respondent in a computer-assisted personal inter- view. Then answer the same questionnaire in a pencil and paper format. Compare the two experiences. 2. Use simple spreadsheet software, such as EXCEL, or any appropriate computer program, to conduct the content analysis described in problem 2. 3. Locate an Internet survey for which you would qualify as a respondent. Answer this survey. How would you evaluate this survey based on the criteria factors of Table 6.2? 4. Locate an Internet survey. Examine the content of the ques- tionnaire carefully. What are relative advantages and disadvan- tages of administering the same survey using CATI or mall- intercept interviewing? 5. Design an e-mail survey to measure students’ attitudes toward credit cards. E-mail the survey to 10 students. Summarize, in a qualitative way, the responses received. Are student attitudes toward credit cards positive or negative? 6. Visit the Gallup organization’s Web site at www.gallup.com. What survey methods have been used by Gallup in some of the recent surveys posted at this site? Why were these survey methods selected? Activities Role Playing 1. You work for a high-tech company and are asked to do a study of people’s responses to your advertising. Specifically, your boss wants to know which ads in a series are especially appeal- ing or interesting to consumers. Your recommendations will be used to determine the product’s copy mix. Explain how you will obtain this information. What methods will you use and why? Be specific. 2. You have been hired by the campus bookstore to determine how students make purchase decisions while shopping. You are to use the method of personal observation. Disguise yourself as a shopper and observe the behavior of other students in the bookstore. Write a report about your findings. Fieldwork 1. Visit a local marketing research firm engaged in survey research. Take a tour of their CATI facilities. Write a report describing how this firm conducts CATI. 2. Contact a marketing research firm with mall-intercept inter- viewing facilities. Arrange to visit these facilities when mall- intercept interviews are being conducted. Write a report about your experience. Group Discussion 1. As a small group, discuss the ethical issues involved in dis- guised observation. How can such issues be addressed? 2. “With advances in technology, observation methods are likely to become popular.” Discuss this statement as a small group. Dell Running Case Review the Dell case, Case 1.1, and questionnaire given toward the end of the book. 1. The Dell survey was administered by posting it on a Web site and sending an e-mail invitation to respondents. Evaluate the advantages and disadvantages of this method. Do you think that this was the most effective method? 2. Compare the various survey methods for conducting the Dell survey. 3. Can Dell make use of the observation method to determine con- sumers’ preferences for PCs and notebook computers? If yes, which observation method would you recommend and why? 4. Visit a store selling PCs and notebooks (e.g., Best Buy, Staples, etc.). If this store wants to conduct a survey to deter- mine consumer preferences for PCs and notebook computers, which survey method would you recommend and why? 6. Name the types of mechanical observation and explain how they work. 7. Explain how content analysis could be employed in the analysis of open-ended questions. Comment on the relative advantages and disadvantages of using such a method. 8. Why is trace analysis used as a means of last resort? 9. What are the relative advantages and disadvantages of observation? Problems 1. Describe a marketing research problem in which both survey and observation methods could be used for obtaining the infor- mation needed. 2. Collect 30 advertisements featuring women from recent issues of popular magazines. Do a content analysis of these ads to examine the different roles in which women are portrayed in advertising. 3. The campus food service would like to determine how many people eat in the student cafeteria. List the survey methods in which this information could be obtained. Which method is best?
  39. Cases Cases Video 214 VIDEO CASE 6.1 Starbucks: Staying Local

    While Going Global Through Marketing Research Named after the first mate in the novel Moby Dick, Starbucks is the largest coffeehouse company in the world. As of August 2007, there were 6,566 company-operated stores and 3,729 licensed stores in the United States, and 1,613 company-operated stores and 2,488 joint venture and licensed stores outside the United States. The company’s objective is to establish Starbucks as the most recognized and respected brand in the world. It expects to achieve this by continuing with rapid expansion of retail stores and growing its specialty sales and other operations. It will also continually pursue other opportunities to leverage the Starbucks brand through new products and new distribution channels that meet consumer needs determined by market- ing research. Over the last two decades, Starbucks has revitalized the coffee industry. The inspiration behind Starbucks was con- ceived when CEO Howard Schultz visited Italy. At that time, Starbucks was a coffee company, and people were very passionate about the coffee, but in Milan Howard saw the passion around the coffeehouse experience. In Milan, Howard went from one espresso bar to the next and saw how people at the coffeehouses knew each other. These people were getting their daily coffees, but they also were making daily connections with other people, with the baris- tas, and with the artistry; the folks making the drinks were connecting with their customers and knew them personally. From this experience, Howard recognized that although Starbucks was passionate about the coffee, it also had the opportunity to be equally passionate about the coffeehouse experience. Marketing research determined four strategic pillars for expressing the Starbucks brand. The four pillars are (1) the coffee, which is Starbucks’ foundation and which gives Starbucks its credibility; (2) some of the finest products that are associated with the coffee experience; (3) the warm, welcoming, and inspiring environment; and (4) community involvement. Even though the coffee and the products are important, the key to Starbucks’ success has been the latter two. It has designed an environment that is warm and welcoming and provides an experi- ence that makes the company a part of the community or local culture. It has been able to achieve this success by emphasizing the Starbucks culture. Starbucks also draws upon customers for ideas by conducting extensive marketing research. Many of its products and services are a direct result of suggestions from patrons or local employees. Much more than most companies, consumers touch and influence the corpora- tion. Many innovations and retail items resulted directly from customers’ feedback obtained by conducting market- ing research and by suggestions made to the baristas. From customized CD music collections to sales of sandwiches, gums, and chocolates—all were a result of customer recommendations. Many stores even offer wireless Internet access in response to customer demand. Through its baristas, Starbucks found that people were interested in an iced Starbucks and the blended Starbucks, and thus the Frappuccino was born—an idea that came from customers and the baristas rather than corporate headquarters. This local connection with customers and the consequent brand building have allowed Starbucks to move into other successful venues—from coffee bean sales at grocery stores to partnerships with United Airlines, Marriott, Pepsi, Kraft, and others. Starbucks has some of the best coffee in the world, but it was missing from grocery stores, which is where most coffee is purchased. Syndicated data from Nielsen showed that grocery stores sell two-thirds of the coffee in the United States, and Starbucks has been able to enter this lucra- tive market. It has also used partnerships in other industries to increase revenues. In the past few years, Starbucks has been aggressively expanding its global footprint by entering newer markets and strengthening its position in countries it already has a pres- ence. Growing a brand overseas, however, can be different from doing so in Starbucks’ home market. According to Thomas Yang, former senior vice president of International Marketing, this difference in different growth behavior in different countries can be attributed to Starbucks’ different
  40. CHAPTER 6 • DESCRIPTIVE RESEARCH DESIGN: SURVEY AND OBSERVATION 215

    stages of development in the United States and different parts of the world. In international markets, Starbucks is at the brand development and establishment stage, allowing con- sumers to discover what the brand is about and what the Starbucks experience is about. In contrast, Starbucks has had a presence in North America since 1971. In the United States, the Starbucks experience is pretty well-known and understood, and thus it is in a different stage. Starbucks has been extremely successful in achieving its objectives. It has been able to maintain a local feel despite massive growth around the globe. It has done this by stress- ing its culture and placing the focus on its employees and customers through marketing research. Starbucks hopes to continue staying local while going global through marketing research. Conclusion Starbucks has gone from a small local coffee start-up in the 1970s to the largest coffeehouse company in the world. This success has largely been due to the strong connection it has been able to foster with its consumers and maintain a local charm and feel in its stores even as it continues to expand globally at breakneck speed. This strong connection has also enabled Starbucks to gather useful feedback and marketing research information from customers leading to the introduction of several successful new products and penetration into new global markets. Questions 1. Use the Internet to identify secondary sources of information pertaining to coffee consumption in the United States. 2. What are consumers looking for in a coffeehouse experience? How do they view the Starbucks coffeehouse experience? How can Starbucks determine answers to these questions? 3. A survey is to be conducted to determine the image coffee drinkers have of Starbucks and other coffee chains. Which survey method should be used and why? 4. Starbucks is thinking of introducing a new gourmet coffee with a strong aroma. Can the observation method be used to determine the consumer reaction to this coffee prior to national introduction? If so, which observation method should be used? References 1. www.starbucks.com, accessed February 15, 2009. 2. Steven Gray and Kate Kelly, “Starbucks Plans to Make Debut in Movie Business,” Wall Street Journal (January 12, 2006): A1, A8. 3. Bob Keefe, “Starbucks to Offer CD-Burning Capabilities at Stores in Future,” Knight Ridder Tribune Business News (June 28, 2004): 1.