Upgrade to Pro — share decks privately, control downloads, hide ads and more …

Malhotra (2016) MR_Chapter04

k.projeto
March 24, 2021

Malhotra (2016) MR_Chapter04

Malhotra (2016) MR_Chapter04

k.projeto

March 24, 2021
Tweet

More Decks by k.projeto

Other Decks in Research

Transcript

  1. 4 4 98 Chapter “ ” Objectives [After reading this

    chapter, the student should be able to: ] 1. Define the nature and scope of secondary data and distinguish secondary data from primary data. 2. Analyze the advantages and disadvantages of secondary data and their uses in the various steps of the marketing research process. 3. Evaluate secondary data using specifications, error, currency, objectives, nature, and dependability criteria. 4. Describe in detail the different sources of secondary data, including internal sources and external sources in the form of published materials, computer- ized databases, and syndicated services. 5. Discuss in detail the syndicated sources of secondary data, including household/ consumer data obtained via surveys, purchase and media panels, and electronic scanner services, as well as institutional data related to retailers, wholesalers, and industrial/service firms. 6. Explain the need to use multiple sources of secondary data and describe single-source data. 7. Discuss applications of secondary data in computer mapping. 8. Identify and evaluate the sources of secondary data useful in international marketing research. 9. Understand the ethical issues involved in the use of secondary data. Secondary data analysis of reputable studies is a cost-effective way to provide useful con- text, dimensionality, and insight into the formulation or exploration of a research problem. Robert L. Cohen, Ph.D., President and CEO, Scarborough Research
  2. Exploratory Research Design: Secondary Data Overview 99 Chapter 1 discussed

    the Internet as a source of marketing research information. Analysis of secondary data helps define the marketing research problem and develop an approach (Chapter 2). Also, before the research design for collecting primary data is formulated (Chapter 3), the researcher should analyze the relevant secondary data. In some projects, particularly those with limited budgets, research may be largely confined to the analysis of secondary data, since some routine problems may be addressed based only on secondary data. This chapter discusses the distinction between primary and secondary data. The advantages and disadvantages of secondary data are considered and criteria for evaluating secondary data are presented, along with a classification of secondary data. Internal secon- dary data are described and major sources of external secondary data, such as published materials, online and offline databases, and syndicated services, are also discussed. We consider applications of secondary data in computer mapping. The sources of secondary data useful in international marketing research are discussed. Several ethical issues that arise in the use of secondary data are identified. Finally, we discuss the use of the Internet and computers in identifying and analyzing secondary data.1 We begin by citing several examples to give you a flavor of secondary data. Real Research Boston Market: Some Place Like Home According to secondary data, home meal replacement (HMR) will be the family dining business of the twenty-first century. HMR is portable, high-quality food that’s meant for takeout, and it is the fastest- growing and most significant opportunity in the food industry today. According to Nielsen’s consumer panel data (www.nielsen.com), 55 percent of respondents purchased a meal for at-home consumption several times a month. Convenience and type of food were the two most influential factors when purchasing HMR. Also, 77 percent of the respondents preferred their meals ready to eat. Secondary data indicating huge demand for home meal replacement spurred Boston Market to become the leader in this segment.
  3. 100 PART II • RESEARCH DESIGN FORMULATION Real Research High

    Touch Goes High Tech According to the U.S. Department of Labor, more than 50 percent of the American workforce was over 40 years old by 2005. By 2015, women will account for about 50 percent of the workforce. There will also be a decline in the number of young (age 16–24) workers available to fill entry-level positions. This poten- tial shortage of young workers has caused many fast-food restaurants to switch from a “high touch” to a “high tech” service orientation. Many of the services formerly rendered by workers are now performed by consumers by using high-tech equipment. The use of touch screen kiosks is becoming a popular trend that provides a new avenue to cut labor costs and increase customer service. Fast-food companies that are deploying this new technology include Taco Bell, Arby’s, and Pizza Hut.3 ▪ As these examples illustrate, research and consulting firms (Nielsen, McKinsey & Co.) and govern- ment departments (U.S. Department of Labor) are only a few of the sources from which secondary data may be obtained. The nature and role of secondary data become clear when we understand the distinction between primary and secondary data. Primary Versus Secondary Data Primary data are originated by a researcher for the specific purpose of addressing the problem at hand. The collection of primary data involves all six steps of the marketing research process (Chapter 1). Obtaining primary data can be expensive and time consuming. The department store patronage project cited in Chapter 1 is an example of primary data collection. Secondary data are data that have already been collected for purposes other than the problem at hand. These data can be located quickly and inexpensively. In the department store patronage project, secondary data on the criteria used by households to select department stores were obtained from marketing journals (Journal of Retailing, Journal of Marketing, Journal of the Academy of Marketing Science, and Journal of Marketing Research). Several other examples of secondary data were provided in the preceding section. The differences between primary and secondary data are summarized in Table 4.1. As compared to primary data, secondary data are collected rapidly and easily, at a relatively low cost, and in a short time. These differences between primary and secondary data lead to some distinct advantages and uses of secondary data. primary data Data originated by the researcher for the specific purpose of addressing the research problem. secondary data Data collected for some purpose other than the problem at hand. TABLE 4.1 A Comparison of Primary and Secondary Data Primary Data Secondary Data Collection purpose For the problem at hand For other problems Collection process Very involved Rapid and easy Collection cost High Relatively low Collection time Long Short Another recent study by consultants McKinsey & Co. (www.mckinsey.com) projects that virtually all growth in food sales will come from food service, defined as food prepared at least partially away from home. Estimates of total HMR market size, as well as future potential, vary widely. Numbers ranging from $25 billion to $100 billion have been given for the year 2010. It is the most important trend to hit the food industry since the advent of frozen food. Most industry experts say the trend started when Boston Market (www.bostonmarket.com) came to town, attracting consumers with promises of food just like mom used to make. Boston Market is now the HMR leader. The company constantly monitors HMR-related data available from secondary sources and uses them as inputs into its research and marketing programs. Currently, Boston Market is using such data to test new products that could be introduced in 2010. Such product tests being conducted include prepack- aged “take and go” lunch boxes, expanded catering services, enhanced drive-through operations, call-ahead pick-up services, and signature meals.2 ▪
  4. CHAPTER 4 • EXPLORATORY RESEARCH DESIGN: SECONDARY DATA 101 Advantages

    and Uses of Secondary Data As can be seen from the foregoing discussion, secondary data offer several advantages over primary data. Secondary data are easily accessible, relatively inexpensive, and quickly obtained. Some secondary data, such as those provided by the U.S. Bureau of the Census, are available on topics for which it would not be feasible for a firm to collect primary data. Although it is rare for secondary data to provide all the answers to a nonroutine research problem, such data can be useful in a variety of ways.4 Secondary data can help you: 1. Identify the problem. 2. Better define the problem. 3. Develop an approach to the problem. 4. Formulate an appropriate research design (for example, by identifying the key variables). 5. Answer certain research questions and test some hypotheses. 6. Interpret primary data more insightfully. Given these advantages and uses of secondary data, we state the following general rule: Examination of available secondary data is a prerequisite to the collection of primary data. Start with secondary data. Proceed to primary data only when the secondary data sources have been exhausted or yield marginal returns. The rich dividends obtained by following this rule are illustrated by examples we have given in the introduction to this chapter. These examples show that analysis of secondary data can provide valuable insights and lay the foundation for conducting primary data analysis. However, the researcher should be cautious in using secondary data, because they have some limitations and disadvantages. Disadvantages of Secondary Data Because secondary data have been collected for purposes other than the problem at hand, their usefulness to the current problem may be limited in several important ways, including relevance and accuracy. The objectives, nature, and methods used to collect the secondary data may not be appropriate to the present situation. Also, secondary data may be lacking in accu- racy, or they may not be completely current or dependable. Before using secondary data, it is important to evaluate them on these factors. These factors are discussed in more detail in the following section. ACTIVE RESEARCH Nike: Celebrating Celebrity Endorsements Search the Internet using a search engine as well as your library’s online databases to obtain information on the use of celebrity endorsements in marketing. You are conducting a marketing research project to determine the effectiveness of celebrity endorsements in Nike advertising. What type of secondary data would you examine? As the marketing director of Nike, how would you use secondary data on celebrity endorsements to determine whether you should continue to contract celebrities to endorse the Nike brand? Criteria for Evaluating Secondary Data The quality of secondary data should be routinely evaluated, using the criteria of Table 4.2, which are discussed in the following sections. Specifications: Methodology Used to Collect the Data The specifications or the methodology used to collect the data should be critically examined to identify possible sources of bias. Such methodological considerations include size and nature of the sample, response rate and quality, questionnaire design and administration, procedures used
  5. 102 PART II • RESEARCH DESIGN FORMULATION TABLE 4.2 Criteria

    for Evaluating Secondary Data Criteria Issues Remarks Specifications/ Methodology Data collection method Response rate Data should be reliable, valid, and generalizable to the problem at hand. Quality of data Sampling technique Sample size Questionnaire design Fieldwork Data analysis Error/Accuracy Examine errors in: approach, research design, sampling, data collection, data analysis, reporting Assess accuracy by comparing data from different sources. Currency Time lag between collection and publication Frequency of updates Census data are periodically updated by syndicated firms. Objective Why were the data collected? The objective will determine the relevance of the data. Nature Definition of key variables Units of measurement Reconfigure the data to increase their usefulness, if possible. Categories used Relationships examined Dependability Expertise, credibility, reputation, and trustworthiness of the source Data should be obtained from an original rather than an acquired source. for fieldwork, and data analysis and reporting procedures. These checks provide information on the reliability and validity of the data and help determine whether they can be generalized to the problem at hand. The reliability and validity can be further ascertained by an examination of the error, currency, objectives, nature, and dependability associated with the secondary data. Real Research Rating the Television Ratings Methodology WTVJ-TV, an NBC affiliate in Miami, uses the syndicated services of Nielsen Media Research (www.nielsenmedia.com), which provides television ratings and audience estimates. The television station feels that the data provided by Nielsen Media Research have been skewed because the methodology used was flawed. Specifically, they claim that Nielsen Media Research is putting too many meters into the homes of families who speak only Spanish, which is underestimating their ratings. The problem is that the station is English speaking, and while 46 percent of its viewers are Hispanic, they all speak English. By placing more Nielsen meters in homes that do not speak English, the information is not representative of the Miami community or the station’s viewers. Also, since many decisions are based on the information provided by Nielsen, such as programming, advertising, and media buys, it is important that the station have accurate and reliable information about the market. Just the reverse has been argued in other areas. On July 8, 2004, the company introduced Nielsen’s local people meters (LPMs) in Los Angeles. The LPM rating system was gradually installed in other major markets and went live in Cleveland on August 28, 2008. The meters electronically record what programs are being watched—and who is watching them. Some networks and a coalition of community groups, called Don’t Count Us Out, complained that the Nielsen sample audience underrepresents Latinos and African Americans, producing faulty results. Although many support the actions of Nielsen Media Research and feel that the data do represent the com- munity, the complaint still raises a very important question: Can a company be confident that the information it receives is generated using appropriate methodology?5 ▪
  6. CHAPTER 4 • EXPLORATORY RESEARCH DESIGN: SECONDARY DATA 103 Error:

    Accuracy of the Data The researcher must determine whether the data are accurate enough for the purposes of the current study. Secondary data can have a number of sources of error, or inaccuracy, including errors in the approach, research design, sampling, data collection, analysis, and reporting stages of the project. Moreover, it is difficult to evaluate the accuracy of secondary data, because the researcher did not participate in the research. One approach is to find multiple sources of data and compare those using standard statistical procedures. The accuracy of secondary data can vary, particularly if they relate to phenomena that are subject to change. Moreover, data obtained from different sources may not agree. In these cases, the researcher should verify the accuracy of secondary data by conducting pilot studies or by other appropriate methods. Often, by exercising creativity, this can be done without much expense or effort. Real Research Detailing E-Tailing Revenues In order to determine e-commerce sales, many research firms such as Forrester Research, ComScore, Nielsen Online, and the U.S. Commerce Department conduct studies. All four organizations have distinct methodologies of collecting and analyzing data to report results. The Forrester Research firm polls 5,000 online consumers every month during the first nine working days of each month. Responses from those polled consumers are adjusted to represent the U.S. population. Differing from Forrester Research, Nielsen Online’s EcommercePulse polls a larger sample of 36,000 Internet users monthly and tracks how much money those consumers spend online. Differing once again is the U.S. Commerce Department, which randomly chooses 11,000 merchants to fill out survey forms about online sales. Finally, ComScore uses a passive response system that collects data from 1.5 million Internet users, allowing ComScore to track their Internet traffic through the company’s servers. For the calendar year 2007, Forester Research reported $175 billion in online sales, the Commerce Department reported $127 billion, and ComScore reported $122.8 billion. Unlike Forrester, the Commerce Department and ComScore exclude sales of travel services, event tickets, and auctions. Such huge differences in online sales create problems for e-commerce companies, and even Federal Reserve Chairman Ben Bernanke has addressed this issue as a major problem. Comparing e-tail sales figures available from different sources can give marketing researchers an idea of the degree of error that may be present in the data. According to a study by Forrester Research, the e-commerce transactions are expected to reach $335 billion annually by 2012. The forecasts from the other sources vary considerably with Commerce Department forecasting e-commerce sales of only 218.4 billion by 2012.6 ▪ Currency: When the Data Were Collected Secondary data may not be current, and the time lag between data collection and publication may be long, as is the case with much census data. Moreover, the data may not be updated frequently enough for the purpose of the problem at hand. Marketing research requires current data; there- fore, the value of secondary data is diminished as they become dated. For instance, while the 2000 Census of Population data are comprehensive, they may not be applicable to a metropolitan area whose population has changed rapidly since the census. Fortunately, several marketing research firms update census data periodically and make the current information available on a syndicated basis. Objective: The Purpose for Which the Data Were Collected Data are invariably collected with some objective in mind, and a fundamental question to ask is why the data were collected in the first place. The objective for collecting data will ultimately determine the purpose for which that information is relevant and useful. Data collected with a specific objective in mind may not be appropriate in another situation. As explained in more detail later in the chapter, scanner volume tracking data are collected with the objective of examining aggregate movement of brands, including shifts in market shares. Such data on sales of orange juice, for example, would be of limited value in a study aimed at understanding how households select specific brands.
  7. 104 PART II • RESEARCH DESIGN FORMULATION Nature: The Content

    of the Data The nature, or content, of the data should be examined with special attention to the definition of key variables, the units of measurement, categories used, and the relationships examined. If the key variables have not been defined or are defined in a manner inconsistent with the researcher’s definition, then the usefulness of the data is limited. Consider, for example, secondary data on consumer preferences for TV programs. To use this information, it is important to know how preference for programs was defined. Was it defined in terms of the program watched most often, the one considered most needed, most enjoyable, most informative, or the program of greatest service to the community? Likewise, secondary data may be measured in units that may not be appropriate for the current problem. For example, income may be measured by individual, family, household, or spending unit, and could be gross or net after taxes and deductions. Income may be classified into categories that are different from research needs. If the researcher is interested in high-income consumers with gross annual household incomes of over $90,000, secondary data with income categories of less than $15,000, $15,001–$35,000, $35,001–$50,000, and more than $50,000 will not be of much use. Determining the measurement of variables such as income may be a complex task. Finally, the relationships examined should be taken into account in evaluating the nature of data. If, for example, actual behavior is of interest, then data inferring behavior from self-reported attitudinal information may have limited usefulness. Sometimes it is possible to reconfigure the available data, for example, to convert the units of measurement, so that the resulting data are more useful to the problem at hand. Dependability: How Dependable Are the Data? An overall indication of the dependability of data may be obtained by examining the expertise, credibility, reputation, and trustworthiness of the source. This information can be obtained by checking with others who have used the information provided by the source. Data published to promote sales, to advance specific interests, or to carry on propaganda should be viewed with suspicion. The same may be said of data published anonymously or in a form that attempts to hide the details of the data collection methodology and process. It is also pertinent to examine whether the secondary data came from an original source, one that generated the data, or an acquired source, one that procured the data from an original source. For example, the Census of Population is an original source, whereas the Statistical Abstracts of the United States is an acquired source. As a general rule, secondary data should be secured from an original, rather than an acquired source. There are at least two reasons for this rule. First, an original source is the one that specifies the details of the data collection methodology. Second, an original source is likely to be more accurate and complete than a secondary source. Real Research Flying High on Secondary Data Money magazine published the results of a study conducted to uncover the airline characteristics consumers consider most important. In order of importance, these characteristics are safety, price, baggage handling, on-time performance, customer service, ease of reservations and ticketing, comfort, frequent flyer programs, and food. Money magazine then ranked the 10 largest U.S. airlines according to these characteristics. This article would be a useful source of secondary data for American Airlines in conducting a market research study to identify characteristics of its service that should be improved. However, before using the data, American should evaluate them according to several criteria. First, the methodology used to collect the data for this article should be examined. This Money magazine article includes a section that details the methodology used in the study. Money used a poll of 1,017 frequent fliers to determine important airline characteristics. The results of the survey had a 3 percent margin of error. American would need to decide whether a sample size of 1,017 was generalizable to the population, and whether an error of 3 percent is acceptable. In addition, American should evaluate what type of response or nonresponse errors might have occurred in the data collection or analysis process. The currency of the data and the objective of the study would be important to American Airlines in decid- ing whether to utilize this article as a source of secondary data. This study was conducted before the merger of Delta and Northwest, which was announced in 2008. Perhaps airline passengers’ criteria have changed since these events, which would diminish the usefulness of this study. The objective of the study was to rate airlines
  8. CHAPTER 4 • EXPLORATORY RESEARCH DESIGN: SECONDARY DATA 105 along

    choice criteria for a popular business magazine. The results are not likely to be biased toward any partic- ular airline, because the magazine does not have a vested interest in any of the airline companies. American would also need to look at the nature and dependability of the data. For instance, it would need to look at how the nine choice criteria are defined. For example, price is measured in terms of fare per mile. This may not be useful to American if it did not want to quantify price in that manner. In regard to dependability, American would need to research the reputation of Money magazine and of ICR, the com- pany Money hired to administer the survey. American also needs to consider the fact that Money used some secondary research in its study. For instance, it used reports from the National Transportation Safety Board data on airline accidents and incident reports from the Federal Aviation Administration to rank the safety performance of the 10 airlines. It is always better to get information from the original source. Thus, American might want to acquire these reports and do its own safety ranking. This would be more reliable than getting this information from the Money magazine report. The Money magazine article might be useful as a starting place for the marketing research project by American Airlines. For instance, it might be useful in formulating the problem definition. However, because of the article’s limitations in regard to currency, nature, and dependability, this source should be supplemented by other sources of secondary research, as well as primary research.7 ▪ ACTIVE RESEARCH Gallup Polls: On a Gallup Visit www.gallup.com. Examine the information on how Gallup polls are conducted. As the CEO of Home Depot, you come across a Gallup poll that states that more and more women are shopping for home improvement products and services. How will you use this information to improve the competitiveness of Home Depot? By applying the criteria we have considered, evaluate the quality of Gallup polls. Classification of Secondary Data Figure 4.1 presents a classification of secondary data. Secondary data may be classified as either internal or external. Internal data are those generated within the organization for which the research is being conducted. This information may be available in a ready-to use-format, such as information routinely supplied by the management decision support system. On the other hand, these data may exist within the organization but may require considerable processing before they are useful to the researcher. For example, a variety of information can be found on sales invoices. Yet this information may not be easily accessible; further processing may be required to extract it. External data are those generated by sources outside the organization. These data may exist in the form of published material, computerized databases, or information made available by syndicated services. Before collecting external secondary data, it is useful to analyze internal secondary data. internal data Internal data are data available within the organization for which the research is being conducted. external data Data that originate external to the organization. Computerized Databases Syndicated Services Published Materials Requires Further Processing Ready to Use Secondary Data Internal External FIGURE 4.1 A Classification of Secondary Data
  9. 106 PART II • RESEARCH DESIGN FORMULATION database marketing Database

    marketing involves the use of computers to capture and track customer profiles and purchase detail. Internal Secondary Data Internal sources should be the starting point in the search for secondary data. Since most organi- zations have a wealth of in-house information, some data may be readily available and may provide useful insights. For example, sales and cost data are compiled in the regular accounting process. When internal data on sales showed Reebok (www.reebok.com) that Internet sales were a mere 0.7 percent of their total sales but were rousing bad feelings among retailers, the company dis- continued online selling. It is also possible to process routinely collected sales data to generate a variety of useful information, as illustrated by the department store example. Project Research Internal Secondary Data Extensive analysis was conducted on internal secondary data in the department store patronage project. This provided several rich insights. For example, sales were analyzed to obtain: ᭹ Sales by product line ᭹ Sales by major department (e.g., menswear, housewares) ᭹ Sales by specific stores ᭹ Sales by geographical region ᭹ Sales by cash versus credit purchases ᭹ Sales in specific time periods ᭹ Sales by size of purchase ᭹ Sales trends in many of these classifications ▪ Secondary internal data have two significant advantages. They are easily available and inexpen- sive. In fact, internal secondary sources are generally the least costly of any source of marketing research information, yet these data often are not fully exploited. However, this trend is changing with the increased popularity of database marketing. Database Marketing Database marketing involves the use of computers to capture and track customer profiles and purchase detail. This secondary information serves as the foundation for marketing programs or as an internal source of information related to customer behavior. For many companies, the first step in creating a database is to transfer raw sales information, such as that found on sales call reports or on invoices, to a microcomputer. This consumer purchase information is then enhanced by overlaying it with demographic and psychographic information for the same customers, available from syndicated firms such as Donnelley Marketing (www.donnelleymarketing.com) and Experian (www.experian.com). This information can then be analyzed in terms of a customer’s activity over the life of the business relationship. A profile of heavy versus low users, signs of change in the usage relationships, or significant “customer life cycle” events such as anniversaries can be identified and acted upon. These databases provide the essential tool needed to nurture, expand, and protect the customer relationship.8 Real Research Type of Individual/Household Level Data Available from Syndicated Firms I. Demographic Data ᭹ Identification (name, address, telephone) ᭹ Sex ᭹ Marital status ᭹ Names of family members ᭹ Age (including ages of family members) ᭹ Income ᭹ Occupation ᭹ Number of children present
  10. CHAPTER 4 • EXPLORATORY RESEARCH DESIGN: SECONDARY DATA 107 ᭹

    Home ownership ᭹ Length of residence ᭹ Number and make of cars owned II. Psychographic Lifestyle Data ᭹ Interest in golf ᭹ Interest in snow skiing ᭹ Interest in book reading ᭹ Interest in running ᭹ Interest in bicycling ᭹ Interest in pets ᭹ Interest in fishing ᭹ Interest in electronics ᭹ Interest in cable television There are also firms such as D&B (www.dnb.com) and American Business Information, a division of InfoUSA (www.infousa.com), that collect demographic data on businesses. ▪ CRM (customer relationship management) is a unique type of database-driven marketing. As part of its CRM system, Chrysler (www.chrysler.com) implemented what they call Personal Information Centers. These PICs, as they are called, offer car owners an individualized Web site that creates direct links with the marketing research team. These PICs collect data on all aspects of buying a car, giving the company the ability to engage in customized marketing. If a prospect, on his or her completed online survey, indicated handling of minivans to be a con- cern, separate data could be included on a brochure sent only to that prospect. These data would show how the Chrysler minivan stood up against the competition in the minivan market. Chrysler believes that the customer relationship begins when a prospect first contacts the com- pany and doesn’t stop when a buyer purchases a vehicle. With this in mind, the company uses its CRM system to constantly track buyers’ and prospects’ opinions and desires. Its CRM has enabled the company to maintain its leadership in the automobile market. In 2007, private equity concern Cerberus Capital Management bought Chrysler for about $7.4 billion—or about one-fifth of the $37 billion Daimler paid in 1998.9 Database marketing can lead to quite sophisticated and targeted marketing programs, as illustrated in the following example. Real Research Caterpillar: The Pillar of Database Marketing Besides their famous earthmoving equipment, Caterpillar builds $2 billion per year of large truck engines, the kind that are found everywhere in the big 18-wheelers on the road. These trucks are always custom built by the truck manufacturers, who are really assemblers, such as Peterbilt. In the beginning, Caterpillar had no database, and their executives had a lot of questions: “What truck fleets are we not calling on? What fleets should test our two new engines? How can we get a marketing strategy that can be measured? How do we adjust to the coming downturn in sales?” To try to answer these questions, Alan Weber and Frank Weyforth, two database marketing veterans, got Caterpillar truck marketing to chip in money for a project. They used part of the money to give laptops to the 260 Caterpillar sales force with this provision: “You get paid for sales, but only if the customer name and other data are entered into the laptop database.” It worked. When they began, they had data on only 58,000 customers and 11,000 fleets of 10 trucks or more. There were four internal databases in Caterpillar that were not compatible with one another. To get the data, the team combined the internal databases, appended data from the National Motor Carriers directory, D&B and TRW data, and trade publication lists. After two years of work, they had a file of 110,000 customers, 8,000 mid-range fleets, and 34,000 heavy-duty fleets: the universe of all heavy trucks in America. Next they did some serious modeling. Using the data they assembled on SIC code, truck owner vocations, engine mod- els, number of trucks, and trucking category, they were able to predict which noncustomers were most likely to buy. They grouped their customers and prospects into 83 heavy-duty groups and 34 mid-range groups. With the data available, they estimated customer lifetime value. Sales, service, usage, and engine model combined determined that value for customers. Prospect value was determined by the group to which each prospect had been assigned. They determined, from this analysis, the high-value customers and prospects that should be targeted.
  11. 108 PART II • RESEARCH DESIGN FORMULATION General Business Sources

    Government Sources Guides Directories Indexes Statistical Data Census Data Other Government Publications Published Secondary Data FIGURE 4.2 A Classification of Published Secondary Sources Weber and Weyforth developed a set of different messages that could be sent to each customer and prospect. Messages that stressed retention were different from messages that were designed for conquest. During the first year with the new database, they were able to sign up 500 conquest fleets. They sold an average of 50 to 100 engines per fleet at about $15,000 per engine. The total increased sales that could be attributed to the new database system were approximately $500 million. They successfully launched the two new engines that had been part of the original goal. Caterpillar market share went up by 5 percent and continued to grow through 2009.10 ▪ Most large organizations have intranets, which greatly facilitate the search for and access to internal secondary data. The Procter & Gamble Company, for example, has developed powerful intranet applications that enable its managers worldwide to search for past and current research studies and a wide variety of marketing-related information on the basis of keywords. Once located, the information can be accessed online. Sensitive information can be secured electroni- cally with user names and passwords. Published External Secondary Sources Sources of published external secondary data include federal, state, and local governments, nonprofit organizations (e.g., Chambers of Commerce), trade associations and professional organizations, commercial publishers, investment brokerage firms, and professional marketing research firms. In fact, so much data are available that the researcher can be overwhelmed. Therefore, it is important to classify published sources. (See Figure 4.2.) Published external sources may be broadly classified as general business data or government data. General busi- ness sources are comprised of guides, directories, indexes, and statistical data. Government sources may be broadly categorized as census data and other publications. General Business Data Businesses publish a lot of information in the form of books, periodicals, journals, newspapers, magazines, reports, and trade literature. Moody’s (www.moodys.com) and Standard and Poor’s (www.standardandpoors.com) provide information on U.S. and foreign companies. Another useful source for industrial brand and trade information is ThomasNet (www.thomasnet.com). Valuable marketing and marketing research information may be obtained from www.SecondaryData.com. A variety of business-related sites can provide sales leads, mailing lists, business profiles, and credit ratings for American businesses. Many sites supply information on businesses within a specific industry. For example, you can gain access to the full-text American Demographics and Marketing Tools publications at www.marketingtools.com. All of American Marketing Association’s publi- cations can be searched by using keywords at www.marketingpower.com. Encyclopedia Britannica provides free online access to the entire 32 volumes (www.britannica.com). Data on American manu- facturers and key decision makers can be obtained from Harris InfoSource (www.harrisinfo.com). Another good source is USAData.com. Guides, indexes, and directories can help in locating informa- tion available from general business sources. Sources are also available for identifying statistical data. A brief description of each of these resource categories follows.
  12. CHAPTER 4 • EXPLORATORY RESEARCH DESIGN: SECONDARY DATA 109 GUIDES

    Guides are an excellent source of standard or recurring information. A guide may help identify other important sources of directories, trade associations, and trade publications. Guides are one of the first sources a researcher should consult. Some of the most useful are the American Marketing Association Bibliography Series, Business Information Sources, Data Sources for Business and Market Analysis, and Encyclopedia of Business Information Sources. You can find guides on the Internet. @BRINT (www.brint.com) is a guide to business technology management and knowledge management sites with editorial comments. DIRECTORIES Directories are helpful for identifying individuals or organizations that collect specific data. Some of the important directories include Directories in Print, Consultants and Consulting Organizations Directory, Encyclopedia of Associations, FINDEX: The Directory of Market Research Reports, Fortune 500 Directory, Million Dollar Directory: Leading Public and Private Companies, Standard Directory of Advertisers, and Thomas Register of American Manufacturers. You can also find directories on the Internet, for example the Google directory at www.google.com/dirhp and the Yahoo! directory at dir.yahoo.com. INDEXES It is possible to locate information on a particular topic in several different publications by using an index. Indexes can, therefore, increase the efficiency of the search process. You can also find indexes on the Internet, for example the Librarian’s Internet Index at www.lii.org. CI Resource Index (www.ciseek.com) contains sites for competitive intelligence information. Several were used in the department store project. Project Research Data Search In addition to reviewing the theoretical literature, as discussed in Chapter 2, it was also necessary to identify the nonacademic sources of secondary data related to the factors considered in selecting department stores and other aspects of store patronage. The Business Periodical Index, the Wall Street Journal Index, and the New York Times Index were used to generate a list of relevant articles that had appeared in the last five years. The Business Periodical Index classifies articles by specific industries and firms, making it easy to locate articles of interest. Several articles obtained in this manner proved useful. One pointed to the tendency of people to combine shopping with eating out. Therefore, as discussed in Chapter 2, a specific research question was framed to investigate this behavior. Project Activities Identify the sources of secondary data that will help Sears do the following: 1. Increase penetration of the Hispanic population. 2. Project domestic retail sales growth to the year 2015. 3. Identify the impact of lifestyle changes on department store sales. 4. Evaluate the effectiveness of Sears’ advertising. ▪ As illustrated by this example, indexes greatly facilitate a directed search of the relevant litera- ture. Several indexes are available for both academic and business sources. Some of the more useful business indexes are Business Periodical Index, Business Index, Predicasts F & S Index: United States, Social Sciences Citation Index, and the Wall Street Journal Index. American business information can be obtained by visiting various business-related sites that provide sales leads and mailing lists, business profiles, and credit ratings. You can find reports on different industries at research firms’ sites, such as www.jupiterresearch.com, www.forrester.com, www.idc.com, and www.greenfield.com, to name a few. However, other general publications also publish research results, such as www.wsj.com, www.businessweek.com, www.business20.com, and www.nytimes.com. NONGOVERNMENTAL STATISTICAL DATA Business research often involves compiling statistical data reflecting market or industry factors. A historic perspective of industry participation and growth rates can provide a context for market share analysis. Market statistics related to population demographics, purchasing levels, television viewership, and product usage are just some of the types of nongovernmental statistics available from secondary sources. Important sources of nongovernmental statistical data include A Guide to Consumer Markets, Predicasts
  13. 110 PART II • RESEARCH DESIGN FORMULATION Basebook, Predicasts Forecasts,

    Sales and Marketing Management Survey of Buying Power, Standard & Poor’s Statistical Service, and Standard Rate and Data Service. Government Sources The U.S. government also produces large amounts of secondary data. Its publications may be divided into census data and other publications.11 CENSUS DATA The U.S. Bureau of the Census is the world’s largest source of statistical data. Its monthly catalog lists and describes its various publications.12 More convenient, however, is the Guide to Economic Census. Census data are useful in a variety of marketing research projects. The demographic data collected by the Census Bureau includes information about household types, sex, age, marital status, and race. Consumption detail related to automobile ownership, housing characteristics, work status, and practices as well as occupations are just a few of the categories of information available. What makes this demographic information particularly valuable to marketers is that these data can be geographically categorized at various levels of detail. These data can be summarized at various levels: city block, block group, census tract, metropolitan statistical area (MSA), consolidated metropolitan statistical area (CMSA), region (Northeast, Midwest, South, and West), or they can be aggregated for the nation as a whole. Census tracts have a population of more than 4,000 and are defined by local communities. In urban areas, the MSAs have a population of at least 50,000 and comprise counties containing a central city. In addition, census data are available by civil divisions, such as wards, cities, counties, and states. The quality of census data is high and the data are often extremely detailed. Furthermore, one can purchase computer tapes or diskettes from the Bureau of the Census for a nominal fee and recast this information in a desired format.13 Many private sources update the census data at a detailed geographic level for the between-census years.14 Important census data include Census of Housing, Census of Manufacturers, Census of Population, Census of Retail Trade, Census of Service Industries, and Census of Wholesale Trade. Real Research The Changing Color of the American Marketplace According to Census 2000, there are 105.5 million households within the United States that included 281.4 million people. Census 2000 revealed a great deal on the makeup of our population, including that 3.6 percent is Asian American, 12.3 percent is African American, and 12.5 percent is Hispanic American. This means that there are more than 10.2 million Asian Americans, more than 34.7 million African Americans, and more than 35.3 million Hispanic Americans living within the United States. In 2009, in some areas the minorities indeed comprised the majority of the population. From 2000 to 2010, the minority groups are expected to grow at a much faster pace than the rest of the population. Such a dramatic difference in growth seriously changes the retailing landscape. Marketing companies must embrace these trends and determine how to best configure their marketing mix to meet the needs of these varying cultures. Their inclusion in the research process and marketing plans will be crucial to the long-term success of many organizations. Mazda North America, though it had been making efforts to sell with diversity in mind, decided to put more money and effort into targeting Hispanic, Asian, and African Americans in the years 2010 to 2015. Univision, a Hispanic television network, is using these results to pitch to CEOs to put more money into ethnic entertainment. Understanding that the Asian American, African American, and Hispanic American markets are not only different markets but also different cultures, each with vastly different histories, will fuel America’s growth for the next decade.15 ▪ OTHER GOVERNMENT PUBLICATIONS In addition to the census, the federal government collects and publishes a great deal of statistical data. The more useful publications are Business America, Business Conditions Digest, Business Statistics, Index to Publications, Statistical Abstract of the United States, and Survey of Current Business. The second example in the “Overview” section showed how statistics from the U.S. Department of Labor helped fast-food restaurants switch from a high touch to a high tech orientation. Extensive business statistics can be obtained from FedStats (www.fedstats.gov) and Stat-USA (www.stat-usa.gov). FedStats compiles statistical information from more than 100 agencies. The U.S. Department of Commerce can be reached at www.doc.gov. The Bureau of Census information can be reached via the Department of Commerce (www.doc.gov) or directly at www.census.gov.
  14. CHAPTER 4 • EXPLORATORY RESEARCH DESIGN: SECONDARY DATA 111 The

    Bureau of Labor Statistics provides useful information, especially Consumer Expenditure Surveys (www.bls.gov). A wide range of economic statistics can be obtained from the Bureau of Economic Analysis (www.bea.doc.gov). Information about public companies can be obtained from the EDGAR Database of Corporate Information that contains SEC filings (www.sec.gov/ edgar.shtml). Information about small businesses can be obtained at www.sbaonline.sba.gov. Two of the most useful sources for locating government organizations are the U.S. Government Manual and the Congressional Directory; both can be located at www.gpoaccess.gov. These government sites can provide valuable information to the marketing researcher. Experiential U.S. Census Bureau Research The 2000 census of the United States provides insight into the demographic profile of not only the United States in full, but also smaller U.S. regions, such as states and MSAs. Go to the home page for the U.S. Census Bureau (www.census.gov) and do the following: 1. Find the population clocks on the U.S. Census Bureau’s home page. What is the current population estimate for the United States? For the world? 2. Find “state and county quick facts.” Compare your home state’s “population percentage change from 1990 to 2000” with that of the United States in full. Which grew faster? 3. Find out how many “singles without children living at home” were counted in your zip code in the 2000 census. Look on the left side of the home page, select “American FactFinder,” and follow the steps shown. ▪ Most published information is also available in the form of computerized databases. Computerized Databases Computerized databases consist of information that has been made available in computer-readable form for electronic distribution. In the 2000s, the number of databases, as well as the vendors pro- viding these services, has grown phenomenally.16 Thus, a classification of computerized databases is helpful. Classification of Computerized Databases Computerized databases may be classified as online, Internet, or offline, as shown in Figure 4.3. Online databases consist of a central data bank, which is accessed with a computer via a telecommunications network. Internet databases can be accessed, searched, and analyzed on the Internet. It is also possible to download data from the Internet and store it in the computer or an auxiliary storage device.17 Offline databases make the information available on diskettes and CD-ROM disks. Thus, offline databases can be accessed at the user’s location without the use of an external telecommunications network. For example, the U.S. Bureau of the Census makes online databases Databases, stored in computers, that require a telecommunications network to access. Internet databases Internet databases can be accessed, searched, and analyzed on the Internet. It is also possible to download data from the Internet and store it in the computer or an auxiliary storage device. Online Bibliographic Databases Numeric Databases Full-Text Databases Directory Databases Special-Purpose Databases Computerized Databases Offline Internet FIGURE 4.3 A Classification of Computerized Databases offline databases Databases that are available on diskette or CD-ROM.
  15. 112 PART II • RESEARCH DESIGN FORMULATION bibliographic databases Databases

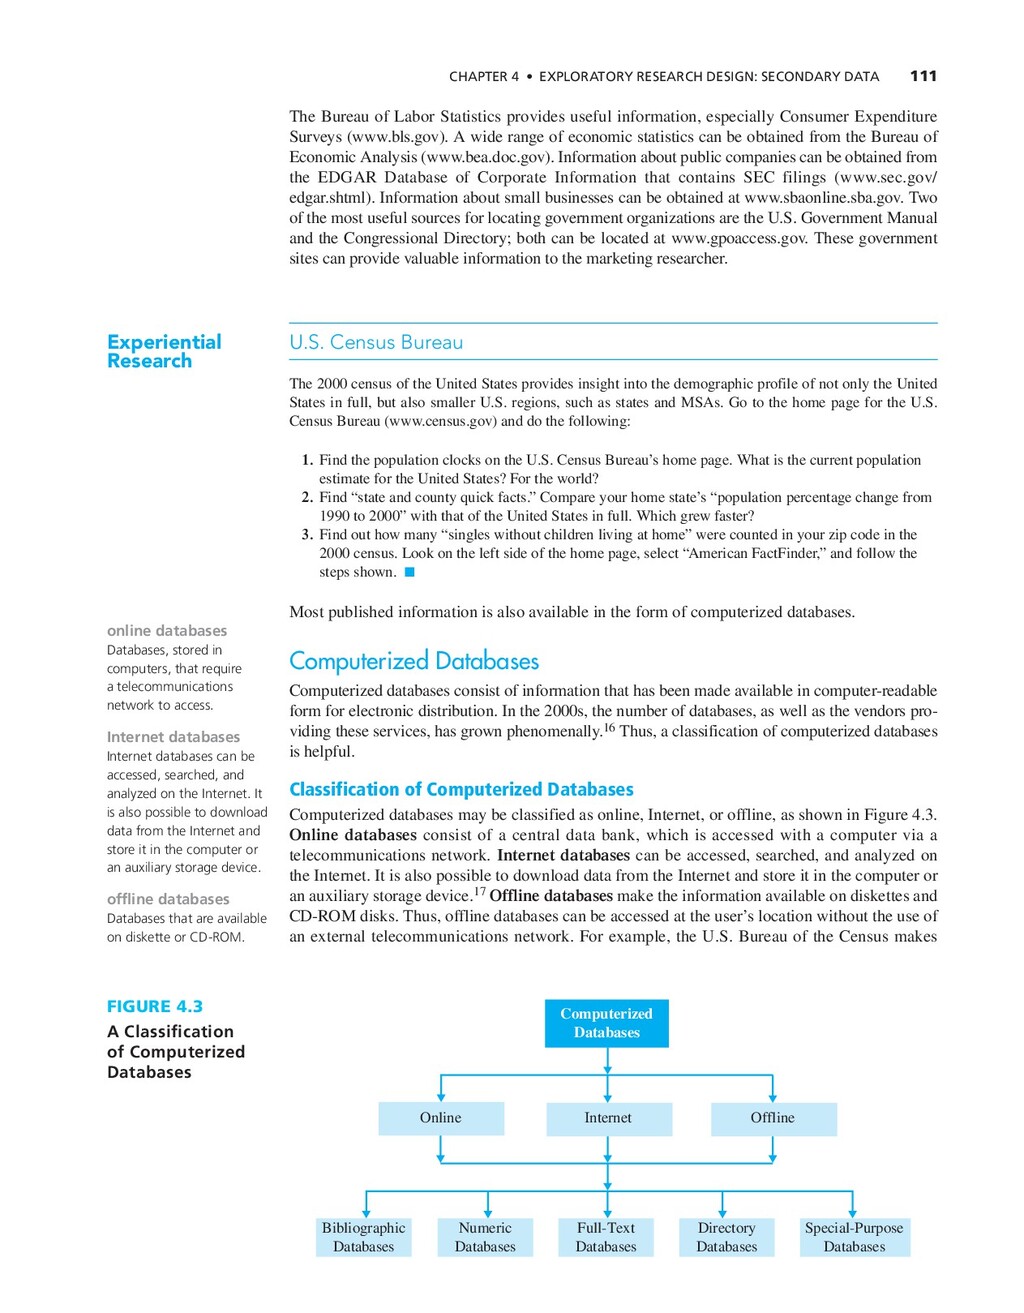
    composed of citations to articles in journals, magazines, newspapers, marketing research studies, technical reports, government documents, and the like. They often provide summaries or abstracts of the material cited. numeric databases Numeric databases contain numerical and statistical information that may be important sources of secondary data. full-text databases Databases containing the complete text of secondary source documents comprising the database. directory databases Directory databases provide information on individuals, organizations, and services. Real Research InfoUSA: Here, There, and Everywhere InfoUSA (www.infousa.com) is a leading provider of sales and marketing support data. The company gathers data from multiple sources, including: ᭹ 5,200 Yellow Page and Business White Page directories ᭹ 17 million phone calls to verify information. Every business is called one to four times a year. ᭹ County courthouse and Secretary of State data ᭹ Leading business magazines and newspapers ᭹ Annual reports ᭹ 10Ks and other SEC filings ᭹ New business registrations and incorporations ᭹ Postal service information, including National Change of Address, ZIP+4 carrier route, and Delivery Sequence files The underlying database on which all these products are based contains information on 210 million U.S. consumers and 14 million businesses, as of 2009. The products derived from these databases include sales leads, mailing lists, business directories, mapping products, and also delivery of data on the Internet.19 ▪ Online, Internet, and offline databases may be further classified as bibliographic, numeric, full-text, directory, or special-purpose databases. Bibliographic databases are composed of citations to arti- cles in journals, magazines, newspapers, marketing research studies, technical reports, government documents, and the like.20 They often provide summaries or abstracts of the material cited. Examples of bibliographic databases include ABI/Inform and the Predicasts Terminal System. Another bibliographic database, Management Contents, provided by the Dialog Corporation, was used to enhance the literature search in the department store patronage project. Numeric databases contain numerical and statistical information, such as survey and time- series data. Economic and industry data lend themselves to time-series presentations, which are developed when the same variables are measured over time. Such data are particularly relevant for assessing market potential, making sales forecasts, or setting sales quotas. The American Statistics Index (ASI) provides abstracts and indexes of federal government statistical publications. Global Financial Data (www.globalfinancialdata.com) provides historical data on securities, dividends, and exchange rates. Commercially updated census data are another example of numeric databases. Several sources provide updated, current-year and 5-year projections on population statistics collected in the latest census. A variety of geographic categorization schemes, including census tract, zip code, and Nielsen’s Designated Market Areas or Selling Areas, can be used as keys for searching these databases. Claritas, now know as Nielsen’s Claritas (www.claritas.com), is one firm that provides updated demographic information annually. Full-text databases contain the complete text of the source documents comprising the database. Vu/Text Information Systems, Inc., provides electronic full-text delivery and search capabilities for a number of newspapers (e.g., Washington Post, Boston Globe, Miami Herald). The LexisNexis service provides full-text access to hundreds of business databases, including selected newspapers, periodicals, company annual reports, and investment firm reports. Directory databases provide information on individuals, organizations, and services. Economic Information Systems, Inc., through its database EIS Nonmanufacturing Establish- ments, provides information on location, headquarters, name, percentage of industry sales, industry classification, and employment size class for about 200,000 nonmanufacturing establishments that employ 20 or more people. As another example, the national electronic Yellow Pages directories of manufacturers, wholesalers, retailers, professionals, and service computer data files available on CD-ROM disks. These disks contain detailed information orga- nized by census track or zip code. In the department store patronage project, this type of informa- tion was used in sample selection.18 As indicated by the following example, several vendors are providing data in various forms.
  16. CHAPTER 4 • EXPLORATORY RESEARCH DESIGN: SECONDARY DATA 113 special-purpose

    databases Databases that contain information of a specific nature, e.g., data on a specialized industry. organizations provide the names, addresses, and North American Industrial Classification codes of numerous organizations. Finally, there are special-purpose databases. For example, the Profit Impact of Market Strategies (PIMS) database is an ongoing database of research and analysis on business strategy conducted by the Strategic Planning Institute in Cambridge, Massachusetts. This database com- prises more than 250 companies, which provide data on more than 2,000 businesses.21 Virtually all libraries of major universities maintain computerized databases of management and related literature that students can access free of charge. Although computerized databases are numerous and varied, their sheer number can be over- whelming and locating a particular database may seem difficult. How, then, do you locate specific bibliographic, numeric, full-text, directory, or special-purpose databases? Directories of databases provide the needed help. Directories of Databases There are numerous sources of information on databases. Perhaps the best way to obtain informa- tion about databases is to consult a directory. The Gale Directory of Databases (www.gale. cengage.com) is published every six months. Volume 1 covers online databases and Volume 2 covers CD-ROMs and other offline databases. Some of the other useful directories that are periodically updated are: Directory of On-line Databases Santa Monica, CA: Cuadra Associates, Inc. (www. cuadra.com) Encyclopedia of Information System and Services Detroit: Gale Research Company Syndicated Sources of Secondary Data In addition to published data or data available in the form of computerized databases, syndi- cated sources constitute the other major source of external secondary data. Syndicated services, also referred to as syndicated sources, are companies that collect and sell common pools of data of known commercial value, designed to serve information needs shared by a number of clients (see Chapter 1). These data are not collected for the purpose of marketing research problems specific to individual clients, but the data and reports supplied to client com- panies can be personalized to fit particular needs. For example, reports could be organized on the basis of the clients’ sales territories or product lines. Using syndicated services is frequently less expensive than collecting primary data. Figure 4.4 presents a classification of syndicated services. Syndicated services can be classified based on the unit of measurement (households/ consumers or institutions). Household/consumer data may be obtained from surveys, purchase and media panels, or electronic scanner services. Information obtained through surveys consists of values and lifestyles, advertising evaluation, or general information related to preferences, purchase, consumption, and other aspects of behavior. Panels emphasize information on pur- chases or media consumption. Electronic scanner services might provide scanner data only, scanner data linked to panels, or scanner data linked to panels and (cable) TV. When institutions are the unit of measurement, the data may be obtained from retailers, wholesalers, or industrial firms. An overview of the various syndicated sources is given in Table 4.3 on page 115. Each of these sources will be discussed. Syndicated Data from Households Surveys Various syndicated services regularly conduct surveys, which involve interviews with a large number of respondents using a predesigned questionnaire. Often these surveys are conducted on samples drawn from panels. Panels were discussed in Chapter 3 in the context of longitudinal research designs. Panels are samples of respondents who provide specified information at regular intervals over an extended period of time. These respondents may be organizations, households, syndicated services (sources) Information services offered by marketing research organizations that provide information from a common database to different firms that subscribe to their services. surveys Interviews with a large number of respondents using a predesigned questionnaire.
  17. 114 PART II • RESEARCH DESIGN FORMULATION Households/ Consumers Panels

    Purchase Media Psychographic and Lifestyles Advertising Evaluation Volume Tracking Data Scanner Panels with Cable TV Scanner Panels Direct Inquiries Corporate Reports Clipping Services Retailers Industrial Firms Wholesalers Audits Unit of Measurement Surveys Electronic Scanner Services Institutions General FIGURE 4.4 A Classification of Syndicated Services syndicated panel surveys Syndicated panel surveys measure the same group of respondents over time but not necessarily on the same variables. or individuals, although household panels are most common. Comprehensive demographic, lifestyle, and product-ownership data are collected only once as each respondent is admitted into the panel. The panel is used as a respondent pool from which the research organization can draw either representative or targeted samples based on the relevant background characteristics of the panel members. Response rates to panel surveys, including mail panels, are substantially improved over the random sampling process because of the commitment panel members make to participate in surveys. Syndicated panel surveys measure the same group of respondents over time but not neces- sarily on the same variables. A large pool of respondents is recruited to participate on the panel. From this pool, different subsamples of respondents may be drawn for different surveys. Any of the survey techniques may be used, including telephone, personal, mail, or electronic interview- ing. The content and topics of the surveys vary and cover a wide range. Also known as omnibus panels, these panels are used to implement different cross-sectional designs at different points in time, generally for different surveys. For example, eNation involves five weekly online omnibus surveys of 1,000 American adults using Synovate’s (www.synovate.com) Global Opinion Panels. Synovate has other omnibus panels including TeleNation with two national telephone surveys each week that total 2,000 interviews. Omnibus panels are different from the panels using longitudinal designs discussed in Chapter 3. It may be recalled that in a longitudinal design, repeated measurements on the same variables are made on the same sample, and such panels are also referred to as true panels to distinguish them from omnibus panels. Surveys may be broadly classified on the basis of their content as psychographics and lifestyles, advertising evaluation, or general surveys. PSYCHOGRAPHICS AND LIFESTYLES Psychographics refer to the psychological profiles of individuals and to psychologically based measures of lifestyle. Lifestyles refer to the distinctive modes of living of a society or some of its segments. Together, these measures are generally referred to as Activities, Interests, and Opinions, or simply AIOs. The following example provides an application. psychographics Quantified psychological profiles of individuals. lifestyles A lifestyle may be defined as a distinctive pattern of living that is described by the activities people engage in, the interests they have, and the opinions they hold of themselves and the world around them (AIOs).
  18. CHAPTER 4 • EXPLORATORY RESEARCH DESIGN: SECONDARY DATA 115 TABLE

    4.3 Overview of Syndicated Services Type Characteristics Advantages Disadvantages Uses Surveys Surveys conducted at regular intervals Most flexible way of obtaining data; information on underlying motives Interviewer errors; respondent errors Market segmentation; advertising theme selection, and advertising effectiveness Purchase Panels Households provide specific information regularly over an extended period of time; respondents asked to record specific behaviors as they occur Recorded purchase behavior can be linked to the demographic/ psychographic characteristics Lack of representativeness; response bias; maturation Forecasting sales, market share, and trends; establishing consumer profiles, brand loyalty, and switching; evaluating test markets, advertising, and distribution Media Panels Electronic devices automatically recording behavior, supplemented by a diary Same as purchase panel Same as purchase panel Establishing advertising rates; selecting media program or air time; establishing viewer profiles Scanner Volume Tracking Data Household purchases recorded through electronic scanners in supermarkets Data reflect actual purchases; timely data; less expensive Data may not be representative; errors in recording purchases; difficult to link purchases to elements of marketing mix other than price Price tracking, modeling; effectiveness of in-store promotion Scanner Panels with Cable TV Scanner panels of households that subscribe to cable TV Data reflect actual purchases; sample control; ability to link panel data to household characteristics Data may not be representative; quality of data limited Promotional mix analyses; copy testing; new-product testing; positioning Audit Services Verification of product movement by examining physical records or performing inventory analysis Relatively precise information at the retail and wholesale levels Coverage may be incomplete; matching of data on competitive activity may be difficult Measurement of consumer sales and market share competitive activity; analyzing distribution patterns; tracking of new products Industrial Product Syndicated Services Data banks on industrial establishments created through direct inquiries of companies, clipping services, and corporate reports Important source of information on industrial firms; particularly useful in initial phases of the project Data are lacking in terms of content, quantity, and quality Determining market potential by geographic area; defining sales territories; allocating advertising budget Real Research Campbell Makes Sure AIOs Are in Its Alphabet Soup Yankelovich Research and Consulting Services (www.yankelovich.com) provides the Yankelovich Monitor, a survey that contains data on lifestyles and social trends. The survey is conducted at the same time each year among a nationally projectable sample of 2,500 adults, 16 years of age or older, including a special sample of 300 college students living on campus. The sample is based on the most recent census data. Interviews are conducted in person at the respondent’s home and take approximately 1.5 hours to complete. In addition, a questionnaire that takes about one hour to complete is left behind for the respondents to answer and mail
  19. 116 PART II • RESEARCH DESIGN FORMULATION When syndicate data

    showed an adult craving for foods that cater to a healthy appetite, Campbell introduced their Chunky Soup. back. Advertising agencies use the Yankelovich Monitor to discern changes in lifestyles and design advertis- ing themes that reflect these trends. When the Monitor showed an adult craving for foods that cater to a healthy appetite, Campbell (campbellsoup.com) introduced their Chunky Soup by using the NFL as a sponsor and stars Kurt Warner and Donovan McNabb in many of their commercials. These commercials showed that even soup can be hearty enough for the “big boys,” in hopes of reaching a target market of adults who want a soup that can fill them up. The 2006 Winter Olympics featured advertisements that showed Olympic athletes trying to keep themselves warm and satisfied by eating Campbell’s soup. The company also used Sarah Hughes, Olympic Gold Medalist, as an ambassador for its Campbell’s Labels for Education™ program.22 ▪ SRI Consulting, partner of SRI International and formerly Stanford Research Institute (www.future.sri.com), conducts an annual survey of consumers that is used to classify persons into VALS-2 (Values and Lifestyles) types for segmentation purposes.23 Information on specific aspects of consumers’ lifestyles is also available. GfK Custom Research North America (www.gfkamerica.com) conducts an annual survey of 5,000 consumers who participate in leisure sports and recreational activities. Several firms conduct surveys to compile demographic and psychographic information at the household, sub-zip (e.g., 30306-3035), and zip-code level, which is then made available on a subscription basis. Such information is particularly valuable for client firms seeking to enhance internally generated customer data for database marketing. ADVERTISING EVALUATION The purpose of advertising evaluation surveys is to assess the effectiveness of advertising using print and broadcast media. A well-known survey is the Gallup and Robinson Magazine Impact Research Service (MIRS) (www.gallup-robinson.com). In the MIRS, ads are tested using an at-home in-magazine context among widely dispersed samples. The system offers standardized measures with flexible design options. Test ads may naturally appear in the magazine or are inserted as tip-ins. It provides strong, validated measures of recall, persuasion, and ad reaction with responsive scheduling. Such results are particularly important to heavy advertisers, such as Procter & Gamble, General Motors, Sears, PepsiCo, Eastman Kodak, and McDonald’s, who are greatly concerned about how well their advertising dollars are spent.24 Evaluation of effectiveness is even more critical in the case of TV advertising. Television commercials are evaluated using either the recruited audience method or the in-home viewing method. In the former method, respondents are recruited and brought to a central viewing facility, such as a theater or mobile viewing laboratory. The respondents view the commercials and pro- vide data regarding knowledge, attitudes, and preferences related to the product being advertised and the commercial itself. In the in-home viewing method, consumers evaluate commercials at home in their normal viewing environment. New commercials can be pretested at the network level or in local markets distributed via DVDs. A survey of viewers is then conducted to assess the effectiveness of the commercials. Gallup & Robinson, Inc. (www.gallup-robinson.com) offers testing of television commercials using both these methods.
  20. CHAPTER 4 • EXPLORATORY RESEARCH DESIGN: SECONDARY DATA 117 These

    methods are also used for testing the effectiveness of advertising in other media such as magazines, radio, newspapers, and direct mail. Experian Simmons (www.smrb.com) conducts four different surveys with a large sample of respondents so that magazine, TV, newspaper, and radio media exposure can be monitored. Mediamark Research & Intelligence (www.mediamark.com) is another firm that makes available information on the consumption of media, products, and services by household. Its Starch Readership Survey specializes in measuring audience levels for print media. Starch annually measures exposure and readership levels for nearly 1,000 issues of con- sumer, business, and industrial publications. Personal interviews are conducted with a sample of more than 100,000 respondents. A recognition method is used in which the respondents are shown advertisements in recently published magazines. Each individual is questioned about each ad. Based on the response to an ad, the individual is classified into one of the following four levels of recognition: (1) Nonreader: The individual has not seen the advertisement; (2) Noted: The individual remembers seeing the advertisement in this issue; (3) Associated: The individual has seen the advertisement and recog- nizes the brand or advertiser’s name; and (4) Read most: The individual read 50 percent or more of the written material in the advertisement. These data are summarized for each advertisement in each magazine. From these statistics, Starch can generate overall readership percentages, readership per advertising dollar (based on current advertising rates), and advertisement rank within product categories. This type of data can be used to compare advertisements across current or past issues as well as against averages for the product category. This information is very useful to companies that advertise heavily in print media, such as American Airlines, Gucci, and GM, for evaluating the effectiveness of their advertising. GENERAL SURVEYS Surveys are also conducted for a variety of other purposes, including examination of purchase and consumption behavior. For example, Harris Interactive’s (www.harrisinteractive.com) ShopperInsight is an Internet-based survey of 26,000 primary household shoppers nationwide asking for their reasons why they have chosen a particular supermarket, drugstore, or mass merchandiser. Shoppers are asked to rate their shopping experience based on 30 key factors that influence their choice of retailer, from checkout lines to store cleanliness, hours, and location. In addition, attributes such as product pricing and selection are evaluated across 45 individual product categories for every supermarket, drugstore, and mass merchandiser. These findings can help merchandisers like Wal-Mart gauge their strengths and weaknesses. For example, the findings from a recent survey reinforced Wal-Mart’s strategy of providing everyday low prices versus having frequent promotions on special items. The results showed that Wal-Mart’s prices were 3.8 percent lower than Target, its closest competitor. USES OF SURVEYS Since a wide variety of data can be obtained, survey data have numerous uses. They can be used for market segmentation, as with psychographics and lifestyles data, and for establishing consumer profiles. Surveys are also useful for determining product image, measurement and positioning, and conducting price perception analysis. Other notable uses include advertising theme selection and evaluation of advertising effectiveness. Real Research CARAVAN Survey Opinion Research Corporation (www.opinionresearch.com) is a research and consulting firm that helps organizations worldwide to improve their marketing performance. One of its service offerings, CARAVAN®, is a twice-weekly telephone survey, each conducted among a national probability sample of 1,000 adults. An online version is also offered. One of the clients was national restaurant chain like Chili’s. It needed to determine the general public’s reaction to a proposed new advertising campaign. The campaign would include a celebrity endorsement involving a sports personality in a television commercial as well as an in-store promotion centered on that celebrity. Through CARAVAN, the restaurant chain was able to gain valuable insights into the potential impact of the ad campaign. The questions asked in the survey were designed to understand if the whole campaign would be appealing to the target market segment (young families, in this case). It also covered questions that probed if the celebrity’s image matched with the perceived image of the restaurant chain and the values it stood for. Thus the survey enabled the study of the potential impact of the ad campaign on the public’s opinion and their future visits to the restaurant chain. ▪
  21. 118 PART II • RESEARCH DESIGN FORMULATION A study using

    the NPD online panel indicated that women actually like shopping for swimwear. Real Research Information in These Diaries (Panels) Is No Secret The NPD Group (www.npd.com) is a leading provider of essential market information collected and deliv- ered online for a wide range of industries and markets and has over 1600 clients, ranging from Fortune 100 leaders to smaller businesses as of 2009. NPD combines information obtained via surveys with that recorded by respondents about their behaviors to generate reports on consumption behaviors, industry sales, market share, and key demographic trends. NPD consumer information is collected from their Online Panel about a wide range of product categories, including fashion, food, fun, house and home, tech and auto. Respondents provide detailed information regarding the brand and amount purchased, price paid, whether any special deals were involved, the store where purchased, and intended use. The composition of the panel ADVANTAGES AND DISADVANTAGES OF SURVEYS Surveys are the most flexible means of obtaining data from respondents. The researcher can focus on only a certain segment of the population—for example, teenagers, owners of vacation homes, or housewives between the ages of 30 and 40. Surveys are the primary means of obtaining information about consumers’ motives, attitudes, and preferences. A variety of questions can be asked, and visual aids, packages, prod- ucts, or other props can be used during the interviews. Properly analyzed, survey data can be manipulated in many ways so that the researcher can look at intergroup differences, examine the effects of independent variables such as age or income, or even predict future behavior. On the other hand, survey data may be limited in several significant ways. The researcher has to rely primarily on the respondents’ self-reports. There is a gap between what people say and what they actually do. Errors may occur because respondents remember incorrectly or give socially desirable responses. Furthermore, samples may be biased, questions poorly phrased, interviewers not properly instructed or supervised, and results misinterpreted. Purchase and Media Panels Often, survey data can be complemented with data obtained from purchase and media panels. While panels are also maintained for conducting surveys, the distinguishing feature of purchase and media panels is that the respondents record specific behaviors as they occur. Previously, behavior was recorded in a diary, and the diary was returned to the research organization every one to four weeks. Paper diaries have been gradually replaced by electronic diaries. Now, most of the panels are online and the behavior is recorded electronically, either entered online by the respondents or recorded automatically by electronic devices. Panel members are compensated for their participation with gifts, coupons, information, or cash. The content of information recorded is different for purchase panels and media panels. PURCHASE PANELS In purchase panels, respondents record their purchases of a variety of different products, as in the NPD Panel. purchase panels A data-gathering technique in which respondents record their purchases online or in a diary.
  22. CHAPTER 4 • EXPLORATORY RESEARCH DESIGN: SECONDARY DATA 119 media

    panels A data-gathering technique that is comprised of samples of respondents whose television viewing behavior is automatically recorded by electronic devices, supplementing the purchase information recorded online or in a diary. is representative of the U.S. population as a whole. For example, a recent study conducted by NPD revealed that women actually like shopping for swimwear. According to the survey, women rated their overall shop- ping experience for swimwear as excellent or very good, with 69 percent of satisfied shoppers being in the age range of 35–44. The results also showed that the biggest purchasing influences for a retail buyer are point-of-purchase display and the hang-tag description on the suit, while for a catalog buyer the catalog lay- out is important. These findings have obvious implications for the marketing of swimwear. Another recent study identified the top five women’s accessory purchases as (1) handbag/purse, (2) costume/fashion jew- elry, (3) fashion hair accessory, (4) sunglasses, and (5) gloves/mittens. Such findings help department stores in determining the product mix for women’s departments.25 ▪ Other organizations that maintain purchase panels include the NFO World Group (www.nfow.com). This group maintains a number of panels, including a large interactive panel. NFO Special Panels, such as the Baby Panel, provide access to highly targeted groups of consumers. Each quarter, approximately 2,000 new mothers and 2,000 expectant mothers join the NFO Baby Panel. MEDIA PANELS In media panels, electronic devices automatically record viewing behavior, thus supplementing a diary or an online panel. Perhaps the most familiar media panel is Nielsen Television Index by Nielsen Media Research (www.nielsenmedia.com), which provides television ratings and audience estimates. The heart of the Nielsen Media Research national ratings service is an electronic measurement system called the Nielsen People Meter. These meters are placed in a sample of 11,000 households in the United States, randomly selected and recruited by Nielsen Media so as to be representative of the population. The People Meter is placed on each TV in the sample household. The meter measures two things—what program or channel is being tuned in and who is watching. Household tuning data for each day are stored in the in-home metering system until they are automatically retrieved by Nielsen Media Research’s computers each night. Nielsen Media Research’s Operations Center in Dunedin, Florida, processes this information each night for release to the television industry and other customers the next day. To measure the audiences for local television, Nielsen Media Research gathers viewing infor- mation using TV diaries, booklets in which samples of viewers record their television viewing during a measurement week. They conduct diary measurement for each of the 210 television markets in the country four times each year, during February, May, July, and November. The diary requests that viewers write down not only who watched, but what program and what channel they watched. Once the diaries are filled out, viewers mail them back to Nielsen Media Research and the information is transferred into computers in order to calculate ratings. Using these data, Nielsen estimates the number and percentage of all TV households viewing a given show. This information is also disaggregated by 10 demographic and socioeconomic characteristics, such as household income, education of head of house, occupation of head of house, household size, age of children, age of women, and geographical location. The Nielsen Television Index is useful to firms such as AT&T, Kellogg Company, JCPenney, Pillsbury, and Unilever in selecting specific TV programs on which to air their commercials.26 In April 2007, Nielsen Media Research introduced the new commercial-minute ratings that allow advertising agencies, advertisers, and programmers to develop individualized minute-by-minute ratings of national commercials by demographic group for all national tele- vision programs. Another index by the same company is the Nielsen Homevideo Index®, NHI. The NHI was established in 1980 and provides a measurement of cable, pay cable, VCRs, DVD players, satellite dishes, and other new television technologies. The data are collected through the use of People Meters, set-tuning meters, and paper diaries. In addition to the Nielsen Television Index, other services provide media panels. Arbitron maintains local and regional radio and TV diary panels. Arbitron’s (www.arbitron.com) Portable People Meter is a panel-based measure of multimedia, including TV, radio, satellite radio, and the Web.27 In the ScanAmerica peoplemeter ratings system, an electronic meter automatically collects continuous detailed measures of television set tuning for every set in the home. TV BehaviorGraphics™, by Simmons Market Research Bureau (www.smrb.com), is a behavioral targeting system used to identify the best prospects for products and services based on con- sumers’ viewing of broadcast and cable television programs. The system was developed through an integration process that merges the Nielsen National Television Index (NTI) with the
  23. 120 PART II • RESEARCH DESIGN FORMULATION Real Research Hitwise:

    Monitoring Web Site Hits Hitwise (www.hitwise.com) is a leading provider of online competitive intelligence services. Every day, the company monitors more than 25 million Internet users and interacts with more than 450,000 Web sites across industry categories in several countries. Hitwise benchmarks its clients’ online presence to compet- ing Web sites. Client firms use this information to optimize their online investment in affiliate programs, marketing, online advertising, content development, and lead generation. For example, Heinz is one of the clients that has hugely benefited from the services offered by Hitwise. Heinz had created nearly 57 varieties of microsites for its brands at the peak of the dot.com craze. However, today, thanks to Hitwise, Heinz has learned specific online activity is only relevant for core brands such as ketchup, baby food, and beans. For other brands, brand value is delivered via the corporate site. The Hitwise methodology is as follows. Hitwise provides daily rankings of Web sites in more than 160 industry and interest categories. It also offers a range of online tools allowing subscribers to analyze and track competing Web sites. Subscribers can also track Internet usage patterns. Hitwise monitors Internet Service Provider (ISP) networks and other data sources for this purpose (visits that any Web site receives from the ISP’s subscribers). The figures from ISPs are aggregated to calculate a site’s ranking. Hitwise extracts from the partner ISP’s networks a list of the Web sites visited and ranks them according to a range of industry standard metrics, including page requests, visits, and average visit length. Hitwise also extracts Click-Stream data, which analyzes the movements of visitors between sites to provide subscribers with information on traffic to and from competing sites. To ensure representative sampling, a geographically diverse range of ISP networks in metropolitan and regional areas, representing all types of Internet usage including home, work, educational, and public access, are monitored.28 ▪ USES OF PURCHASE AND MEDIA PANELS Purchase panels provide information useful for forecasting sales, estimating market shares, assessing brand loyalty and brand-switching behavior, establishing profiles of specific user groups, measuring promotional effectiveness, and conducting controlled store tests. Media panels yield information helpful for establishing advertising rates by radio and TV networks, selecting appropriate programming, and profiling viewer or listener subgroups. Advertisers, media planners, and buyers find panel information to be particularly useful. ADVANTAGES AND DISADVANTAGES OF PURCHASE AND MEDIA PANELS As compared to sample surveys, purchase and media panels offer certain distinct advantages.29 Panels can provide longitudinal data (data can be obtained from the same respondents repeatedly). People who are willing to serve on panels may provide more and higher-quality data than sample respondents. In purchase panels, information is recorded at the time of purchase, eliminating recall errors.30 Information recorded by electronic devices is accurate because it eliminates human errors. The disadvantages of purchase and media panels include lack of representativeness, matura- tion, and response biases. Most panels are not representative of the U.S. population. They under- represent certain groups such as minorities and those with low education levels. This problem is further compounded by refusal to respond and attrition of panel members. Over time maturation sets in, and the panel members must be replaced (see Chapter 7). Response biases may occur, since simply being on the panel may alter behavior. Since purchase or media data are entered by hand, recording errors are also possible (see Chapter 3). Simmons National Consumer Survey (NCS). It consists of a multisegment cluster system that classifies consumers into distinct groups based on their television viewing behavior. The system, which is used by the top advertising agencies and television media, is available to subscribers. Syndicated services also collect the same type of audience data for radio. Radio audience statis- tics are typically collected using diaries two to four times per year Given the growing popularity of the Internet, syndicated services are also geared to this medium. Nielsen Online (www.nielsen-online.com) tracks and collects Internet usage in real time from over 50,000 home and work users. It reports site and e-commerce activity: number of visits to properties, domains, and unique sites; rankings by site and by category; time and frequency sta- tistics; traffic patterns; and e-commerce transactions. It also reports banner advertising: audience response to banners, creative content, frequency, and site placement. This service has been launched in collaboration with Nielsen.
  24. CHAPTER 4 • EXPLORATORY RESEARCH DESIGN: SECONDARY DATA 121 scanner

    data Data obtained by passing merchandise over a laser scanner that reads the UPC code from the packages. volume tracking data Scanner data that provides information on purchases by brand, size, price, and flavor or formulation. scanner panels Scanner data where panel members are identified by an ID card allowing each panel member’s purchases to be stored with respect to the individual shopper. Electronic Scanner Services Although information provided by surveys and purchase and media panels is useful, electronic scanner services are becoming increasingly popular. Scanner data reflect some of the latest tech- nological developments in the marketing research industry. Scanner data are collected by passing merchandise over a laser scanner, which optically reads the bar-coded description (the universal product code or UPC) printed on the merchandise. This code is then linked to the current price held in the computer memory and used to prepare a sales slip. Information printed on the sales slip includes descriptions as well as prices of all items purchased. Checkout scanners, which are now used in many retail stores, are revolutionizing packaged-goods marketing research. Three types of scanner data are available: volume tracking data, scanner panels, and scanner panels with cable TV. Volume tracking data provide information on purchases by brand, size, price, and flavor or formulation, based on sales data collected from the checkout scanner tapes. This information is collected nationally from a sample of supermarkets with electronic scanners. Scanner services providing volume tracking data include National Scan Track (Nielsen, www.nielsen.com) and InfoScan (Information Resources, Inc., usa.infores.com). IRI’s InfoScan tracking service collects scanner data weekly from more than 34,000 supermarket, drug, and mass merchandiser outlets across the United States. InfoScan store tracking provides detailed information on sales, share, distribution, pricing, and promotion.31 In scanner panels, each household member is given an ID card that can be read by the elec- tronic scanner at the cash register. The scanner panel member simply presents the ID card at the checkout counter each time she or he shops. In this way, consumer identity is linked to products purchased as well as the time and day of the shopping trip, and the firm can build a shopping record for that individual. Alternatively, some firms provide handheld scanners to panel members. These members scan their purchases once they are home. The Nielsen Consumer Panel, called Homescan, is used to record the purchases of approximately 300,000 households throughout the world. The consumer scans the bar codes on purchases with a handheld scanner, which records the price, promotions, and quantity of each item. The information in the handheld scanner is then transmitted to Nielsen through telephone lines. Nielsen uses the information from the scanner and additional information gathered from the consumer to determine such things as consumer demographics, quantity and frequency of purchases, percentage of households purchasing, shop- ping trips and expenditures, price paid, and usage information. Manufacturers and retailers use this information to better understand the purchasing habits of consumers. The Boston Market example given in the “Overview” section provided an illustration. According to Nielsen’s con- sumer panel data, 55 percent of respondents purchased a meal for at-home consumption several times a month.32 An even more advanced use of scanning, scanner panels with cable TV, combines scanner panels with new technologies growing out of the cable TV industry. Households on these panels subscribe to one of the cable TV systems in their market. By means of a cable TV “split,” the researcher targets different commercials into the homes of the panel members. For example, half the households may see test commercial A during the 6:00 P.M. newscast while the other half see test commercial B. These panels allow researchers to conduct fairly controlled experiments in a relatively natural environment. IRI’s BehaviorScan system contains such a panel.33 scanner panels with cable TV The combination of a scanner panel with manipulations of the advertising that is being broadcast by cable television companies. Real Research Using Total TV Households for Testing Total Advertising Based on cereal consumption research conducted in 2008, more than 90 percent of consumers eat cereal for breakfast and per capita consumption is very high. Results also indicated that cereal was the favorite breakfast item, and was eaten regularly by three out of four adults. Therefore, General Mills (www.generalmills.com) has been promoting Total cereal on national television but is concerned about the effectiveness of its commercials. Technology has been developed that allows transmission of advertising into participating households without the use of a cable TV system. Since the panel members can be selected from all available (total) TV households, not just those with cable TV, the bias of cable-only testing is eliminated. Using this type of system, General Mills can test which one of four test commercials for Total cereal results in the highest sales. Four groups of panel members are selected, and each receives a different test commercial. These households are monitored via scanner data to determine which group purchased the most Total cereal.34 ▪
  25. 122 PART II • RESEARCH DESIGN FORMULATION audit A data

    collection process derived from physical records or by performing inventory analysis. Data are collected personally by the researcher or by representatives of the researcher, and the data are based on counts, usually of physical objects other than people. J.D. Power: Powering Ford Vehicles Visit www.jdpower.com and write a brief report about the latest vehicle dependability study findings and methodology. As the CEO of Ford Motor Company, what marketing strategies would you adopt to increase the dependability and image of Ford vehicles? How can you make use of the J.D. Power vehicle dependability study and other secondary and syndicated data to help Ford Motor Company to increase the dependability and image of its vehicles? Syndicated Data from Institutions Retailer and Wholesaler Audits As Figure 4.4 shows, syndicated data are available for retailers and wholesalers as well as indus- trial firms. The most popular means of obtaining data from retailers and wholesalers is an audit. An audit is a formal examination and verification of product movement traditionally carried out by auditors who make in-person visits to retail and wholesale outlets and examine physical records or analyze inventory. Retailers and wholesalers who participate in the audit receive basic reports and cash payments from the audit service. Audit data focus on the products or services sold through the outlets or the characteristics of the outlets themselves, as illustrated by the following example. With the advent of scanner data, the need to perform audits has greatly decreased. Although audits are still being conducted, many do not collect data manually but make use of computerized information. An example of the traditional audit is the Nielsen Convenience Track, which is a retail audit of convenience stores in 30 local markets (www.nielsen.com). Another example is the National This example shows how scanner services incorporate advanced marketing research technology, which results in some advantages over survey and purchase panel data. USES OF SCANNER DATA Scanner data are useful for a variety of purposes.35 National volume tracking data can be used for tracking sales, prices, distribution, modeling, and analyzing early warning signals. Scanner panels with cable TV can be used for testing new products, repositioning products, analyzing promotional mix, and making advertising decisions, including budget, copy and media, and pricing. These panels provide marketing researchers with a unique controlled environment for the manipulation of marketing variables. ADVANTAGES AND DISADVANTAGES OF SCANNER DATA Scanner data have an obvious advantage over surveys and purchase panels, since they reflect purchasing behavior that is not subject to interviewing, recording, memory, or expert biases. The record of purchases obtained by scanners is complete and unbiased by price sensitivity, since the panelist is not required to be overly conscious of price levels and changes. Another advantage is that in-store variables like pricing, promotions, and displays are part of the data set. The data are also likely to be current and can be obtained quickly. Finally, scanner panels with cable TV provide a highly controlled testing environment. A major weakness of scanner data is lack of representativeness. National volume tracking data may not be projectable onto the total population, because only large supermarkets have scanners. Also, certain types of outlets, such as food warehouses and mass merchandisers, are excluded. Likewise, scanners have limited geographical dispersion and coverage. The quality of scanner data may be limited by several factors. All products may not be scanned. For example, a clerk may use the register to ring up a heavy item to avoid lifting it. If an item does not scan on the first try, the clerk may key in the price and ignore the bar code. Sometimes a consumer purchases many flavors of the same item, but the clerk scans only one pack- age and then rings in the number of purchases. Thus, the transaction is inaccurately recorded. With respect to scanner panels, the system provides information on TV sets in use rather than actual viewing behavior. Although scanner data provide behavioral and sales information, they do not provide information on underlying attitudes, preferences, and reasons for specific choices. ACTIVE RESEARCH
  26. CHAPTER 4 • EXPLORATORY RESEARCH DESIGN: SECONDARY DATA 123 Retail

    Census by GfK Audits & Surveys (www.gfkauditsandsurveys.com) that provides updated measurements of product distribution in all types of retail and service outlets. Conducted annually since its inception in 1953, it is based on a national probability sample of approximately 30,000 outlets of all kinds throughout the country in more than 500 different geographic areas. The audit is conducted by personal store visits, making GfK Audits & Surveys’ Retail Census the largest annual product availability measurement in the United States. For high speed and accuracy, the in-store auditors use handheld computers to capture UPC information electronically. Nielsen Convenience Track can integrate convenience store data with data from other channels, including grocery, drug, and mass merchandisers. Wholesale audit services, the counterpart of retail audits, monitor warehouse withdrawals. Participating operators, which include supermarket chains, wholesalers, and frozen-food ware- houses, typically account for more than 80 percent of the volume in the area. USES OF AUDIT DATA The uses of retail and wholesale audit data include (1) determining the size of the total market and the distribution of sales by type of outlet, region, or city; (2) assessing brand shares and competitive activity; (3) identifying shelf space allocation and inventory problems; (4) analyzing distribution problems; (5) developing sales potentials and forecasts; and (6) developing and monitoring promotional allocations based on sales volume. Thus, audit data were particularly helpful in obtaining information on the environmental context of the problem in the department store patronage project. ADVANTAGES AND DISADVANTAGES OF AUDIT DATA Audits provide relatively accurate information on the movement of many different products at the wholesale and retail levels. Furthermore, this information can be broken down by a number of important variables, such as brand, type of outlet, and size of market. However, audits have limited coverage. Not all markets or operators are included. Also, audit information may not be timely or current, particularly compared to scanner data. Typically, there is a two-month gap between the completion of the audit cycle and the publication of reports. Another disadvantage is that, unlike scanner data, audit data cannot be linked to consumer characteristics. In fact, there may even be a problem in relating audit data to advertising expenditures and other marketing efforts. Some of these limitations are overcome in electronic (online) audits, as the following example illustrates. Real Research Online Audits for Tracking Online Shopping Since 1997, Ashford.com offers a big selection and low prices for watches and jewelry. Obviously, for an online retailer, the holidays are a particularly important period. It is a time when many people shop online, so sales can really soar. Ashford.com was able to use electronic audit data about how their purchasers shop and how much they are buying. Nielsen Online (www.nielsen-online.com) constructed a Holiday E-Commerce Index, which measured Web shopping in eight different categories. Rather than gathering descriptive research about the customers from the customers, Nielsen Online gathered the data from the stores where the customers shopped. Because the orders were placed online, the store computers were able to track the purchases with ease. This computer tracking was then used to gather the purchasing information from the stores and accumulated into a report format. The survey told Ashford.com that a large portion of their customers were purchasing from the Web site while at work. This trend applied around the Web, as 46 percent of holiday online shopping was conducted during work hours versus the 54 percent that was conducted from consumers’ homes. Nielsen Online determined that Ashford.com’s customers were shopping during the lunch hour or in small, 10–15 minute clips throughout the day. Additionally, Nielsen Online demonstrated that online sales across the Web increased greatly in the first week of December as the holidays approached. Ashford.com’s sales increased 385 percent during this period, so they did extremely well compared to other online companies. This information told Ashford.com that they should make sure their site is up and working during the workday. Promotions should be offered and flashed on the screen during this time. Additionally, the company might want to start advertising in corporate settings. Newspapers like the Wall Street Journal and other corporate Web sites would be good places to advertise. Online retailers like Ashford.com must take advantage of electronic audits and other types of marketing research in order to offer the products that online consumers want.36 ▪
  27. 124 PART II • RESEARCH DESIGN FORMULATION industry services Industry

    services provide syndicated data about industrial firms, businesses, and other institutions. single-source data An effort to combine data from different sources by gathering integrated information on household and marketing variables applicable to the same set of respondents. Industry Services Industry services provide syndicated data about industrial firms, businesses, and other institutions. Financial, operating, and employment data are also collected by these syndicated research services for almost every North American Industry Classification System (NAICS) industrial category. These data are collected by making direct inquiries; from clipping services that monitor news- papers, the trade press, or broadcasts; and from corporate reports. The range and sources of syndi- cated data available for industrial goods firms are more limited than those available for consumer goods firms. Services available include D&B International Business Locator (www.dnb.com); Fortune Datastore, which contains databases such as the Fortune 500, Fortune 1000, Global 500, and the fastest-growing companies database (www.fortune.com); and Standard & Poor’s Information Services, which includes Corporate Profiles (www.standardpoor.com). The D&B International Business Locator provides one-click access to more than 28 million public/private companies in more than 200 countries. After finding a business, the locator will provide key business data, including full address information, NAIC/line of business details, business size (sales, net worth, employees), names of key principals and identification of this location’s headquarters, and domestic parent company and/or global parent company. USES OF INDUSTRY SERVICES Information provided by industrial services is useful for sales management decisions including identifying prospects, defining territories, setting quotas, and measuring market potential by geographic areas. It can also aid in advertising decisions such as targeting prospects, allocating advertising budgets, selecting media, and measuring advertising effectiveness. This kind of information is also useful for segmenting the market and designing custom products and services for important segments. ADVANTAGES AND DISADVANTAGES OF INDUSTRY SERVICES Industry services represent an important source of secondary information on industrial firms. The information they provide can be valuable in the initial phases of a marketing project. However, they are limited in the nature, content, quantity, and quality of information. Combining Information from Different Sources: Single-Source Data It is desirable to combine secondary information obtained from different sources. Combining data allows the researcher to compensate for the weakness of one method with the strengths of another. One outcome of the effort to combine data from different sources is single-source data. Single-source research follows a person’s TV, reading, and shopping habits. After recruiting a test panel of house- holds, the research firm meters each home’s TV sets and surveys family members periodically on what they read. Their grocery purchases are tracked by UPC scanners. For background, most systems also track retail data, such as sales, advertising, and promotion. Thus, single-source data provide inte- grated information on household variables, including media consumption and purchases, and market- ing variables, such as product sales, price, advertising, promotion, and in-store marketing effort.37 Information Resources, Inc. (www.infores.com) collects consumer purchase information from a nationally representative household panel of approximately 70,000 recruited households with coverage at the regional, national, and individual market level. It is designed to supply strategic direction to marketers by focusing on the consumer dynamics that drive brand and category performance. Complete multi-outlet purchase information on these households is tracked electronically. Panel households use a simple in-home scanning device, called a ScanKey, to record their purchases from all outlets. Panelists are not required to record any causal information except for manufacturer coupons. Price reductions are recorded by scanner, and features and displays are captured by IRI’s in-store personnel, ensuring an accurate and unbiased record of sales. Other examples of single-source data include CACI Marketing Systems (www.caci.com), MRI Cable Report by Mediamark Research (www.mediamark.com), and PRIZM by Claritas (www.claritas.com). The MRI Cable Report integrates information on cable television with demographic and product usage information. PRIZM combines census data, consumer surveys about shopping and lifestyles, and purchase data to identify segments. An application of single-source data is illustrated by the Campbell Soup Company.
  28. CHAPTER 4 • EXPLORATORY RESEARCH DESIGN: SECONDARY DATA 125 computer

    mapping Maps that solve marketing problems are called thematic maps. They combine geography with demographic information and a company’s sales data or other proprietary information and are generated by a computer. Real Research Soaps Shed a “Guiding Light” on V-8 Consumption CBS’s Guiding Light celebrated its 71st anniversary on January 25, 2008, making it the longest running drama ever. In 2008, both Guiding Light and ABC’s General Hospital were popular in terms of overall soap opera viewership (www.soapzone.com). The Campbell Soup Company (www.campbell.com) used single-source data to target its advertising for V8 juice (www.v8juice.com). By obtaining single-source data on product consumption, media consumption, and demographic characteristics, Campbell found that demographically similar TV audiences consume vastly different amounts of V8. For example, on an index of 100 for the average household’s V-8 consump- tion, General Hospital had a below-average 80 index, while Guiding Light had an above-average 120 index. These results were surprising, because General Hospital actually had a slightly higher percentage of women 25 to 54 years old, the demographic group most predisposed to buy V8, and so would be expected to be a better medium to reach V8 drinkers. Using this information, Campbell rearranged its advertising schedule to raise the average index. As of 2008, the V8 (www.v8juice.com) line consisted of V8 100% Vegetable Juices, V8 Splash Juice Drinks, and V8 V-Fusion Juices, that are a blend of vegetable and fruit juices.38 ▪ Computer Mapping The V8 example shows the usefulness of combining secondary information from different sources. As another example, computer mapping combines geography with demographic infor- mation and a company’s sales data or other proprietary information to develop thematic maps. Marketers now routinely make decisions based on these color-coded maps. Mapping systems allow users to download geographically detailed demographic data supplied by vendors. The user can then draw a map that color codes neighborhoods in Dallas, for example, by the relative density of households headed by 35- to 45-year-olds with incomes of $50,000 or more. These systems allow users to add proprietary information to the downloaded data. Computer mapping combines geography with demographic and other proprietary data to generate thematic maps. Real Research Claritas: Empowering Verizon’s Marketing Research Verizon Communications Inc., headquartered in New York, is a leader in delivering broadband and other wireline and wireless communication services, serving more than 80 million customers nationwide. When company executives recently decided to converge its local phone service with wireless, Internet, and long-distance services, they needed a way to identify the best customers and choicest markets for building a combined wireless and wireline network. And they needed to do so while being mindful of government restrictions against using phone customer data to market other communications services.
  29. 126 PART II • RESEARCH DESIGN FORMULATION Experiential Nielsen Online

    Research Nielsen Online reports on nearly 70 percent of the world’s Internet usage to give a broad view of the online world. The company focuses its research on Internet usage in the following countries: Australia, Brazil, France, Germany, Italy, Japan, Spain, Switzerland, the United Kingdom, and the United States. Go to Nielsen Online’s home page at www.nielsen-online.com. On the top menu bar, select “Resources” and then select “Free Data and Rankings.” Under “Internet Audience Metrics,” to view results for a country, double-click on the country name. For the following exercises, choose “Home Panel” and “Web Usage Data” to view the most recent month’s results for each country. (If the Web site has been restructured, follow a similar procedure.) Record your findings about each country’s “PC Time Per Person” in a table. 1. Which country posts the most “PC Time Per Person”? 2. Which country posts the least “PC Time Per Person”? Now choose “Global Index Chart” in order to view the latest month’s Global Internet Index: Average Usage. 3. What is the average “PC Time Spent per Month” for the set of countries? 4. Which countries were above the average for “PC Time Spent per Month” for the latest month? 5. Which countries were below the average for “PC Time Spent per Month” for the latest month? ▪ International Marketing Research A wide variety of secondary data are available for international marketing research.40 As in the case of domestic research, the problem is not one of lack of data but of the plethora of information available, and it is useful to classify the various sources. Secondary international data are available from both domestic government and nongovernment sources (see Figure 4.5). The most important government sources are the Department of Commerce (www.commerce.gov), the Agency for Verizon approached Nielsen Claritas (www.claritas.com) for help in formulating a marketing plan. Claritas provided those capabilities with geodemographic tools, proprietary surveys, and in-depth market analysis. Its industry-specific survey, Convergence Audit™, provided detailed profiles of consumers who use long-distance, paging, Internet, and cell phone services. The PRIZM segmentation system from Claritas classified Verizon customers by consumer demo- graphic and lifestyle characteristics into target groups for the various telephony services. Verizon also employed the Compass™ (also from Claritas) marketing analysis system to analyze its wireless markets and identify those markets with the highest potential for buying wireline services. Verizon identified 19 of 62 PRIZM clusters that are fertile ground for a converged wireless–wireline network. The company then used Compass to rank its wireless markets by concentration of target group clusters. In high-ranking markets like Little Rock, Arkansas; Charlotte, North Carolina; and Jacksonville, Florida, Verizon conducted direct marketing campaigns of bundled services to wireless customers. “In two days, we prioritized 54 markets so we had a battle plan on where to go first,” says Mickey Freeman, staff manager of strategic marketing. “Claritas gave us a common logic to look at the similarities and differences of each of our markets.”39 ▪ Another application of secondary data is provided by the Buying Power Index. Buying Power Index Sales & Marketing Management’s annual Survey of Buying Power (www.surveyofbuying power.com) provides data to help you analyze each of your U.S. markets, whether they are cities, counties, metro areas, or states. It features statistics, rankings, and projections for every county and media market in the United States with demographics broken out by age, race, city, county, and state; information on retail spending; and projections for future growth in these areas. All of the rankings are divided into 323 metro markets (geographic areas set by the Census Bureau) and 210 media markets (television or broadcast markets determined by Nielsen Media Research), all furnished by Claritas, Inc. There are also statistics that are unique to the Survey. Effective buying income (EBI) is a measurement of disposable income, and the buying power index (BPI), for which the Survey is best known, is a unique measure of spending power that takes population, EBI, and retail sales into account to determine a market’s ability to buy—the higher the index, the better.
  30. CHAPTER 4 • EXPLORATORY RESEARCH DESIGN: SECONDARY DATA 127 International

    Secondary Data International Organizations in the United States Organizations in Foreign Countries Domestic Organizations in the United States Government Sources Nongovernment Sources International Organizations Governments Trade Associations FIGURE 4.5 Sources of International Secondary Data International Development (www.usaid.gov), the Small Business Administration (www.sba.gov), the Export-Import Bank of the United States (www.exim.gov), the Department of Agriculture (www.usda.gov), the Department of State (www.state.gov), the Department of Labor (www.dol.gov), and the Port Authority of New York and New Jersey (www.panynj.gov). The Department of Commerce offers not only a number of publications but also a variety of other services, such as the foreign buyer program, matchmaker events, trade missions, export contact list service, the foreign commercial service, and custom statistical service for exporters. The National Trade Data Bank (www.stat-usa.gov) provides useful information about exporting to and importing from countries around the world. Another very useful source is the CIA World Factbook (www.cia.gov). Nongovernment organizations, including international organizations located in the United States, can also provide information about international markets. These data sources include the United Nations (www.un.org), the Organization for Economic Cooperation and Development (www.oecd.org), the International Monetary Fund (www.imf.org), the World Bank (www.world bank.org), the International Chambers of Commerce (www.iccwbo.org), the Commission of the European Union to the United States (www.eurunion.org), and the Japanese External Trade Organization (www.jetro.org). Finally, locally sourced secondary data are available from foreign governments, international organizations located abroad, trade associations, and private services, such as syndicated firms. To illustrate, the following sites provide useful country information: Australia (www.nla.gov.au) France (www.insee.fr) Japan (www.stat.go.jp/english) Norway (www.ssb.no) United Kingdom (www.statistics.gov.uk) While conducting a review of the literature, one could use directories, indexes, books, com- mercially produced reference material, and magazines and newspapers. Evaluation of secondary data is even more critical for international than for domestic projects. Different sources report different values for a given statistic, such as GDP, because of differences in the way the unit is defined. Measurement units may not be equivalent across countries. In France, for example, workers are paid a thirteenth monthly salary each year as an automatic bonus, resulting in a measurement construct that is different from other countries.41 The accuracy of secondary data may also vary from country to country. Data from highly indus- trialized countries like the United States are likely to be more accurate than those from develop- ing countries. Business and income statistics are affected by the taxation structure and the extent of tax evasion. Population censuses may vary in frequency and year in which the data are collected. In the United States, the census is conducted every 10 years, whereas in the People’s Republic of China there was a 29-year gap between the censuses of 1953 and 1982. However, this situation is changing fast. Several syndicated firms are developing huge sources of inter- national secondary data.
  31. 128 PART II • RESEARCH DESIGN FORMULATION Real Research Euroconsumers

    Go for Spending Splash The Gallup organization (www.gallup.com), which specializes in survey research obtaining both lifestyle and psychographic data, recently conducted interviews with more than 22,500 adults across the European Community. Their results point to an exploding consumer durable market, particularly for convenience items, such as remote controlled TVs, microwave ovens, VCRs, and cellular phones. The educational level and the standard of living among this consumer group are generally improving. Europeans are also displaying higher levels of discretionary purchasing, demonstrated in a growing demand for travel packages, which continued to be strong through the year 2008, until the recession hit In the personal-care market, the number of European women using perfume is declining, offset by a growing demand for deodorants. This type of syndicated data is useful to marketers such as Motorola, AT&T, and RCA, which are look- ing to develop European markets. For example, when renting an apartment in Germany, the renter must install all the major appliances and lighting fixtures. Whirlpool has developed value packages offering significant savings on appliances that are carefully targeted at apartment renters.42 ▪ Ethics in Marketing Research The researcher is ethically obligated to ensure the relevance and usefulness of secondary data to the problem at hand. The secondary data should be evaluated by the criteria discussed earlier in this chapter. Only data judged to be appropriate should be used. It is also important that the data were collected using procedures that are morally appropriate. Data can be judged unethical if they were gathered in a way that harms the respondents or invades their privacy. Ethical issues also arise if the users of secondary data are unduly critical of the data that do not support their interests and viewpoints. Real Research The Ethical Pill Can Be Bitter to Swallow ABC, NBC, CBS, some advertising agencies, and major advertisers are at odds with Nielsen Media Research’s (www.nielsenmedia.com) television ratings. They criticize Nielsen’s sampling scheme and intrusive data recording methodologies. A central issue in the criticisms of Nielsen is that the Big Three have received declining viewership ratings. As of 2009, prime-time viewership to the seven broadcast net- works has declined. The top four broadcast networks (ABC, CBS, NBC, and Fox) each had across-the- board audience declines. according to Nielsen Media Research data. Rather than accept the idea that the broadcast network audience is shrinking, the networks would pre- fer a more flattering assessment of their audiences. Ratings translate directly into advertising revenues. The more viewers a television show draws, the higher fees a network can charge for airing advertising at that spot. Advertising charges can differ dramatically between time slots, so accurate (or aggressive) viewer ratings are desirable from the network’s perspective. In defense of the networks, monopolies tend to resist innovation and lack incentive to improve processes. Complacency rules, as long as the money keeps coming. As a professional marketing research supplier, however, Nielsen Media Research is ethically bound to provide accurate and repre- sentative data—to the best of its ability. Users also have the ethical responsibility of not criticizing secondary data simply because the data do not support their own viewpoints. Eventually network executives will have to swallow the bitter pill of reality that cable TV, direct-broadcast satellite TV, and the Internet are all gaining ground over broadcast television viewership. Network executives find it difficult to swallow this pill.43 ▪ Given the limitations of secondary data, it is often necessary to collect primary data in order to obtain the information needed to address the management decision problem. The use of secondary data alone when the research problem requires primary data collection could raise ethical concerns. Such concerns are heightened when the client is being billed a fixed fee for the project and the proposal submitted to get the project did not adequately specify the data collection methodology. On the other hand, in some cases it may be possible to obtain the information needed from secondary sources alone, making it unnecessary to collect primary data. The unnecessary collection
  32. CHAPTER 4 • EXPLORATORY RESEARCH DESIGN: SECONDARY DATA 129 Decision

    Research Tommy Hilfiger: Keeping Abreast of the Market to Remain a Hi-Flier The Situation From the blacktop to the golf course, designer Tommy Hilfiger has the streets covered. His namesake casual wear is worn by rap, rock, teen, and sports stars and fans, and, these days, many of them are women. Tommy designs, sources, makes, and markets men’s and women’s sportswear and denim wear, as well as athletic wear, children’s wear, and accessories. Through extensive licensing deals (almost 40 product lines), Tommy also offers products such as fragrances, belts, bedding, home furnishings, and cosmetics. As of 2009, the company’s clean-cut clothing is sold in major department and specialty stores as well as some 180 Tommy Hilfiger shops and outlets. With such a large empire, it is no wonder that Fred Gehring, CEO and president of Tommy Hilfiger, is always kept busy trying to make sure the company does not forget the most important aspect of its business—satisfying consumers’ needs! Selling apparel will never be an easy job. “Just when you think you’ve figured out exactly what your customers want, everything changes—sometimes overnight,” says apparel expert Richard Romer, executive vice president for The CIT Group/Commercial Services, a New York–based credit protection and lending services provider for apparel manufacturers. “Basically, changes in apparel occur every other year: long skirts to short skirts, and back to long.” The apparel market’s constant state of flux forces catalogers and other marketers to constantly reevaluate the market they’re targeting, and then reinvent their companies, their offerings, and their catalogs. The Marketing Research Decisions 1. What sources of secondary data should Tommy Hilfiger consult to keep informed about apparel fashion trends? 2. What sources of syndicated data would be useful? 3. Discuss the role of the type of research you recommend in enabling Fred Gehring and Tommy Hilfiger to keep abreast of apparel fashion trends. The Marketing Management Decision 1. In order to enhance the appeal of Tommy Hilfiger clothing to the fashion-conscious consumer, what marketing actions should Fred Gehring take? 2. Discuss how the marketing management decision action that you recommend to Fred Gehring is influenced by the secondary sources of data that you suggested earlier and by the content of information they provide.44 ▪ Marketing research enables Tommy Hilfiger to keep abreast of apparel fashion trends and the changing preferences of its target market. of expensive primary data, when the research problem can be addressed based on secondary data alone, may be unethical. These ethical issues become more salient if the research firm’s billings go up, but at the expense of the client.
  33. 130 PART II • RESEARCH DESIGN FORMULATION Step 1: Problem

    Definition Step 2: Approach to the Problem Step 3: Research Design Secondary Data Internal External Primary Data Data Mining Customer Relationship Management Database Marketing Published Materials Computerized Databases Syndicated Services guides guides involves involves may be may be consist of consist of consist of consist of FIGURE 4.6 A Concept Map for Secondary Data Summary In contrast to primary data, which originate with the researcher for the specific purpose of the problem at hand, secondary data are data originally collected for other purposes. Secondary data can be obtained quickly and are relatively inexpensive. However, they have limitations and should be carefully evalu- ated to determine their appropriateness for the problem at hand. The evaluation criteria consist of specifications, error, currency, objectivity, nature, and dependability. A wealth of information exists in the organization for which the research is being conducted. This information constitutes internal secondary data. External data are generated by sources outside the organization. These data exist in the form of published (printed) material, online, Internet, and offline databases, or information made available by syndicated services. Published external sources may be broadly classified as general business data or government data. General business sources comprise guides, directories, indexes, and statistical data. Government sources may be broadly categorized as cen- sus data and other data. Computerized databases may be online, Internet, or offline. These databases may be further classified as bibliographic, numeric, full-text, directory, or specialized databases. Figure 4.6 is a concept map for secondary data. Syndicated services or sources are companies that collect and sell common pools of data designed to serve a number of clients. Syndicated services can be classified based on the unit of measurement (households/consumers or institutions). Household/consumer data may be obtained via surveys, pur- chase and media panels, or electronic scanner services. When SPSS Windows SPSS Maps integrates seamlessly with SPSS base menus, enabling you to map a variety of data. You can choose from six base thematic maps, or create other maps by combining map options. Maps can be further customized using the SPSS Syntax Editor. Such maps can be used for a variety of purposes, including interpreting sales and other data geographically to determine where the biggest customers are located, displaying sales trends for specific geographic loca- tions, using buying trend information to determine the ideal location for new company stores, and so on.
  34. CHAPTER 4 • EXPLORATORY RESEARCH DESIGN: SECONDARY DATA 131 Key

    Terms and Concepts primary data, 100 secondary data, 100 internal data, 105 external data, 105 database marketing, 106 online databases, 111 Internet databases, 111 offline databases, 111 bibliographic databases, 112 numeric databases, 112 full-text databases, 112 directory databases, 112 special-purpose databases, 113 syndicated services (sources), 113 surveys, 113 syndicated panel surveys, 114 psychographics, 114 lifestyles, 114 purchase panels, 118 media panels, 119 scanner data, 121 volume tracking data, 121 scanner panels, 121 scanner panels with cable TV, 121 audit, 122 industry services, 124 single-source data, 124 computer mapping, 125 Syndicated Data Households/Consumers Institutions Surveys Panels General Retailers Wholesalers Industrial Firms/Organizations Electronic Scanners Volume Tracking Scanner Panels Psychographics & Lifestyles Advertising Evaluation Scanner Panels with Cable TV unit of measurement may be unit of measurement Collected via Collected via Media Purchase may be Collected via may be may be FIGURE 4.7 A Concept Map for Syndicated Data Suggested Cases, Video Cases, and HBS Cases Running Case with Real Data 1.1 Dell Comprehensive Critical Thinking Cases 2.1 American Idol 2.2 Baskin-Robbins 2.3 Akron Children’s Hospital Comprehensive Cases with Real Data 4.1 JPMorgan Chase 4.2 Wendy’s institutions are the unit of measurement, the data may be obtained from retailers, wholesalers, or industrial firms. It is desirable to combine information obtained from different secondary sources. Figure 4.7 is a concept map for syndicated data. There are several specialized sources of secondary data useful for conducting international marketing research. However, the evaluation of secondary data becomes even more critical as the usefulness and accuracy of these data can vary widely. Ethical dilemmas that can arise include the unneces- sary collection of primary data, the use of only secondary data when primary data are needed, the use of secondary data that are not applicable, and the use of secondary data that have been gathered through morally questionable means.
  35. 132 PART II • RESEARCH DESIGN FORMULATION Live Research: Conducting

    a Marketing Research Project 1. Assign one or more teams the responsibility of collecting and analyzing secondary data, including those available on the Internet. 2. For example, one team could search the library’s electronic database, another could search government sources, and another team could visit the library and work with a reference librarian to identify the relevant sources. 3. It is worthwhile to visit the Web sites of syndicated firms to identify the relevant information, some of which can be obtained without cost. 4. If the project is supported by a budget, then relevant informa- tion can be purchased from syndicated sources. Acronym The criteria used for evaluating secondary data may be described by the acronym Second: S pecifications: methodology used to collect the data E rror: accuracy of the data C urrency: when the data were collected O bjective: purpose for which data were collected N ature: content of the data D ependability: overall, how dependable are the data Exercises Questions 1. What are the differences between primary and secondary data? 2. Why is it important to obtain secondary data before primary data? 3. Differentiate between internal and external secondary data. 4. What are the advantages of secondary data? 5. What are the disadvantages of secondary data? 6. What are the criteria to be used when evaluating secondary data? 7. List the various sources of published secondary data. 8. What are the different forms of computerized databases? 9. What are the advantages of computerized databases? 10. List and describe the various syndicated sources of secondary data. 11. What is the nature of information collected by surveys? 12. How can surveys be classified? 13. Explain what a panel is. What is the difference between purchase panels and media panels? 14. What are relative advantages of purchase and media panels over surveys? 15. What kinds of data can be gathered through electronic scanner services? 16. Describe the uses of scanner data. 17. What is an audit? Discuss the uses, advantages, and disadvantages of audits. 18. Describe the information provided by industrial services. 19. Why is it desirable to use multiple sources of secondary data? Problems 1. Obtain automobile industry sales and sales of major automo- bile manufacturers for the last five years from secondary sources. (Hint: See Chapter 23, Table 23.1). 2. Select an industry of your choice. Using secondary sources, obtain industry sales and the sales of the major firms in that industry for the past year. Estimate the market shares of each major firm. From another source, obtain information on the market shares of these same firms. Do the two estimates agree? Video Cases 4.1 Mayo Clinic 7.1 AFLAC 8.1 P&G 9.1 eGO 12.1 Subaru 13.1 Intel 23.1 Marriott 24.1 Nivea Comprehensive Harvard Business School Cases Case 5.1: The Harvard Graduate Student Housing Survey (9-505-059) Case 5.2: BizRate.Com (9-501-024) Case 5.3: Cola Wars Continue: Coke and Pepsi in the Twenty-First Century (9-702-442) Case 5.4: TiVo in 2002 (9-502-062) Case 5.5: Compaq Computer: Intel Inside? (9-599-061) Case 5.6: The New Beetle (9-501-023)
  36. CHAPTER 4 • EXPLORATORY RESEARCH DESIGN: SECONDARY DATA 133 Internet

    and Computer Exercises 1. Conduct an online data search to obtain background information on an industry of your choice (e.g., sporting goods). Your search should encompass both qualitative and quantitative information. 2. Visit the Web site of a company of your choice. Suppose the management decision problem facing this company was to expand its share of the market. Obtain as much secondary data from the Web site of this company and other sources on the Internet as are relevant to this problem. 3. Visit the Web site of the Bureau of Census (see one of the URLs given in the book). Write a report about the secondary data available from the Bureau that would be useful to a fast- food firm such as McDonald’s for the purpose of formulating domestic marketing strategy. 4. Visit www.census.gov/statab. Use State Rankings and Vital Statistics to identify the top six states for marketing products to the elderly. 5. For the department store patronage project, Sears would like you to summarize the retail sales in the United States by visiting www.census.gov. 6. Visit www.npd.com and write a description of the panels main- tained by NPD. 7. Visit www.nielsen.com and write a report about the various services offered by Nielsen. Activities Role Playing 1. You are the marketing research manager of a local bank. Management has asked you to assess the demand potential for checking accounts in your metropolitan area. What sources of secondary data should you consult? What kind of information would you expect to obtain from each source? Ask a group of fellow students to play the role of management and explain to them the role of secondary data in this project. 2. You are the group product manager for Procter & Gamble in charge of laundry detergents. How would you make use of information available from a store audit? Ask another student to play the role of vice president of marketing. Explain to your boss the value of store audit information related to laundry detergents. Fieldwork 1. Make a trip to your local library. Write a report explaining how you would use the library to collect secondary data for a mar- keting research project assessing the demand potential for Cross soft-tip pens. Please be specific. Group Discussion 1. Discuss the significance and limitations of the government census data as a major source of secondary data. 2. Discuss the growing use of computerized databases. 3. Discuss how the Nielsen TV ratings can affect the price advertisers pay for a commercial broadcast during a particular time. Dell Running Case Review the Dell case, Case 1.1, and questionnaire given toward the end of the book. Answer the following questions. 1. Search the Internet to find information on the latest U.S. mar- ket share of Dell and other PC marketers. 2. Search the Internet to obtain information on Dell’s marketing strategy. Do you agree with Dell’s marketing strategy? Why or why not? 3. Visit the U.S. Census Bureau at www.census.gov. As Dell seeks to increase its penetration of U.S. households, what information available from the U.S. Census Bureau is helpful? 4. What information available from syndicated firms would be useful to Dell as it seeks to increase its penetration of U.S. households? 5. How can Dell make use of lifestyle information available from syndicated services? 6. What information is available on consumer technology usage from syndicated firms? How can Dell make use of this infor- mation? Hint: Visit www.npd.com, and under “Industries” select “Consumer Technology.” 7. What information available from www.nielsen-online.com can help Dell evaluate the effectiveness of its Web site?
  37. Cases Cases Video 134 VIDEO CASE 4.1 The Mayo Clinic:

    Staying Healthy with Marketing Research William and Charles Mayo began practicing medicine in the 1880s in Rochester, Minnesota. They were quickly recognized as extremely talented surgeons, and they gained so many patients that they were forced to think about expanding their practice. Around the turn of the century, the Mayo brothers began inviting others to join their practice. The partnerships that the Mayos entered into created one of the first private group practices of medicine in the United States. In 1919, the Mayo brothers turned their partnership into a not-for-profit, charitable organization known as the Mayo Foundation. All proceeds beyond operating expenses were to be contributed to education, research, and patient care. The Mayo Clinic (www.mayoclinic.org) has been operating in this fashion ever since. The Mayo Clinic’s primary value is, “The needs of the patient come first.” Its mission is, “Mayo will provide the best care to every patient every day through integrated clinical practice, education, and research.” As of 2008, more than 3,300 physicians and scientists and more than 52,000 allied health staff worked at the original Mayo Clinic in Rochester and newer clinics in Jacksonville, Florida, and Phoenix/Scottsdale, Arizona. Collectively, the three clinics treat more than half a million people each year. Philanthropy is a big part of the Mayo Clinic. From the Mayos’ donations in 1919, philanthropy has been deeply rooted in the Mayo Clinic’s operations. In 2006, 87,000 donors provided $230 million in contribu- tions, private grants, and endowments. These donations are used heavily in research and education, and Mayo’s capital expansion depends on these investments. Total revenues for 2006 were $6.29 billion, up from $5.81 billion in 2005. Net income from current activities was $117.4 million, down from $195.9 million in 2005. Patient care is the largest form of revenue, bringing in $5.3 billion in 2006. The Mayo Clinic continues to donate huge amounts of money to education and research. In 2006, Mayo contributed $314 million to research and education. The majority of its business is brought in because of the positive experiences that patients have at the Mayo Clinic. This is a result of the care the Mayo Clinic provides as well as the environment it has created. Collaboration throughout the Mayo Clinic has resulted in excellent care, better methods, and innovation, while also being mindful of the environment in which the care takes place. Marketing research revealed that the clinic environment is an important part of the patient’s experience. Therefore, Mayo breaks the mold of a plain, static look with the addition of soothing music and elaborate art, believing that this adds to the patients’ experience and helps them to heal faster. Over the years, the Mayo Clinic has become a name that the public trusts despite the lack of any advertising. It has a strong reputation as a research center, a specialty care provider, and a school of medicine. Explaining the Mayo Clinic’s success and how it became the top choice for people in need of care, John la Forgia, chair of the Department of Public Affairs at the Mayo Clinic, says that a key differentiator for the Mayo Clinic is its ability to diagnose and treat ailments that other clinics and doctors cannot; the patient then goes home and tells others his or her story, creating immense goodwill and word-of-mouth publicity for the Mayo Clinic. What helps Mayo achieve strong brand recognition is its emphasis on marketing research. A significant portion of marketing research is devoted to brand management. Marketing research is used to continuously monitor consumer perceptions and evaluations of the Mayo Clinic. According to John la Forgia, the Mayo Clinic’s Office of Brand Management serves two basic functions. The first is operating as a clearinghouse for external perceptions. The second is to provide physicians with an understanding of the brand as they branch out into new areas. A brand-equity research project found that the Mayo Clinic was considered to be the best practice in the country. It also found that 84 percent of the public is aware of the Mayo Clinic, and that they associate words such as excellence, care, and compassion with it. The other part of its strategy is the enhancement of the brand. To accomplish this, the Mayo Clinic relies on market- ing research to monitor the perceptions of its patients, the public, donors, the medical staff, and other constituencies.
  38. CHAPTER 4 • EXPLORATORY RESEARCH DESIGN: SECONDARY DATA 135 A

    recent marketing research study revealed that consumers’ choice of a health care organization is determined by their evaluation of the alternative health care organizations on the following salient attributes: (1) doctors, (2) medical technol- ogy, (3) nursing care, (4) physical facilities, (5) manage- ment, and (6) ethics. Since then, the Mayo Clinic has sought to emphasize these factors. In the service industry, the onus of maintaining a good reputation and name depends largely on the way the ser- vice is delivered. Thus, it is most important for Mayo to keep delivering the product and not lose sight of the fact that Mayo is a health care provider and all of the brand equity it has in the minds of Americans depends on its continued delivery of excellent health care. Mayo Clinic marketers say that keeping the brand strong well into the future will depend primarily upon patients’ day-to-day experiences, which can be enhanced by marketing research identifying patient needs and developing medical programs to meet those needs. Conclusion Through an unflinching focus on patient care, cutting-edge research in medical science, and reliance on marketing research, the Mayo Clinic has been able to carve a special place for itself in the hearts and minds of people and build a strong brand. Questions 1. The Mayo Clinic would like to further strengthen their brand image and equity. Define the management decision problem. 2. Define the marketing research problem corresponding to the management decision problem you have defined in question 1. 3. What type of research design should be adopted? Why? 4. Describe the sources of secondary data that would be help- ful in determining consumer preferences for health care facilities. References 1. www.mayoclinic.org, accessed February 20, 2009. 2. www.wikipedia.org, accessed February 20, 2009. 3. Misty Hathaway and Kent Seltman, “International Market Research at the Mayo Clinic,” Marketing Health Services (Winter 2001): 19. 4. Daniel Fell, “Taking U.S. Health Services Overseas,” Marketing Health Services (Summer 2002): 21.