Upgrade to Pro
— share decks privately, control downloads, hide ads and more …
Speaker Deck
Features
Speaker Deck
PRO
Sign in
Sign up for free
Search
Search
Nine months of food
Search
Lars Yencken
October 17, 2013
310
0
Share
Embed
Copy iframe code
Copy JS code
Copy link
Start on current slide
Nine months of food
A talk I gave on food tracking to the Melbourne Quantified Self Meetup.
Lars Yencken
October 17, 2013
More Decks by Lars Yencken
See All by Lars Yencken
Linguistics, a whirlwind tour!
larsyencken
0
69
Pycon 2014 Recap
larsyencken
0
76
The Great Language Game
larsyencken
0
360
Automation for web development
larsyencken
0
160
Scaling a web stack
larsyencken
4
210
Similarity metrics for Japanese kanji
larsyencken
0
94
Featured
See All Featured
How to make the Groovebox
asonas
2
2.3k
New Earth Scene 8
popppiees
3
2.4k
DevOps and Value Stream Thinking: Enabling flow, efficiency and business value
helenjbeal
1
260
Helping Users Find Their Own Way: Creating Modern Search Experiences
danielanewman
31
3.3k
SEO in 2025: How to Prepare for the Future of Search
ipullrank
3
3.6k
個人開発の失敗を避けるイケてる考え方 / tips for indie hackers
panda_program
123
22k
Statistics for Hackers
jakevdp
799
230k
How Software Deployment tools have changed in the past 20 years
geshan
0
34k
Why Our Code Smells
bkeepers
PRO
340
58k
WENDY [Excerpt]
tessaabrams
11
38k
Building AI with AI
inesmontani
PRO
1
1.1k
A designer walks into a library…
pauljervisheath
211
24k
Transcript
. . . .. . . . .. . .
. .. . . . . .. . . . .. . . . .. . . . .. . . . . .. . . . .. . . . .. . . . .. . . . . .. . . . .. . . . .. . . . .. . . . . .. . . . .. . . . . .. . . . .. . . . .. . Nine months of food Lars Yencken Melbourne Quantified Self Meetup 17th October 2013
. . . .. . . . .. . .
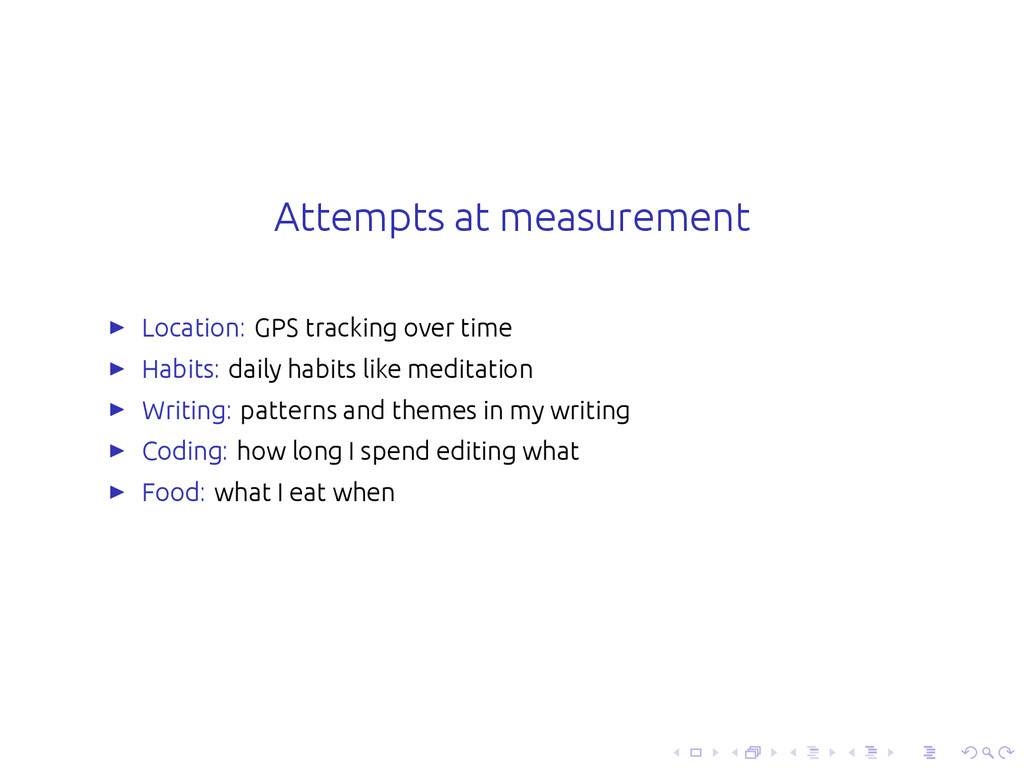
. .. . . . . .. . . . .. . . . .. . . . .. . . . . .. . . . .. . . . .. . . . .. . . . . .. . . . .. . . . .. . . . .. . . . . .. . . . .. . . . . .. . . . .. . . . .. . Attempts at measurement ▶ Location: GPS tracking over time ▶ Habits: daily habits like meditation ▶ Writing: patterns and themes in my writing ▶ Coding: how long I spend editing what ▶ Food: what I eat when
. . . .. . . . .. . .
. .. . . . . .. . . . .. . . . .. . . . .. . . . . .. . . . .. . . . .. . . . .. . . . . .. . . . .. . . . .. . . . .. . . . . .. . . . .. . . . . .. . . . .. . . . .. . Earlier this year... ▶ Overweight at 94 kg ▶ In at-risk category for diabetes ▶ Active-ish, but not fit ▶ Long hours of computer work
. . . .. . . . .. . .
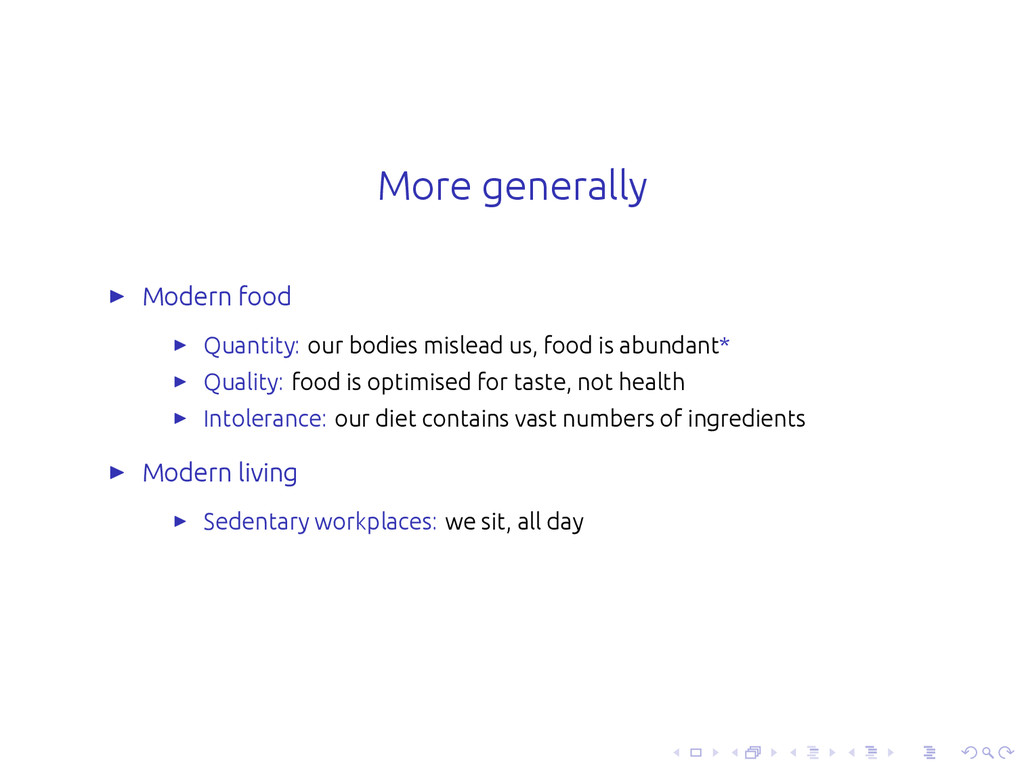
. .. . . . . .. . . . .. . . . .. . . . .. . . . . .. . . . .. . . . .. . . . .. . . . . .. . . . .. . . . .. . . . .. . . . . .. . . . .. . . . . .. . . . .. . . . .. . More generally ▶ Modern food ▶ Quantity: our bodies mislead us, food is abundant* ▶ Quality: food is optimised for taste, not health ▶ Intolerance: our diet contains vast numbers of ingredients ▶ Modern living ▶ Sedentary workplaces: we sit, all day
. . . .. . . . .. . .
. .. . . . . .. . . . .. . . . .. . . . .. . . . . .. . . . .. . . . .. . . . .. . . . . .. . . . .. . . . .. . . . .. . . . . .. . . . .. . . . . .. . . . .. . . . .. . My weight Historic range 87-105 kg Jan 2013 94 kg
. . . .. . . . .. . .
. .. . . . . .. . . . .. . . . .. . . . .. . . . . .. . . . .. . . . .. . . . .. . . . . .. . . . .. . . . .. . . . .. . . . . .. . . . .. . . . . .. . . . .. . . . .. . My weight Historic range 87-105 kg Jan 2013 94 kg Target (bet) 85 kg
. . . .. . . . .. . .
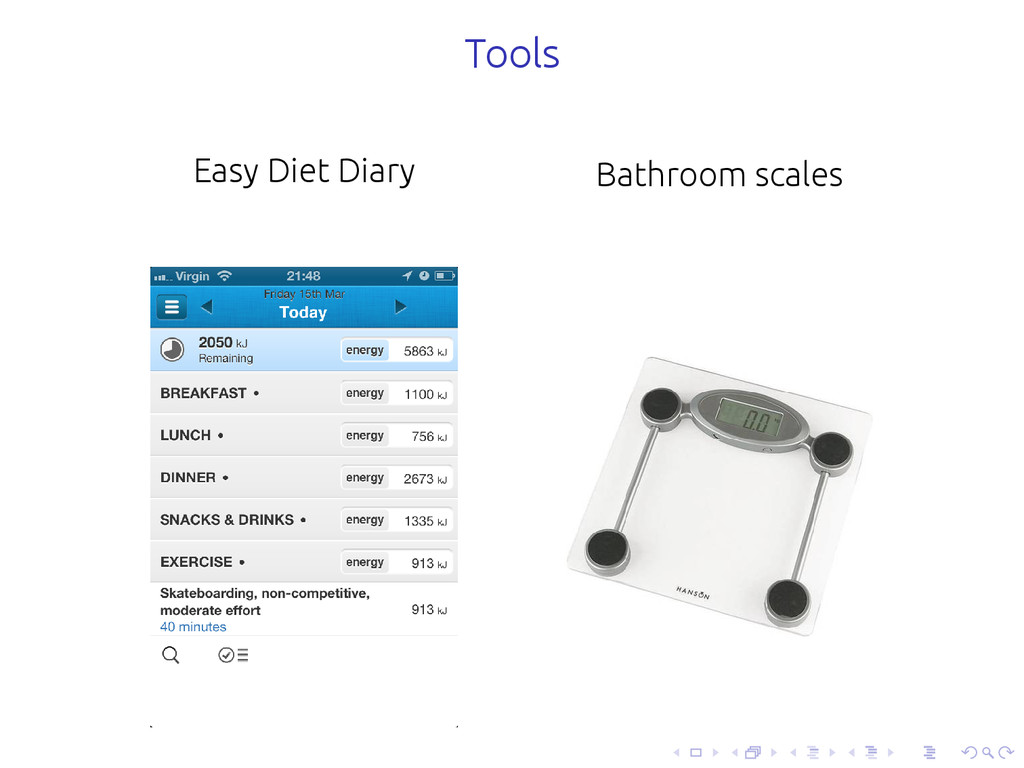
. .. . . . . .. . . . .. . . . .. . . . .. . . . . .. . . . .. . . . .. . . . .. . . . . .. . . . .. . . . .. . . . .. . . . . .. . . . .. . . . . .. . . . .. . . . .. . Tools Easy Diet Diary Bathroom scales
. . . .. . . . .. . .
. .. . . . . .. . . . .. . . . .. . . . .. . . . . .. . . . .. . . . .. . . . .. . . . . .. . . . .. . . . .. . . . .. . . . . .. . . . .. . . . . .. . . . .. . . . .. . Binges?
. . . .. . . . .. . .
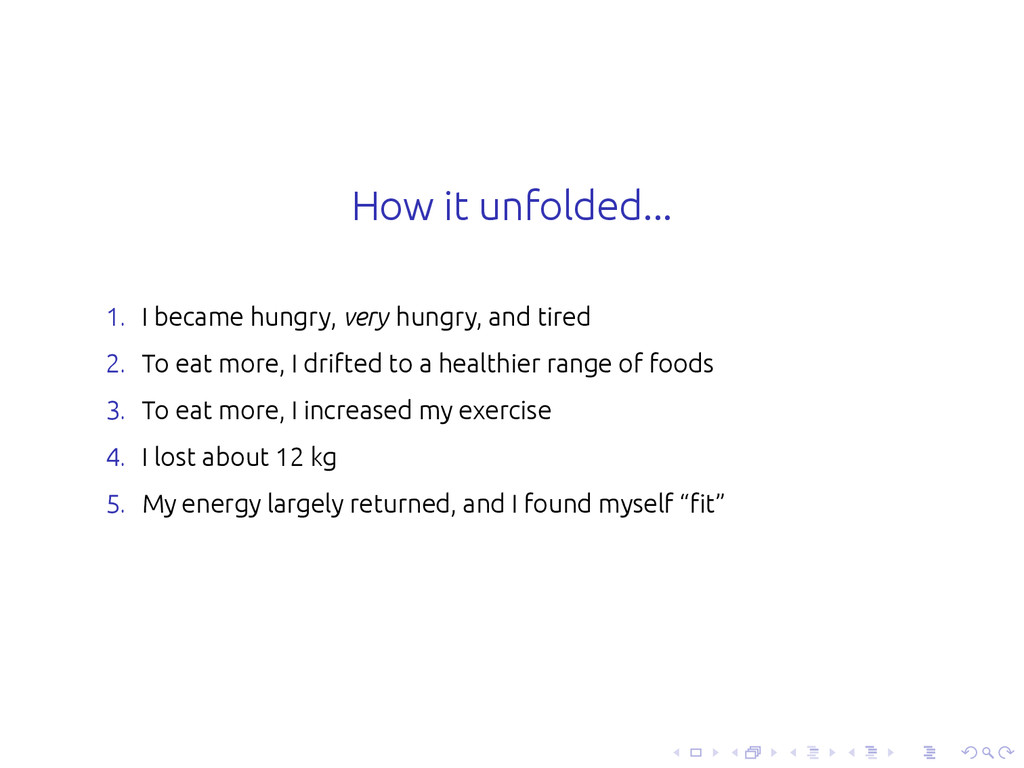
. .. . . . . .. . . . .. . . . .. . . . .. . . . . .. . . . .. . . . .. . . . .. . . . . .. . . . .. . . . .. . . . .. . . . . .. . . . .. . . . . .. . . . .. . . . .. . How it unfolded... 1. I became hungry, very hungry, and tired 2. To eat more, I drifted to a healthier range of foods 3. To eat more, I increased my exercise 4. I lost about 12 kg 5. My energy largely returned, and I found myself “fit”
. . . .. . . . .. . .
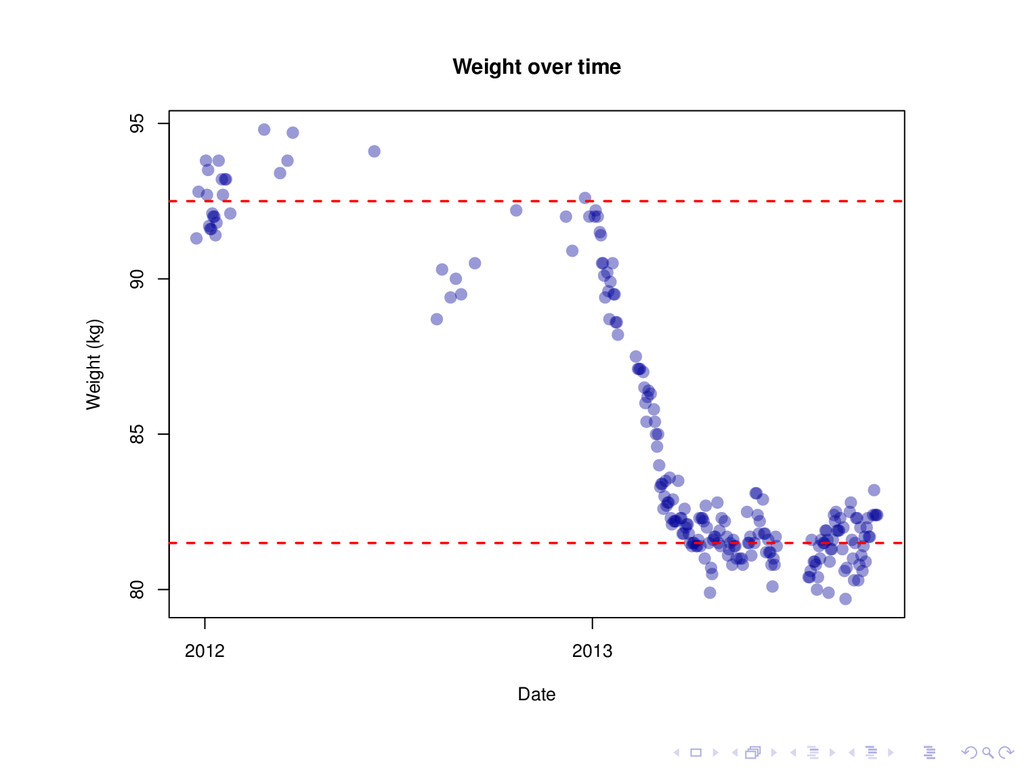
. .. . . . . .. . . . .. . . . .. . . . .. . . . . .. . . . .. . . . .. . . . .. . . . . .. . . . .. . . . .. . . . .. . . . . .. . . . .. . . . . .. . . . .. . . . .. . 2012 2013 80 85 90 95 Weight over time Date Weight (kg)
. . . .. . . . .. . .
. .. . . . . .. . . . .. . . . .. . . . .. . . . . .. . . . .. . . . .. . . . .. . . . . .. . . . .. . . . .. . . . .. . . . . .. . . . .. . . . . .. . . . .. . . . .. . Dataset
. . . .. . . . .. . .
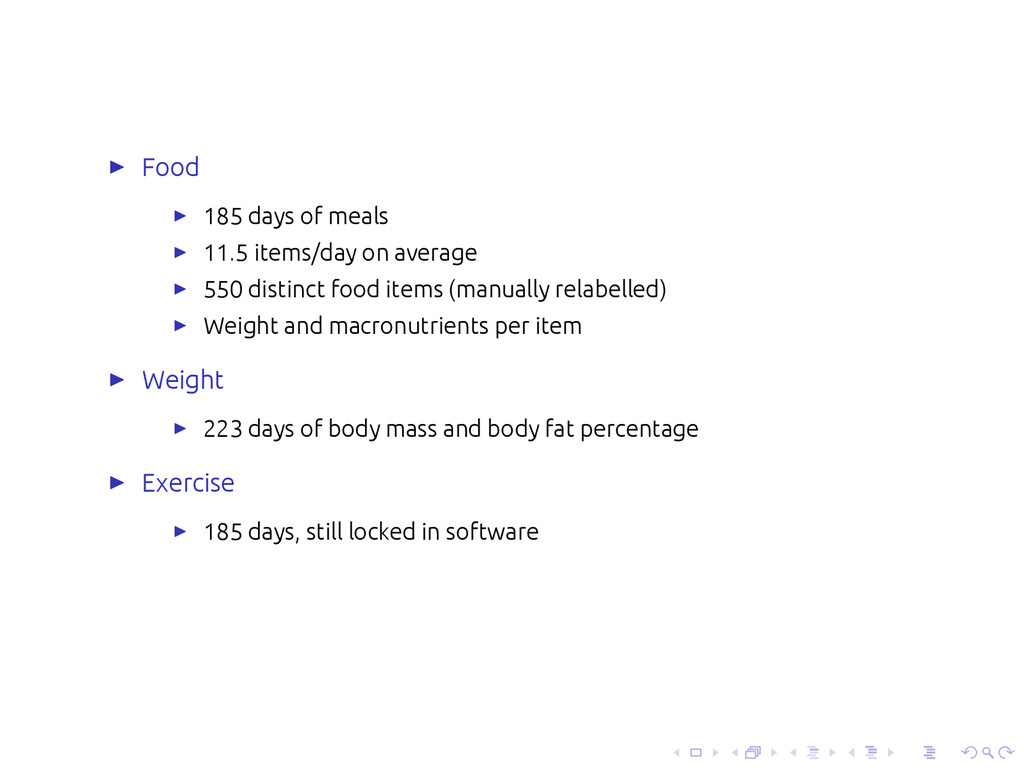
. .. . . . . .. . . . .. . . . .. . . . .. . . . . .. . . . .. . . . .. . . . .. . . . . .. . . . .. . . . .. . . . .. . . . . .. . . . .. . . . . .. . . . .. . . . .. . ▶ Food ▶ 185 days of meals ▶ 11.5 items/day on average ▶ 550 distinct food items (manually relabelled) ▶ Weight and macronutrients per item ▶ Weight ▶ 223 days of body mass and body fat percentage ▶ Exercise ▶ 185 days, still locked in software
. . . .. . . . .. . .
. .. . . . . .. . . . .. . . . .. . . . .. . . . . .. . . . .. . . . .. . . . .. . . . . .. . . . .. . . . .. . . . .. . . . . .. . . . .. . . . . .. . . . .. . . . .. . What did I eat?
. . . .. . . . .. . .
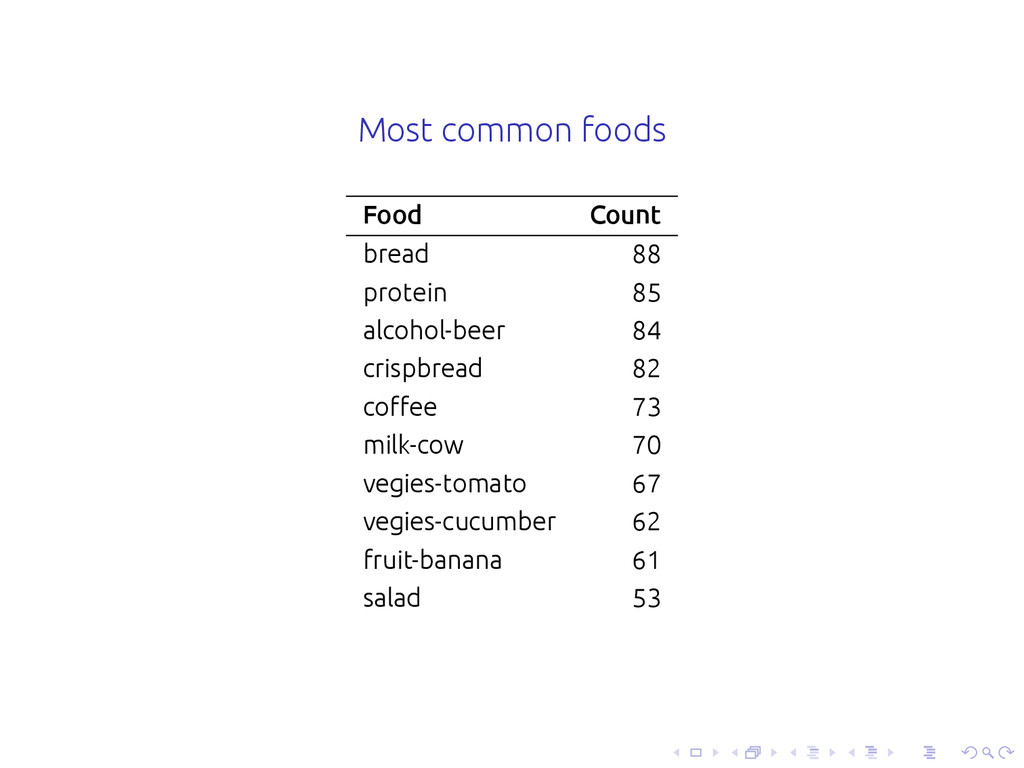
. .. . . . . .. . . . .. . . . .. . . . .. . . . . .. . . . .. . . . .. . . . .. . . . . .. . . . .. . . . .. . . . .. . . . . .. . . . .. . . . . .. . . . .. . . . .. . Most common foods Food Count bread 88 protein 85 alcohol-beer 84 crispbread 82 coffee 73 milk-cow 70 vegies-tomato 67 vegies-cucumber 62 fruit-banana 61 salad 53
. . . .. . . . .. . .
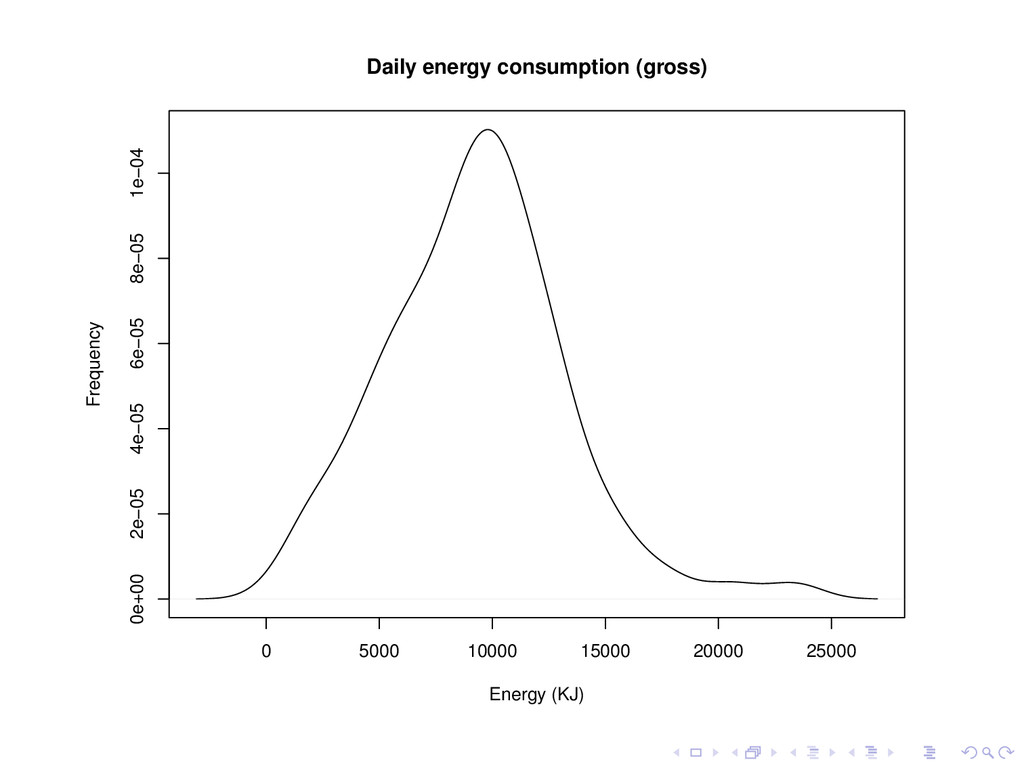
. .. . . . . .. . . . .. . . . .. . . . .. . . . . .. . . . .. . . . .. . . . .. . . . . .. . . . .. . . . .. . . . .. . . . . .. . . . .. . . . . .. . . . .. . . . .. . How much do I eat?
. . . .. . . . .. . .
. .. . . . . .. . . . .. . . . .. . . . .. . . . . .. . . . .. . . . .. . . . .. . . . . .. . . . .. . . . .. . . . .. . . . . .. . . . .. . . . . .. . . . .. . . . .. . 0 5000 10000 15000 20000 25000 0e+00 2e−05 4e−05 6e−05 8e−05 1e−04 Daily energy consumption (gross) Energy (KJ) Frequency
. . . .. . . . .. . .
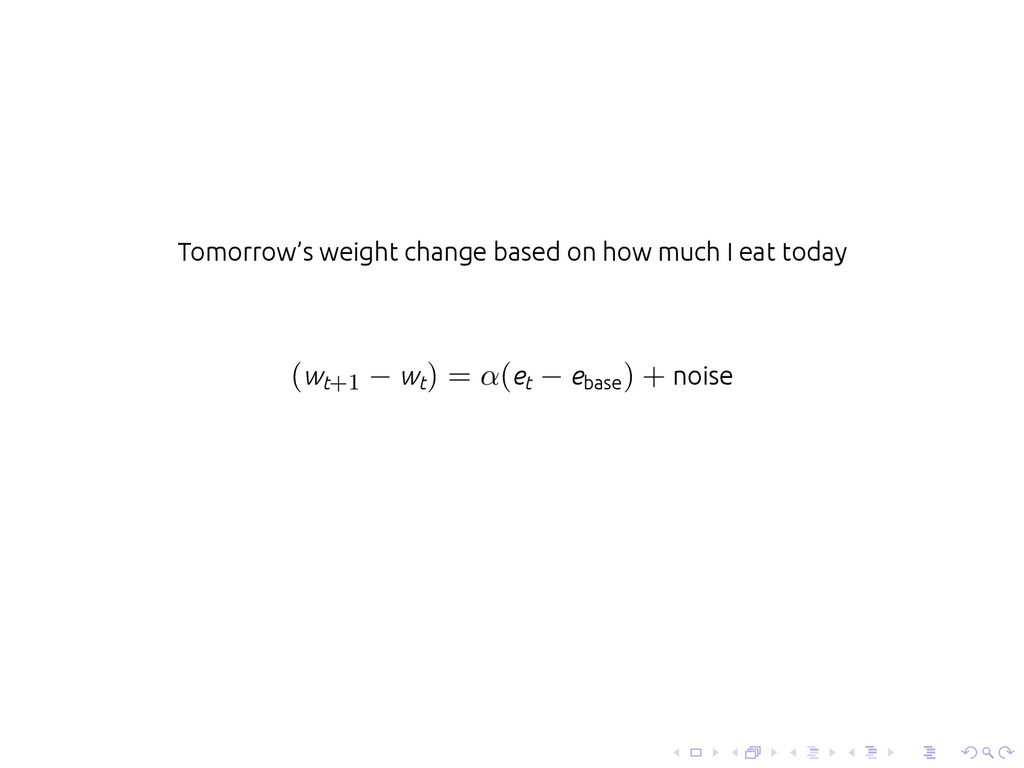
. .. . . . . .. . . . .. . . . .. . . . .. . . . . .. . . . .. . . . .. . . . .. . . . . .. . . . .. . . . .. . . . .. . . . . .. . . . .. . . . . .. . . . .. . . . .. . How much can I eat?
. . . .. . . . .. . .
. .. . . . . .. . . . .. . . . .. . . . .. . . . . .. . . . .. . . . .. . . . .. . . . . .. . . . .. . . . .. . . . .. . . . . .. . . . .. . . . . .. . . . .. . . . .. . Tomorrow’s weight change based on how much I eat today (wt+1 − wt ) = α(et − ebase ) + noise
. . . .. . . . .. . .
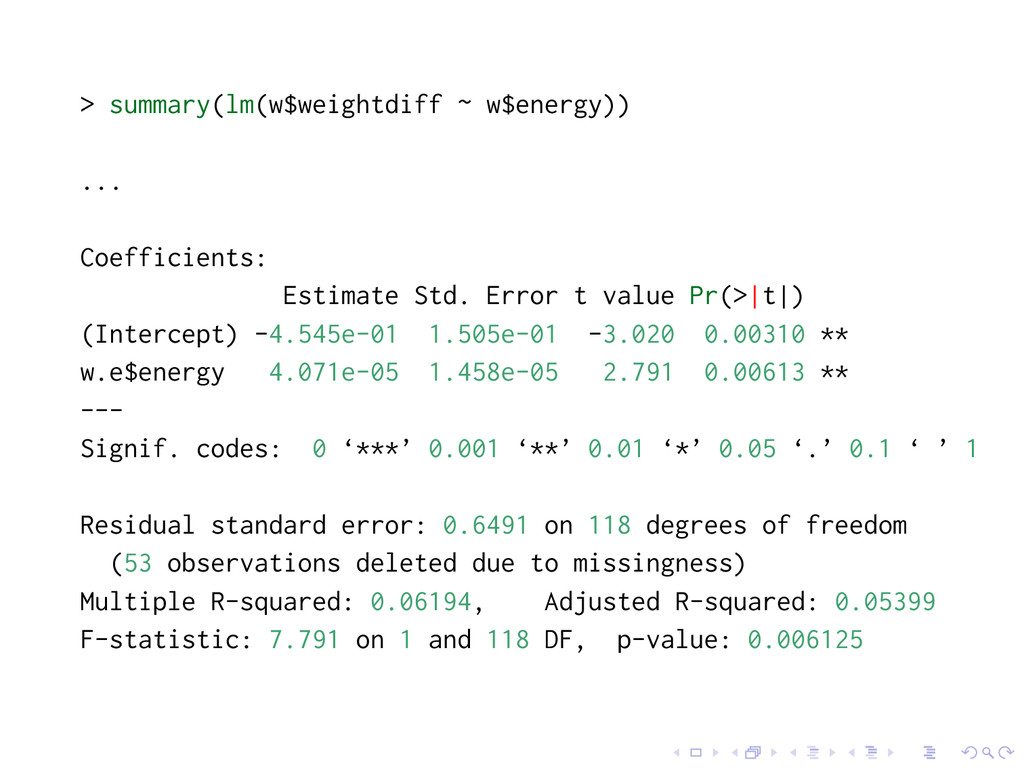
. .. . . . . .. . . . .. . . . .. . . . .. . . . . .. . . . .. . . . .. . . . .. . . . . .. . . . .. . . . .. . . . .. . . . . .. . . . .. . . . . .. . . . .. . . . .. . > summary(lm(w$weightdiff ~ w$energy)) ... Coefficients: Estimate Std. Error t value Pr(>|t|) (Intercept) -4.545e-01 1.505e-01 -3.020 0.00310 ** w.e$energy 4.071e-05 1.458e-05 2.791 0.00613 ** --- Signif. codes: 0 ‘***’ 0.001 ‘**’ 0.01 ‘*’ 0.05 ‘.’ 0.1 ‘ ’ 1 Residual standard error: 0.6491 on 118 degrees of freedom (53 observations deleted due to missingness) Multiple R-squared: 0.06194, Adjusted R-squared: 0.05399 F-statistic: 7.791 on 1 and 118 DF, p-value: 0.006125
. . . .. . . . .. . .
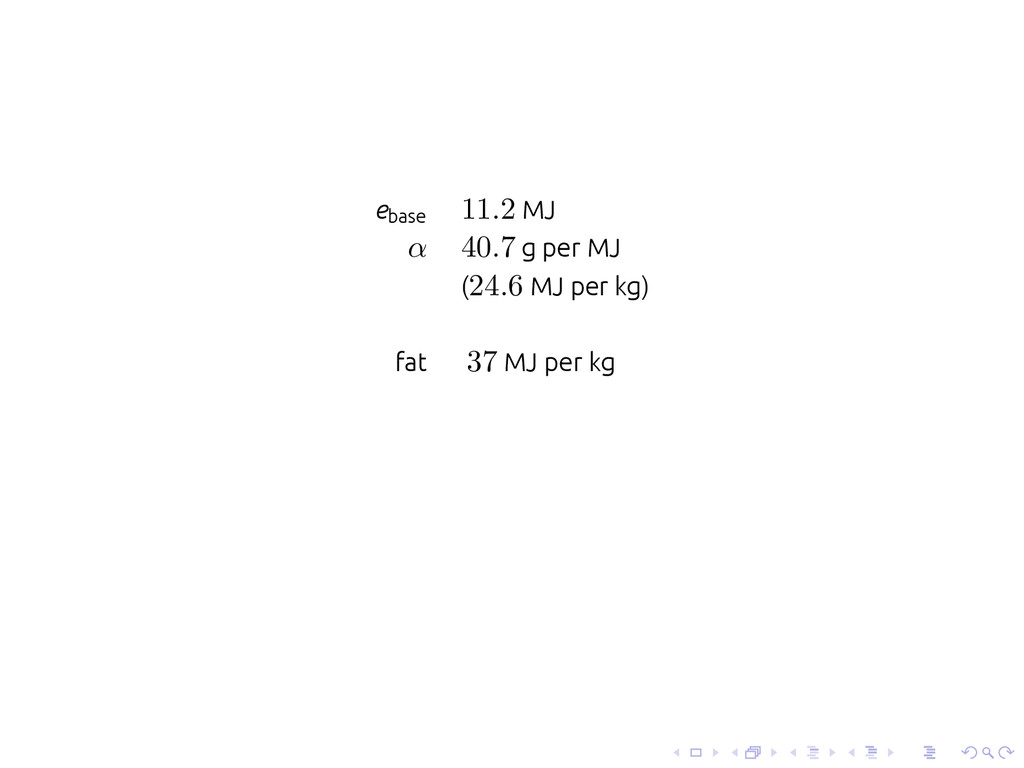
. .. . . . . .. . . . .. . . . .. . . . .. . . . . .. . . . .. . . . .. . . . .. . . . . .. . . . .. . . . .. . . . .. . . . . .. . . . .. . . . . .. . . . .. . . . .. . ebase 11.2 MJ α 40.7 g per MJ (24.6 MJ per kg) fat 37 MJ per kg
. . . .. . . . .. . .
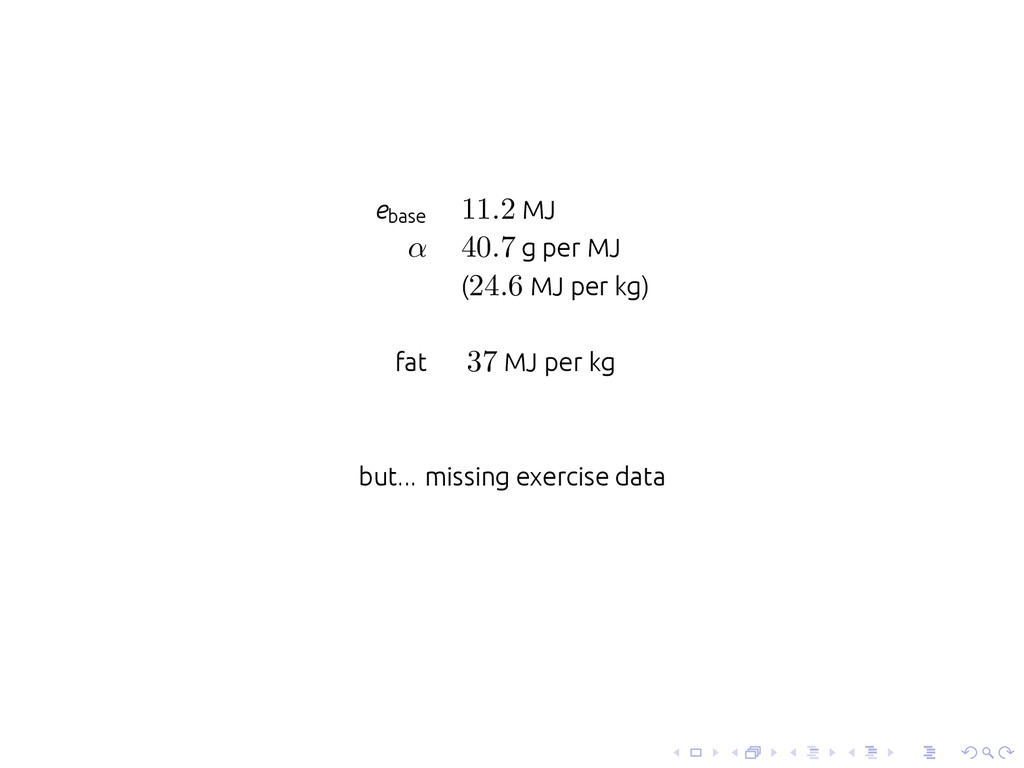
. .. . . . . .. . . . .. . . . .. . . . .. . . . . .. . . . .. . . . .. . . . .. . . . . .. . . . .. . . . .. . . . .. . . . . .. . . . .. . . . . .. . . . .. . . . .. . ebase 11.2 MJ α 40.7 g per MJ (24.6 MJ per kg) fat 37 MJ per kg but... missing exercise data
. . . .. . . . .. . .
. .. . . . . .. . . . .. . . . .. . . . .. . . . . .. . . . .. . . . .. . . . .. . . . . .. . . . .. . . . .. . . . .. . . . . .. . . . .. . . . . .. . . . .. . . . .. . Do large breakfasts help?
. . . .. . . . .. . .
. .. . . . . .. . . . .. . . . .. . . . .. . . . . .. . . . .. . . . .. . . . .. . . . . .. . . . .. . . . .. . . . .. . . . . .. . . . .. . . . . .. . . . .. . . . .. . 0 2000 4000 6000 8000 0 5000 10000 15000 20000 Breakfast vs rest of day Breakfast (kJ) Rest of day (kJ)
. . . .. . . . .. . .
. .. . . . . .. . . . .. . . . .. . . . .. . . . . .. . . . .. . . . .. . . . .. . . . . .. . . . .. . . . .. . . . .. . . . . .. . . . .. . . . . .. . . . .. . . . .. . How much meat do I eat?
. . . .. . . . .. . .
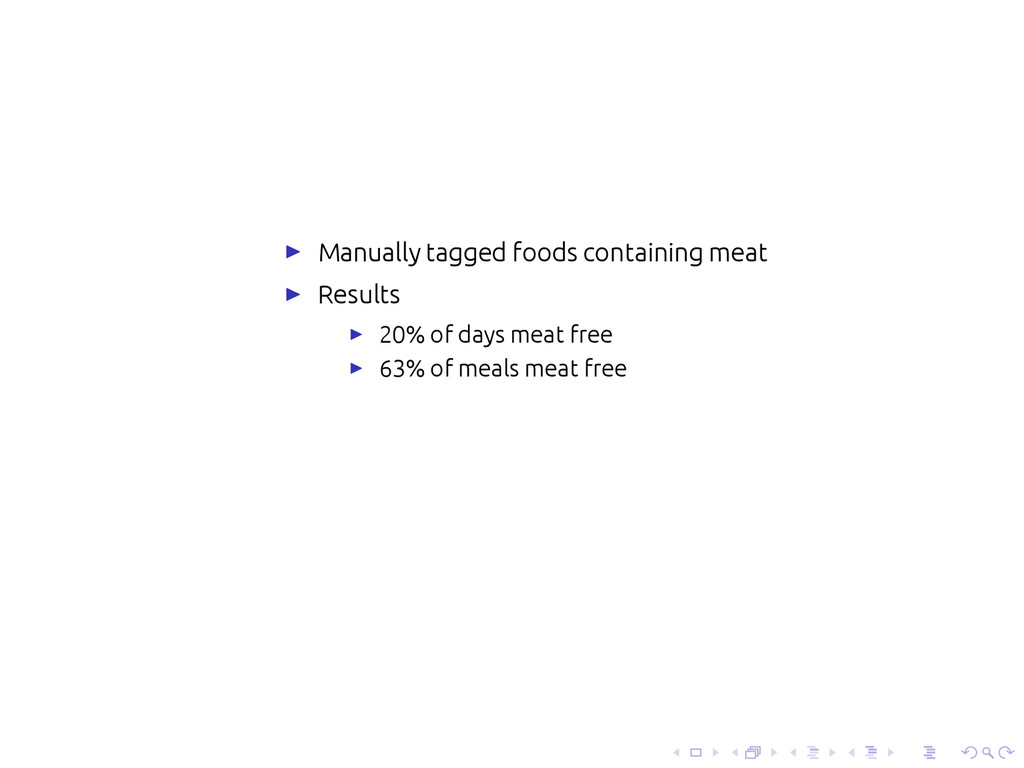
. .. . . . . .. . . . .. . . . .. . . . .. . . . . .. . . . .. . . . .. . . . .. . . . . .. . . . .. . . . .. . . . .. . . . . .. . . . .. . . . . .. . . . .. . . . .. . ▶ Manually tagged foods containing meat ▶ Results ▶ 20% of days meat free ▶ 63% of meals meat free
. . . .. . . . .. . .
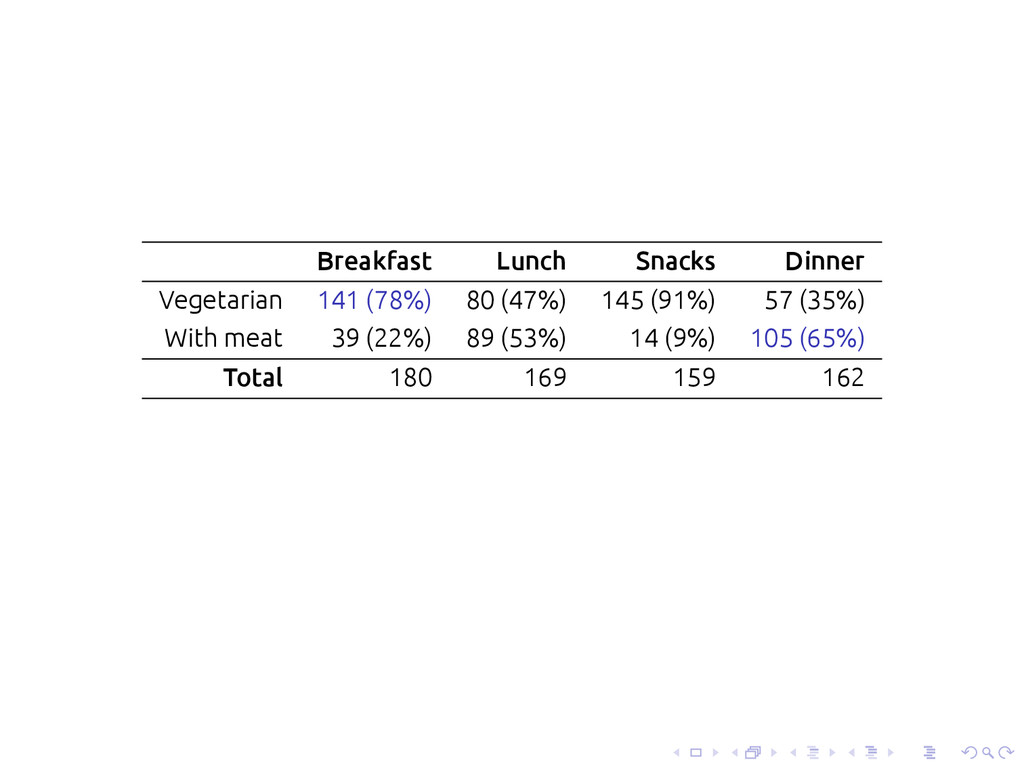
. .. . . . . .. . . . .. . . . .. . . . .. . . . . .. . . . .. . . . .. . . . .. . . . . .. . . . .. . . . .. . . . .. . . . . .. . . . .. . . . . .. . . . .. . . . .. . Breakfast Lunch Snacks Dinner Vegetarian 141 (78%) 80 (47%) 145 (91%) 57 (35%) With meat 39 (22%) 89 (53%) 14 (9%) 105 (65%) Total 180 169 159 162
. . . .. . . . .. . .
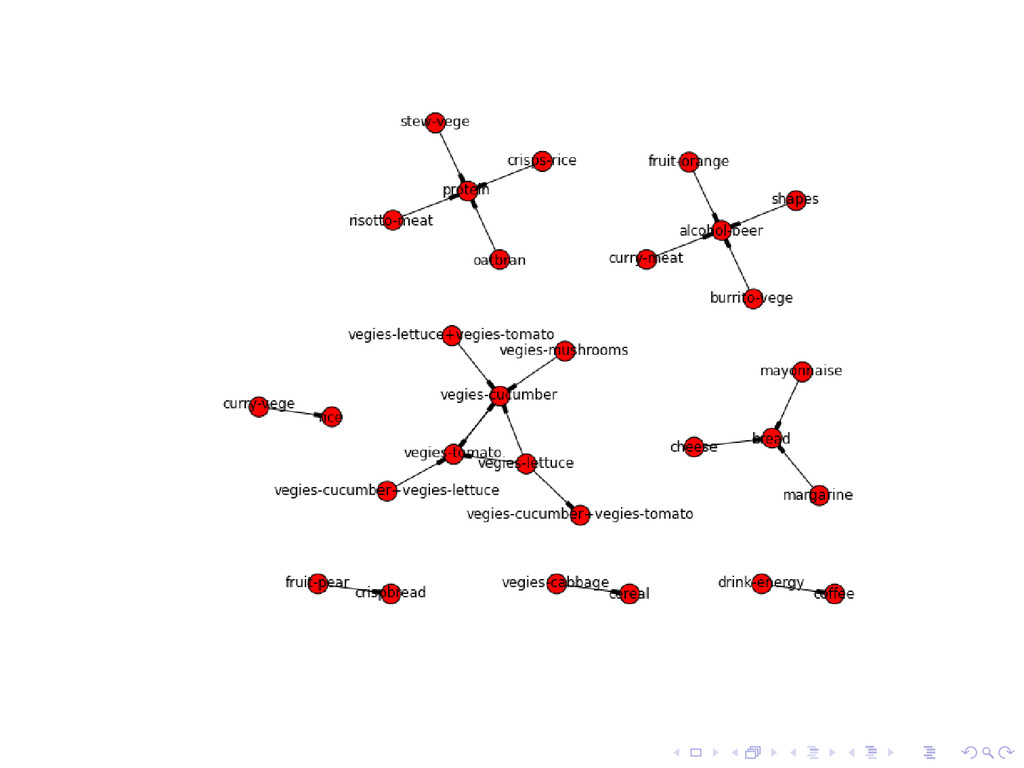
. .. . . . . .. . . . .. . . . .. . . . .. . . . . .. . . . .. . . . .. . . . .. . . . . .. . . . .. . . . .. . . . .. . . . . .. . . . .. . . . . .. . . . .. . . . .. . What foods do I eat together?
. . . .. . . . .. . .
. .. . . . . .. . . . .. . . . .. . . . .. . . . . .. . . . .. . . . .. . . . .. . . . . .. . . . .. . . . .. . . . .. . . . . .. . . . .. . . . . .. . . . .. . . . .. . Itemsets Support Food 46 vegies-cucumber + vegies-tomato 37 crispbread + vegies-tomato 37 crispbread + vegies-cucumber 34 crispbread + vegies-cucumber + vegies-tomato 32 fruit-banana + protein 32 bread + vegies-tomato 30 alcohol-beer + vegies-tomato 30 alcohol-beer + vegies-cucumber 29 coffee + protein 29 bread + vegies-cucumber
. . . .. . . . .. . .
. .. . . . . .. . . . .. . . . .. . . . .. . . . . .. . . . .. . . . .. . . . .. . . . . .. . . . .. . . . .. . . . .. . . . . .. . . . .. . . . . .. . . . .. . . . .. .
. . . .. . . . .. . .
. .. . . . . .. . . . .. . . . .. . . . .. . . . . .. . . . .. . . . .. . . . .. . . . . .. . . . .. . . . .. . . . .. . . . . .. . . . .. . . . . .. . . . .. . . . .. . How much caffeine do I consume?
. . . .. . . . .. . .
. .. . . . . .. . . . .. . . . .. . . . .. . . . . .. . . . .. . . . .. . . . .. . . . . .. . . . .. . . . .. . . . .. . . . . .. . . . .. . . . . .. . . . .. . . . .. . Jan 05 2013 Feb 08 2013 May 01 2013 Jun 03 2013 Jul 22 2013 Sep 01 2013 Oct 01 2013 0 20 40 60 80 100 Caffeine consumption per day (rolling mean) Caffeine (mg)
. . . .. . . . .. . .
. .. . . . . .. . . . .. . . . .. . . . .. . . . . .. . . . .. . . . .. . . . .. . . . . .. . . . .. . . . .. . . . .. . . . . .. . . . .. . . . . .. . . . .. . . . .. . Data wierdness ▶ Varying granularity of meals ▶ Low-density foods sometimes left out ▶ Not enough detail for intolerances
. . . .. . . . .. . .
. .. . . . . .. . . . .. . . . .. . . . .. . . . . .. . . . .. . . . .. . . . .. . . . . .. . . . .. . . . .. . . . .. . . . . .. . . . .. . . . . .. . . . .. . . . .. . In retrospect ▶ Great benefits ▶ Measurement has helped me become healthy ▶ Much unresolved ▶ What foods make me most alert? ▶ Am I intolerant to foods I eat? ▶ Need matching datasets to answer more questions
. . . .. . . . .. . .
. .. . . . . .. . . . .. . . . .. . . . .. . . . . .. . . . .. . . . .. . . . .. . . . . .. . . . .. . . . .. . . . .. . . . . .. . . . .. . . . . .. . . . .. . . . .. . Thanks!