Upgrade to Pro — share decks privately, control downloads, hide ads and more …

Sequential phase transitions in percolation on complex networks

Sequential phase transitions in percolation on complex networks

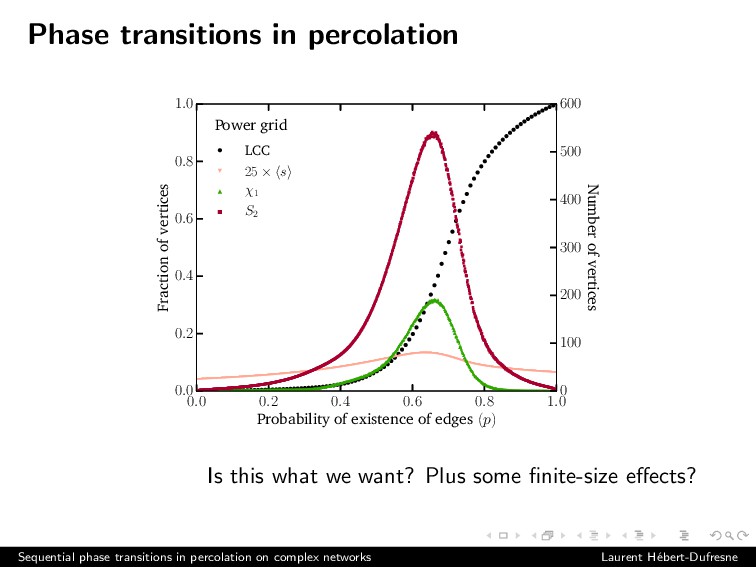
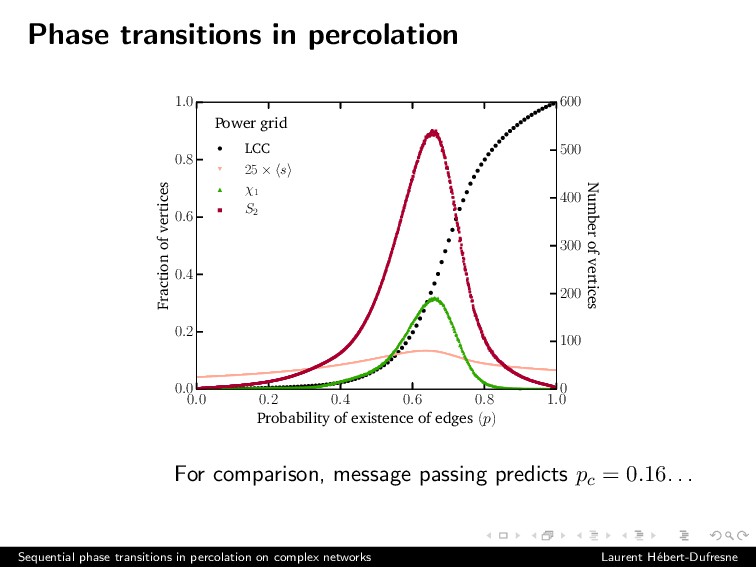
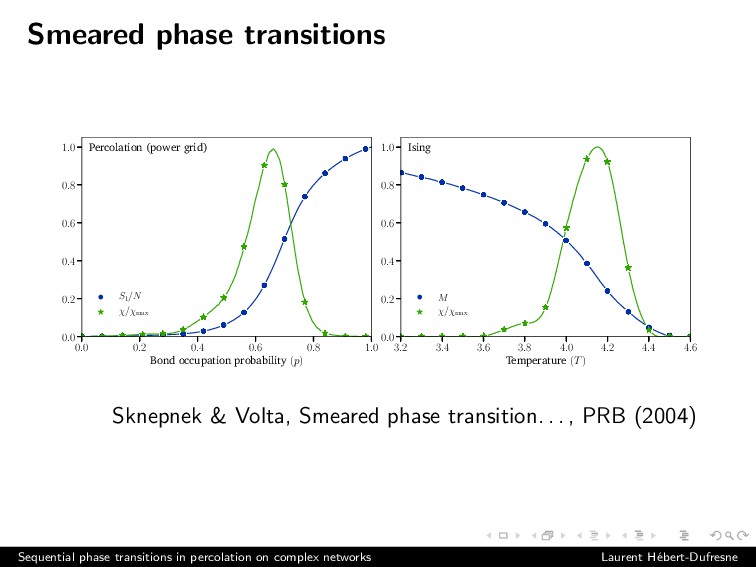
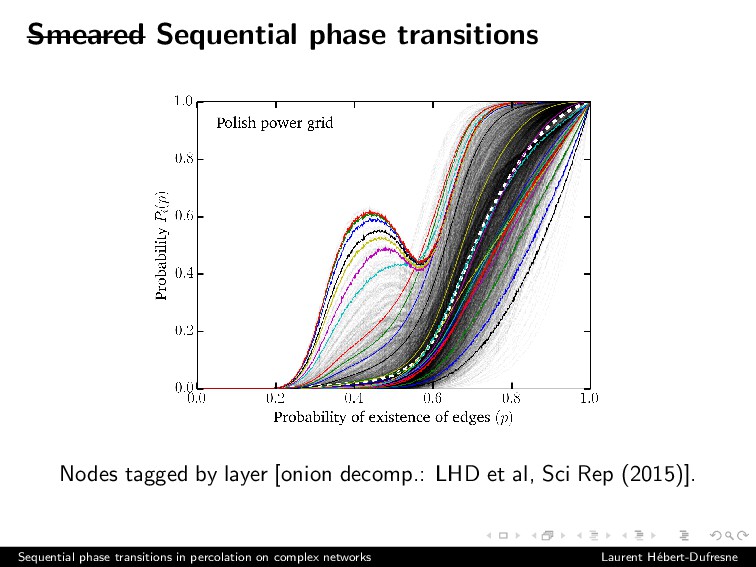
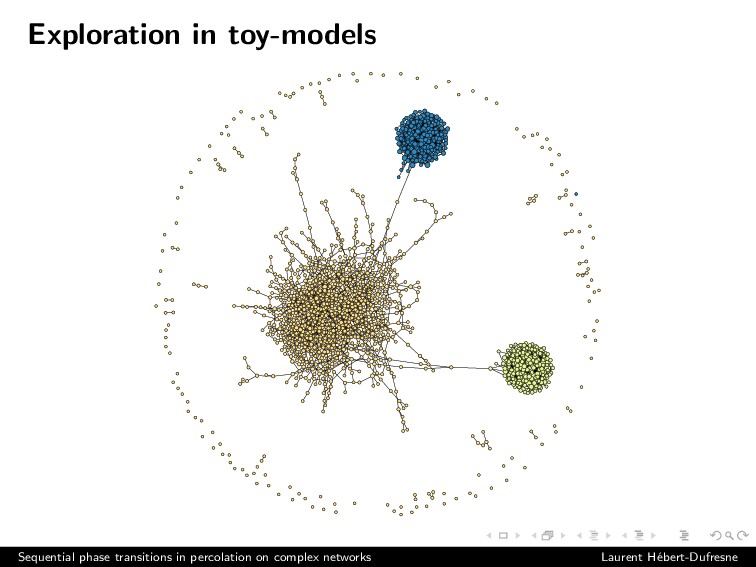
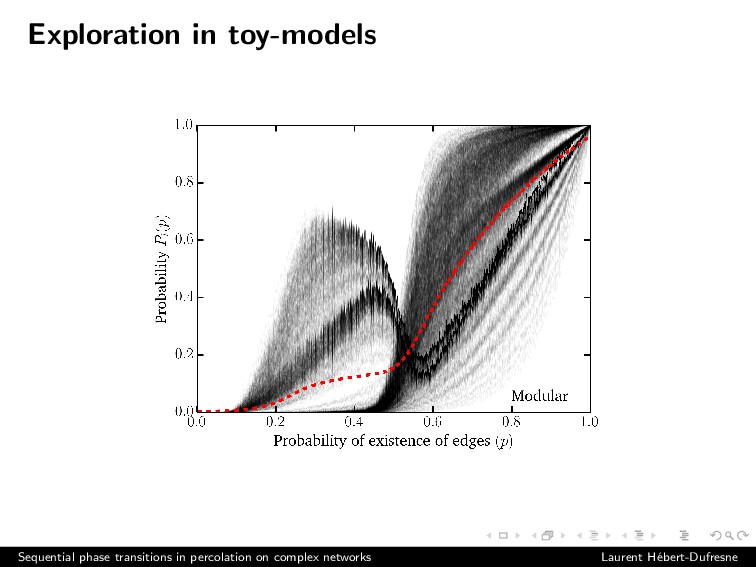
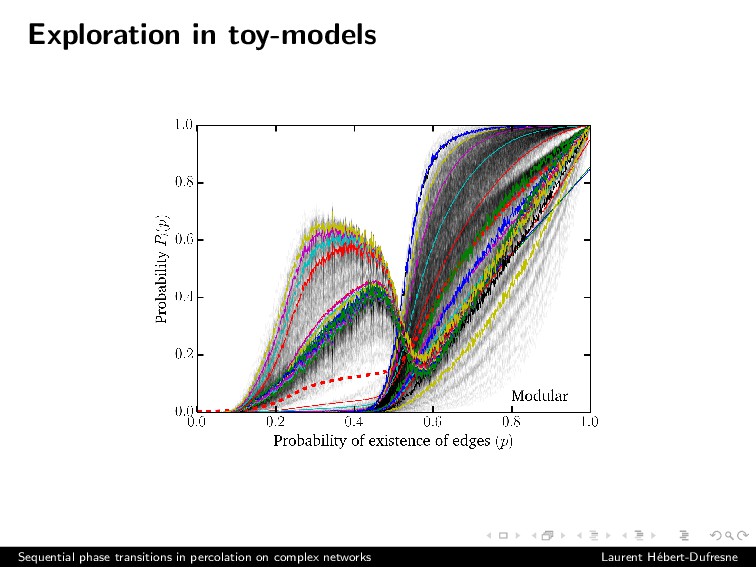
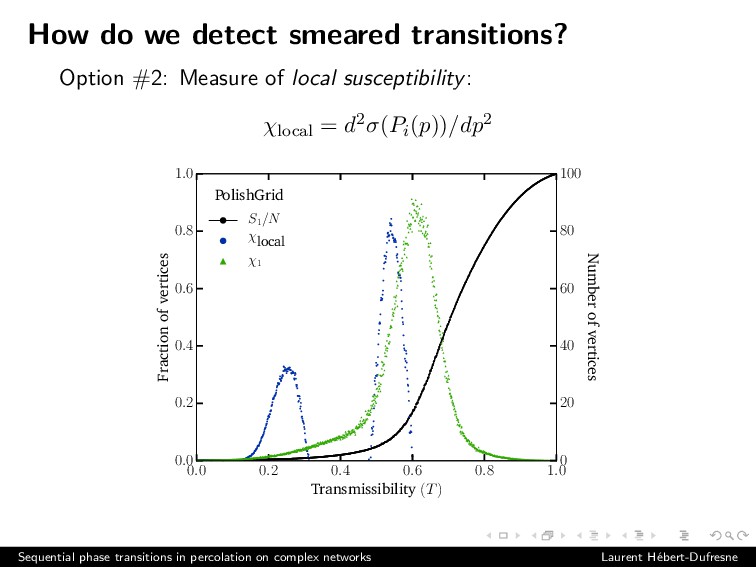
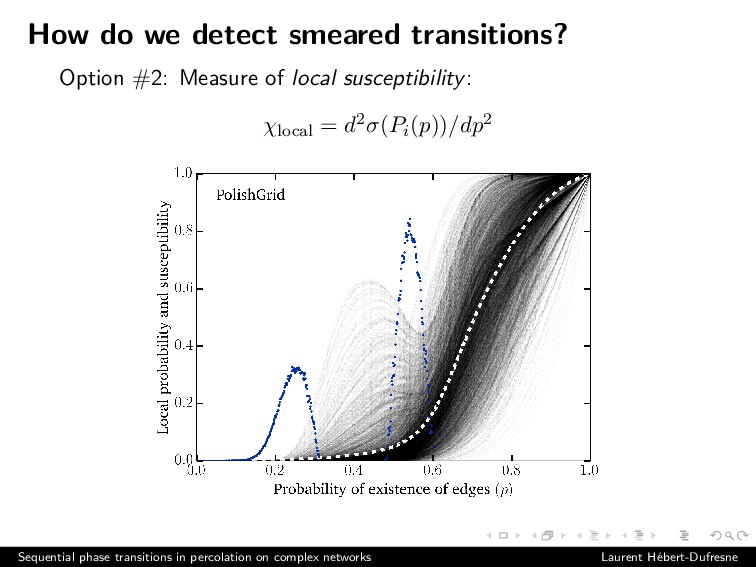
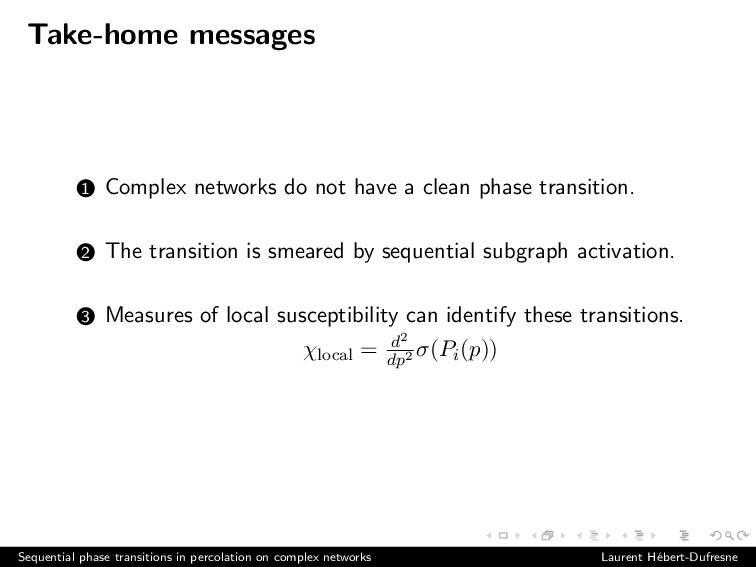
Percolation on complex networks is used both as a model for dynamics \textit{on} networks, such as network robustness or epidemic spreading, and as a benchmark for our models \textit{of} networks, where our ability to describe percolation measures our ability to describe the networks themselves. In both applications, correctly identifying the phase transition of percolation on real-world networks is of obvious critical importance. Unfortunately, this phase transition is obfuscated by the finite size of real systems, which makes it hard to distinguish finite size effects from errors in our methodology which may fail to capture important structural features. Here, we borrow the perspective of smeared phase transitions and argue that most observed errors are due to the complex structure of real networks and not to finite size effects. In fact, several real networks often used as benchmarks feature a smeared phase transition where inhomogeneities in the spatial distribution of the order parameter do not vanish in the thermodynamic limit. We find that these smeared transitions are sometimes better described as sequential phase transitions within correlated subsystems. Our results shed light not only on the nature of the percolation transition in complex systems, but also provide two important insights on the numerical and analytical tools we use to study them. First, we propose a measure of local susceptibility to better detect both clean and smeared phase transitions by looking at the spatial variability of the order parameter. Second, we highlight a shortcoming in state-of-the-art analytical approaches such as message passing, which can detect smeared transitions but not characterize their nature.

Laurent Hébert-Dufresne

June 13, 2018
Tweet

More Decks by Laurent Hébert-Dufresne

Other Decks in Science

Transcript

  1. Sequential phase transitions in percolation on complex networks Laurent H´

    ebert-Dufresne [email protected] :: @LHDnets Joint work with Antoine Allard Sequential phase transitions in percolation on complex networks Laurent H´ ebert-Dufresne
  2. Percolation on complex networks 1 Take a network. 2 Randomly

    keep a fraction p of edges (“occupied” edges). 3 Measure the number and size of components. Sequential phase transitions in percolation on complex networks Laurent H´ ebert-Dufresne
  3. Percolation on complex networks 1 Take a network. 2 Randomly

    keep a fraction p of edges (“occupied” edges). 3 Measure the number and size of components. • Occupied edges can be “good” (active connections on the Internet) or “bad” (transmissions of diseases). • Models resilience to failures, or the outcome of an epidemic. • It is also a benchmark for the quality of our network models. Sequential phase transitions in percolation on complex networks Laurent H´ ebert-Dufresne
  4. Percolation on complex networks 0.0 0.2 0.4 0.6 0.8 1.0

    Probability of existence of edges (p) 0.0 0.2 0.4 0.6 0.8 1.0 Fraction of vertices Power grid LCC Power grid from Watts & Strogatz, Nature (2000) and others. Sequential phase transitions in percolation on complex networks Laurent H´ ebert-Dufresne
  5. Phase transitions in percolation 0.0 0.2 0.4 0.6 0.8 1.0

    Probability of existence of edges (p) 0.0 0.2 0.4 0.6 0.8 1.0 Fraction of vertices Power grid LCC How to detect the phase transition of a real system? Sequential phase transitions in percolation on complex networks Laurent H´ ebert-Dufresne
  6. Phase transitions in percolation 0.0 0.2 0.4 0.6 0.8 1.0

    Probability of existence of edges (p) 0.0 0.2 0.4 0.6 0.8 1.0 Fraction of vertices LCC 25 × s 0 10 20 30 40 50 60 70 80 90 Number of vertices Power grid Allard, Althouse, Scarpino & H´ ebert-Dufresne, PNAS ’17 Sequential phase transitions in percolation on complex networks Laurent H´ ebert-Dufresne
  7. Phase transitions in percolation 0.0 0.2 0.4 0.6 0.8 1.0

    Probability of existence of edges (p) 0.0 0.2 0.4 0.6 0.8 1.0 Fraction of vertices LCC 25 × s χ1 0 50 100 150 200 Number of vertices Power grid Radicchi, Predicting percolation thresholds. . . , PRE ’15 Sequential phase transitions in percolation on complex networks Laurent H´ ebert-Dufresne
  8. Phase transitions in percolation 0.0 0.2 0.4 0.6 0.8 1.0

    Probability of existence of edges (p) 0.0 0.2 0.4 0.6 0.8 1.0 Fraction of vertices LCC 25 × s χ1 S2 0 100 200 300 400 500 600 Number of vertices Power grid Zhang, Spectral estimation of the percolation transition, PRE ’17 Sequential phase transitions in percolation on complex networks Laurent H´ ebert-Dufresne
  9. Results on real networks 0.0 0.2 0.4 0.6 0.8 1.0

    Probability of existence of edges (p) 0.0 0.2 0.4 0.6 0.8 1.0 Fraction of vertices 0 10 20 30 40 50 60 Number of vertices PGP Pretty-Good-Privacy network Sequential phase transitions in percolation on complex networks Laurent H´ ebert-Dufresne
  10. Phase transitions in percolation 0.0 0.2 0.4 0.6 0.8 1.0

    Probability of existence of edges (p) 0.0 0.2 0.4 0.6 0.8 1.0 Fraction of vertices LCC 25 × s χ1 S2 0 100 200 300 400 500 600 Number of vertices Power grid Is this what we want? Plus some finite-size effects? Sequential phase transitions in percolation on complex networks Laurent H´ ebert-Dufresne
  11. Phase transitions in percolation 0.0 0.2 0.4 0.6 0.8 1.0

    Probability of existence of edges (p) 0.0 0.2 0.4 0.6 0.8 1.0 Fraction of vertices LCC 25 × s χ1 S2 0 100 200 300 400 500 600 Number of vertices Power grid For comparison, message passing predicts pc = 0.16. . . Sequential phase transitions in percolation on complex networks Laurent H´ ebert-Dufresne
  12. Smeared phase transitions 0.0 0.2 0.4 0.6 0.8 1.0 Bond

    occupation probability (p) 0.0 0.2 0.4 0.6 0.8 1.0 Percolation (power grid) S1 /N χ/χmax 3.2 3.4 3.6 3.8 4.0 4.2 4.4 4.6 Temperature (T) 0.0 0.2 0.4 0.6 0.8 1.0 Ising M χ/χmax Sknepnek & Volta, Smeared phase transition. . . , PRB (2004) Sequential phase transitions in percolation on complex networks Laurent H´ ebert-Dufresne
  13. Smeared phase transitions Phase transitions with non-vanishing variance in the

    distribution of the local order parameter. Sequential phase transitions in percolation on complex networks Laurent H´ ebert-Dufresne
  14. Smeared phase transitions Phase transitions with non-vanishing variance in the

    distribution of the local order parameter. In percolation: • Order parameter: Fractional size S of the largest component (LCC). • Local order parameter: Probability Pi that node i is in the LCC. • Related through S = Pi /N. Sequential phase transitions in percolation on complex networks Laurent H´ ebert-Dufresne
  15. Smeared phase transitions Distribution of local order parameter in small

    Erd˝ os-R´ enyi graphs. Sequential phase transitions in percolation on complex networks Laurent H´ ebert-Dufresne
  16. Smeared phase transitions Distribution of local order parameter in complex

    networks. Sequential phase transitions in percolation on complex networks Laurent H´ ebert-Dufresne
  17. Smeared Sequential phase transitions Nodes tagged by degree. Sequential phase

    transitions in percolation on complex networks Laurent H´ ebert-Dufresne
  18. Smeared Sequential phase transitions Nodes tagged by coreness (k-core centrality).

    Sequential phase transitions in percolation on complex networks Laurent H´ ebert-Dufresne
  19. Smeared Sequential phase transitions Nodes tagged by layer [onion decomp.:

    LHD et al, Sci Rep (2015)]. Sequential phase transitions in percolation on complex networks Laurent H´ ebert-Dufresne
  20. Finite-size effects? Hard to tell. If we double the power

    grid, do we expect 1 the same core, 2 twice as many cores. 3 or one core twice as large? Sequential phase transitions in percolation on complex networks Laurent H´ ebert-Dufresne
  21. Finite-size effects? Hard to tell. If we double the power

    grid, do we expect 1 the same core, 2 twice as many cores. 3 or one core twice as large? The choice is best left to experts. But our mathematical models have to choose, and they pick option # 3. Sequential phase transitions in percolation on complex networks Laurent H´ ebert-Dufresne
  22. A problem with message passing? MPA predicts a transition at

    pc = 0.184. Is that what we want? Sequential phase transitions in percolation on complex networks Laurent H´ ebert-Dufresne
  23. How do we detect smeared transitions? Sequential phase transitions in

    percolation on complex networks Laurent H´ ebert-Dufresne
  24. How do we detect smeared transitions? Option #1: Look at

    set of Pi(p) curves, or aggregated over some centrality metrics (onion layer). Sequential phase transitions in percolation on complex networks Laurent H´ ebert-Dufresne
  25. How do we detect smeared transitions? Option #2: Measure of

    local susceptibility: χlocal = d2σ(Pi(p))/dp2 0.0 0.2 0.4 0.6 0.8 1.0 Transmissibility (T) 0.0 0.2 0.4 0.6 0.8 1.0 Fraction of vertices S1 /N χlocal χ1 0 20 40 60 80 100 Number of vertices PolishGrid Sequential phase transitions in percolation on complex networks Laurent H´ ebert-Dufresne
  26. How do we detect smeared transitions? Option #2: Measure of

    local susceptibility: χlocal = d2σ(Pi(p))/dp2 Sequential phase transitions in percolation on complex networks Laurent H´ ebert-Dufresne
  27. Take-home messages 1 Complex networks do not have a clean

    phase transition. 2 The transition is smeared by sequential subgraph activation. 3 Measures of local susceptibility can identify these transitions. χlocal = d2 dp2 σ(Pi(p)) Sequential phase transitions in percolation on complex networks Laurent H´ ebert-Dufresne
  28. If you have any questions The smeared phase transition of

    percolation on real complex networks Preprint by H´ ebert-Dufresne & Allard available soon. Until then: [email protected] or @LHDnets Sequential phase transitions in percolation on complex networks Laurent H´ ebert-Dufresne